CHAPTER 24 Clinical Techniques of Positron Emission Tomography and PET/CT
RADIOPHARMACEUTICALS
Although several tracers have been used for evaluating myocardial perfusion with PET, the most widely used in clinical practice are rubidium 82 and ammonia N 13. In addition, 18FDG is the radiotracer of choice for the evaluation of myocardial viability.1
Rubidium 82
After infusion, rubidium 82 rapidly crosses the capillary membrane and is actively transported to the cell via the sodium/potassium ATP transporter, which depends on coronary blood flow.2 Compared with fluorine 18 or nitrogen 13, the positron range and the spatial uncertainty in the location of the decaying nucleus of rubidium 82 (2.6 mm FWHM [full width at half maximum]) is greater than for fluorine 18 (0.2 mm FWHM) or nitrogen 13 (0.7 mm FWHM), mitigating the improved spatial resolution of PET.
Ammonia N 13
Being a cyclotron product, ammonia N 13 use in routine clinical practice is limited to institutions that have a cyclotron on site. It has a physical half-life of 9.96 minutes and has a shorter positron range compared with rubidium 82, resulting in higher signal-to-noise ratio. After injection, ammonia N 13 rapidly disappears from the circulation, permitting the acquisition of images of excellent quality. Although the sequestration of ammonia N 13 in the lungs is usually minimal, it may be increased in patients with depressed left ventricular systolic function or chronic pulmonary disease and, occasionally, in smokers; this may adversely affect the quality of the images. In these cases, it may be necessary to increase the time between injection and image acquisition to optimize the contrast between myocardial and background activity. When inside the myocyte, ammonia N 13 is incorporated into the glutamine pool and becomes metabolically trapped. Only a small fraction diffuses back into the intravascular space.3
Myocardial retention of ammonia N 13 is heterogeneous, with retention in the lateral left ventricular wall being about 10% lower than that of other segments, even in normal subjects. This heterogeneous retention could result in an apparent perfusion defect in the inferolateral wall, limiting its evaluation. Ammonia N 13 allows the acquisition of ungated and gated images of excellent quality. These studies take full advantage of the superior resolution of PET relative to single photon emission computed tomography (SPECT) because the half-life of ammonia N 13 is sufficiently long, and its average positron range is very short. Gated ammonia N 13 imaging can provide accurate assessments of regional and global cardiac function.4 This imaging agent is not well suited for peak stress gated imaging, however, because of the 3- to 4-minute time interval between radiotracer injection and start of imaging, and the relatively long (20 minutes) acquisition time.
ASSESSMENT OF MYOCARDIAL PERFUSION
Imaging Protocols
Figure 24-1 illustrates common protocols used for imaging myocardial perfusion with PET/CT, where the low-dose CT scan is used for attenuation correction.1 This scan is also called a CT-based attenuation correction scan (CTAC).
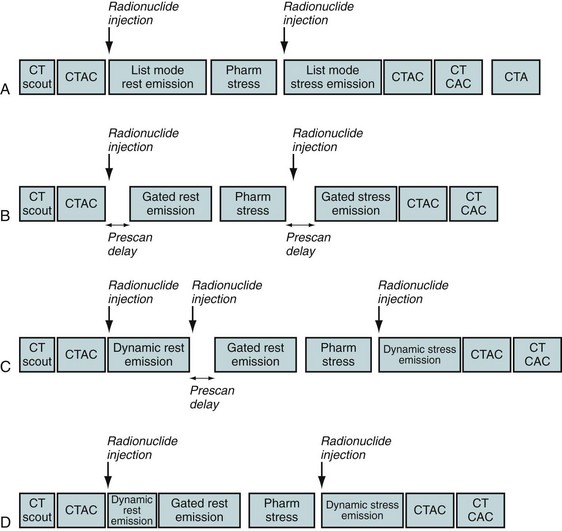
 FIGURE 24-1
Emission Scans
Different protocols can be used to acquire emission scans (see Fig. 24-1), as follows:
Stress testing is most commonly performed using adenosine, dipyridamole, or dobutamine. Protocols using exercise stress testing with PET/CT have been described.5 The use of exercise PET in clinical practice is very limited, however, especially with shorter half-life agents such as rubidium 82 (half-life 76 seconds).
Quality Assurance for Cardiac PET/CT
 FIGURE 24-2
Diagnostic Accuracy
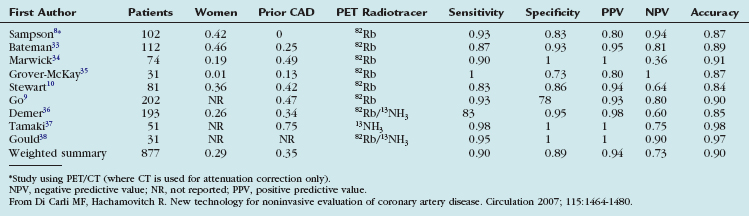
Table 24-1 summarizes the published studies documenting the diagnostic accuracy of myocardial perfusion PET imaging for detecting obstructive CAD.7 The average weighted sensitivity for detecting at least one coronary artery with greater than 50% stenosis is 90% (range 83% to 100%), and the average specificity is 89% (range 73% to 100%). The corresponding average positive and negative predictive values are 94% (range 80% to 100%) and 73% (range 36% to 100%), and the overall diagnostic accuracy is 90% (range 84% to 98%). Most of the available data have been obtained with dedicated PET cameras, rather than with PET/CT systems. In a more recent study using PET/CT (where the CT was used only for attenuation correction), Sampson and colleagues8 reported a sensitivity of 93%, a specificity of 83%, and a normalcy rate of 100%. In this study of patients without known prior CAD, the positive and negative predictive values of PET/CT were 80% and 94%, with an overall accuracy of 87%. All patients with a low likelihood for CAD showed normal scans, for a normalcy rate of 100%. The sensitivity for detecting CAD in patients with single vessel and multivessel (two or more vessels) disease was 92% and 95%. These results were applicable to men and women and to obese and nonobese individuals.
Comparative Studies of Positron Emission Tomography versus Single Photon Emission Computed Tomography
Two studies have performed a direct comparison of the diagnostic accuracy of rubidium 82 myocardial perfusion PET and thallium 201 imaging in the same patient populations. Go and colleagues9 compared PET and SPECT in 202 patients and showed higher sensitivity with PET than with SPECT (93% vs. 76%), without significant changes in specificity (78% vs. 80%). Stewart and coworkers10 compared PET and SPECT in 81 patients and observed a higher specificity with PET than with SPECT (83% vs. 53%), without significant differences in sensitivity (86% vs. 84%). The differences between these two studies are likely to be attributable to patient selection resulting in differences in prescan likelihood of CAD.
More recently, Bateman and associates11 compared rubidium 82 PET and Tc 99m sestamibi SPECT in two matched patient cohorts undergoing clinically indicated pharmacologic stress perfusion imaging using contemporary technology for SPECT and PET. Overall diagnostic accuracy was higher for PET than for SPECT (87% vs. 71% with a 50% angiographic threshold, and 89% vs. 79% with a 70% angiographic threshold). Differences in diagnostic accuracy reflected primarily the increased specificity (with a marginal advantage in sensitivity) of PET versus SPECT, and applied to men and women and to obese and nonobese individuals.
Evaluation of Multivessel Coronary Artery Disease
The diagnosis of multivessel or left main CAD with diffuse balanced ischemia using MPI remains a challenge. PET (similar to SPECT) often uncovers only the coronary territory supplied by the most severe stenosis. The use of ancillary high-risk markers often helps in ascertaining the presence of multivessel CAD. ECG gating provides a unique opportunity to assess left ventricular function at rest and during peak stress (as opposed to poststress with gated SPECT). More recent data suggest that in normal subjects, LVEF increases during peak vasodilator stress.12 In the presence of CAD, changes in LVEF (from baseline to peak stress) are inversely related to the magnitude of perfusion abnormalities during stress (reflecting myocardium at risk) (Fig. 24-3) and the extent of angiographic CAD (Fig. 24-4). In patients with three-vessel or left main CAD, LVEF during peak stress decreases even in the absence of apparent perfusion abnormalities (Fig. 24-5). In contrast, patients without significant CAD or with one-vessel disease show a normal increase in LVEF. Consequently, the negative predictive value of an increase in LVEF (from rest to peak stress) of 5% or greater to exclude the presence of three-vessel or left main CAD or both is 97%.12
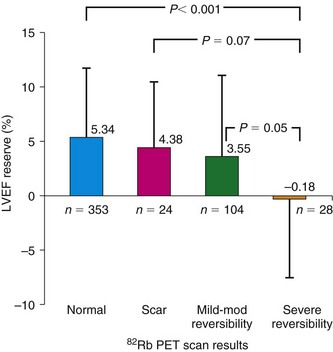
 FIGURE 24-3
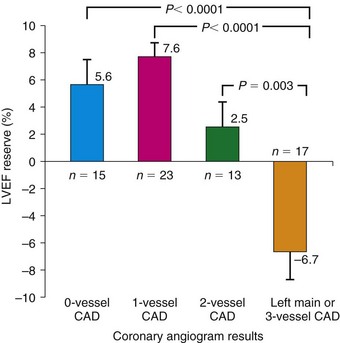
 FIGURE 24-4
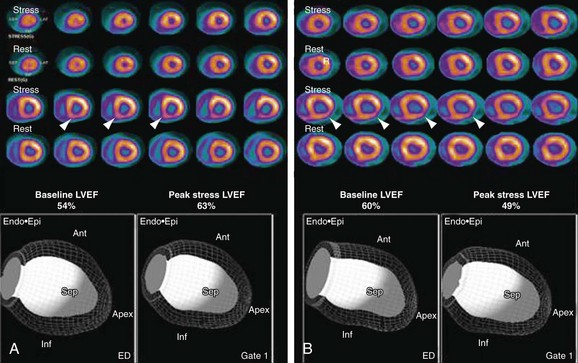
 FIGURE 24-5
PET measurements of myocardial blood flow (in mL/min/g of myocardium) and coronary vasodilator reserve may also help overcome the limitations of relative perfusion assessments with PET to uncover the presence of multivessel CAD. Because myocardial blood flow (in mL/min/g of tissue) and coronary vasodilator reserve (the ratio between peak and rest myocardial blood flow) are inversely and nonlinearly related to stenosis severity, quantitative estimates of coronary hemodynamics by PET allow better definition of the extent of obstructive CAD. PET quantification of myocardial blood flow is well validated using ammonia 13 N.13,14 Quantitative approaches with rubidium 82 have also been developed.15,16 Validation studies in animals and humans are currently under way.
Risk Stratification
Studies documenting the incremental prognostic value of PET perfusion imaging in predicting patient outcomes are beginning to emerge. Yoshinaga and coworkers17 studied the prognostic value of dipyridamole stress rubidium 82 PET in 367 patients who were followed for 3.1 ± 0.9 years. The extent and severity of perfusion defects with stress PET were associated with increasing frequency of adverse events. The negative predictive value of a normal scan to predict hard events (i.e., myocardial infarction or cardiac death) was very high; patients with normal stress PET had an event rate of 0.4%/year. This study, the largest published PET prognosis study to date, was limited, however, by the occurrence of only 17 hard events.
Preliminary data from our laboratory in 1602 consecutive patients undergoing rest-stress rubidium 82 myocardial perfusion PET/CT imaging also suggest that this technique provides incremental value to clinical variables in predicting overall survival.18 In contrast to previous studies, this study was adequately powered by the occurrence of 113 deaths (7% of the study cohort) during a median follow-up period of 511 days. In keeping with previous studies, increases in the extent and severity of stress perfusion defects translated into proportional increases in predicted mortality. In addition, preliminary data from our laboratory in 1274 consecutive patients also confirm the incremental prognostic value of LVEF over stress perfusion imaging.19 As expected, this analysis showed that mortality hazard was inversely related to LVEF. MPI added incremental value to LVEF (at any LVEF, a higher summed stress score had greater risk), and LVEF added incremental value to MPI (i.e., at any summed stress score, a lower LVEF had greater risk).
The potential to acquire and quantify rest and stress myocardial perfusion and CT information from a single dual-modality study opens the door to expand the prognostic potential of stress nuclear imaging. More recent data from our laboratory suggest that quantification of coronary artery calcium (CAC) scores at the time of stress nuclear imaging using a hybrid approach with PET/CT can enhance risk predictions in patients with suspected CAD.20 In a consecutive series of 621 patients undergoing stress PET imaging and CAC scoring in the same clinical setting, risk-adjusted analysis showed a stepwise increase in adverse events (death and myocardial infarction) with increasing levels of CAC score for any level of perfusion abnormality. This finding was observed in patients with and without evidence of ischemia on PET MPI.
The annualized event rate in patients with normal PET MPI and no CAC was substantially lower than in patients with normal PET MPI and a CAC score of 1000 or greater (Fig. 24-6). Likewise, the annualized event rate in patients with ischemia on PET MPI and no CAC was lower than in patients with ischemia and a CAC score of 1000 or greater. These findings suggest incremental risk stratification by incorporating information regarding the anatomic extent of atherosclerosis in conventional models using nuclear imaging alone, a finding that may serve as a more rational basis for personalizing the intensity and goals of medical therapy in a more cost-effective manner. Although CT angiography as an adjunct to perfusion imaging could expand the opportunities to identify patients with noncalcified plaques at greater risk of adverse cardiovascular events, it is unclear how much added prognostic information there is in the contrast-enhanced coronary CT angiography scan over the simple noncontrast CT scan for CAC determination.21
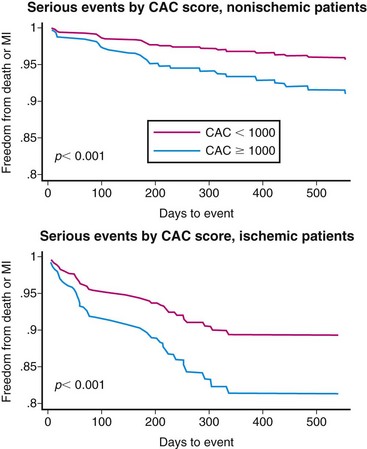
 FIGURE 24-6
ASSESSMENT OF MYOCARDIAL VIABILITY
In addition to assessment of myocardial perfusion, PET/CT plays an important role in the evaluation of viability in patients with ischemic cardiomyopathy. This evaluation is of utmost clinical importance because high-risk surgical revascularization seems to afford a long-term survival benefit based on small series.22 Data from large-scale randomized clinical trials are still pending, however, and the selection of patients with severe left ventricular dysfunction for high-risk revascularization is controversial. It is very important to differentiate left ventricular dysfunction caused by scarring from that arising from viable but dysfunctional myocardium. PET/CT plays an important role in the evaluation of these patients and makes this distinction possible.
Hibernation versus Stunning
Myocardial scarring results from myocardial infarction or other inflammatory or infiltrative diseases that involve the myocardium. Myocardial stunning is a reversible state of regional contractile dysfunction that can occur after restoration of coronary blood flow following a brief episode of ischemia despite the absence of necrosis.23 Although commonly regarded as an acute phenomenon, stunned myocardium may also occur in patients with chronic coronary stenosis who experience recurrent episodes of ischemia (symptomatic or asymptomatic) in the same territory. This mechanism is probably the most common form of stunning in patients with chronic left ventricular dysfunction secondary to CAD. Myocardial hibernation refers to a state of persistent left ventricular dysfunction associated with chronically reduced blood flow but preserved viability.24 This chronic downregulation in contractile function at rest is thought to represent a protective mechanism whereby the heart reduces its oxygen requirements to ensure myocyte survival. This protective mechanism can result in a considerable amount of myocardium that is rendered hypocontractile, however, and it may contribute to overall left ventricular dysfunction. Different metabolic patterns are seen in these three states with PET metabolic imaging using 18FDG, which provides the basis for PET/CT 18FDG imaging.
Normal myocardium uses different energy-producing substrates to fulfill its energy requirements.25 In the fasting state, free fatty acids (FFA) are mobilized in large quantities from triglycerides stored in adipose tissue. The increased availability of FFA in plasma makes them the preferred energy-producing fuel in the myocardium. In the fed state, however, the increase in plasma glucose and the subsequent increase in insulin levels significantly reduce FFA release from adipose tissue and, consequently, its availability in plasma. In addition, the increased insulin levels mobilize glucose transporters onto the cell membrane, resulting in increased transport and use of exogenous glucose by the myocardium.
PET/CT Viability Imaging Protocols
Because dysfunctional myocardium that improves functionally after revascularization must retain sufficient blood flow and metabolic activity to sustain myocyte viability, the combined assessment of regional blood flow and glucose metabolism seems most attractive for delineating myocardial viability. With this approach, regional myocardial perfusion is first evaluated after the administration of ammonia 13 N or rubidium 82. Because data regarding the magnitude of stress-induced ischemia and resting viability are important for management decisions, the ideal approach should include rest and stress perfusion imaging (Fig. 24-7). Regional glucose uptake is assessed with 18FDG, as described subsequently.
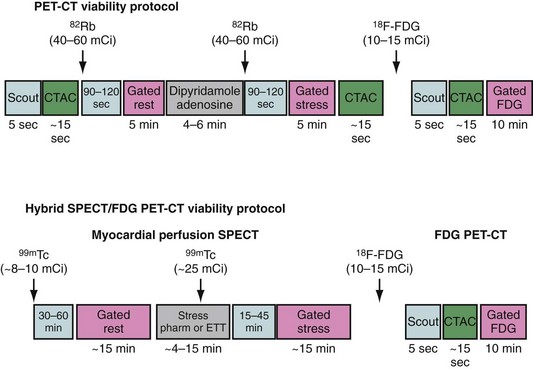
 FIGURE 24-7 Myocardial viability PET/CT protocols. CTAC, CT-based attenuation scan; ETT, exercise treadmill testing.
(From Di Carli MF. Myocardial viability assessment with PET and PET/CT. In Di Carli MF, Lipton MJ [eds]. Cardiac PET and PET/CT Imaging. New York, 2007, Springer, pp 250-269.)
Patient Preparation for 18FDG Imaging
A detailed step-by-step description of the available methods for 18FDG imaging is provided by the “Guidelines for PET Imaging” published by the American Society of Nuclear Cardiology and the Society of Nuclear Medicine.6 The most commonly used approaches for 18FDG imaging include the following (Fig. 24-8):
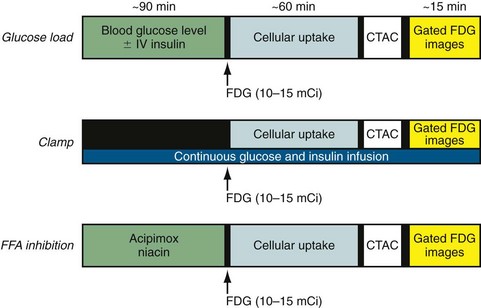
 FIGURE 24-8
Myocardial Perfusion and Glucose-Loaded 18FDG Patterns
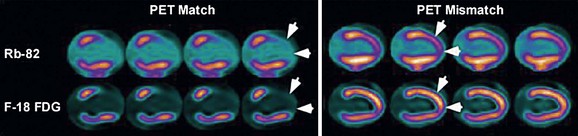
 FIGURE 24-9
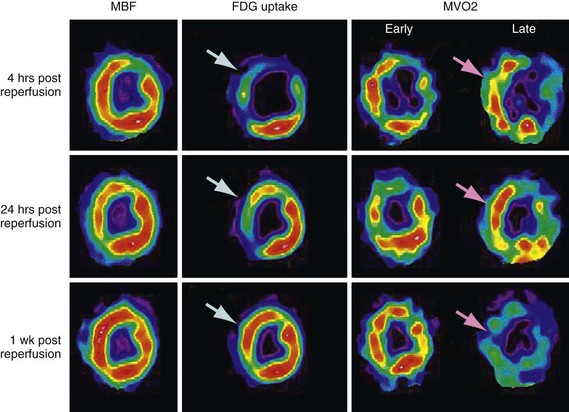
 FIGURE 24-10
 ]) (right column) were obtained with acetate 11 C; the early phase denotes delivery of the tracer to the myocardium, whereas the late phase represents regional washout of the tracer through the tricarboxylic acid cycle (myocardial oxidation). Top panel, Corresponding mid-ventricular short-axis sections of regional blood flow, glucose, and
  4 hours after reperfusion. The flow images (left) show near-normal perfusion in the stunned regions (i.e., anterior and anterior septum). Stunned regions showed reduced 18FDG use (arrow), however, and slow clearance of acetate 11 C (impaired oxidation) relative to normal myocardium (lateral wall). Middle panel, One day after reperfusion. Myocardial perfusion in stunned myocardium is near-normal, glucose uptake (arrow) remains depressed, and the
  is still lower (arrow) than in normal myocardium. Bottom panel, One week after reperfusion. Blood flow, glucose uptake, and
  are largely homogeneous. Wall motion and metabolism showed a parallel recovery with time. MBF, myocardial blood flow.
The patterns of normal perfusion and metabolism or of a PET mismatch identify potentially reversible myocardial dysfunction, whereas the PET match pattern identifies irreversible myocardial dysfunction. The reversed perfusion-metabolism mismatch has been described in the context of repetitive myocardial stunning,26 and in patients with left bundle branch block.27 Quantitation of regional myocardial perfusion and 18FDG tracer uptake and their difference can be helpful to assess objectively the magnitude of viability. In addition, gated 18FDG-PET/CT images can be used to assess global left ventricular function.
Accuracy of PET/CT to Predict Functional Recovery
Myocardial Perfusion
Using only regional myocardial perfusion information, contractile dysfunction was predicted to be reversible after revascularization when regional blood flow was only mildly or moderately reduced (>50% of normal), and irreversible when regional blood flow was severely reduced (<50% of normal). Using these criteria, the average positive predictive accuracy of blood flow estimates for predicting functional recovery after revascularization is 63% (range 45% to 78%), whereas the average negative predictive accuracy is 63% (range 45% to 100%). 18FDG imaging adds significant independent information for distinguishing reversible from irreversible myocardial dysfunction and improving the diagnostic accuracy of PET/CT in predicting functional recovery.28
Combined Myocardial Perfusion and 18FDG
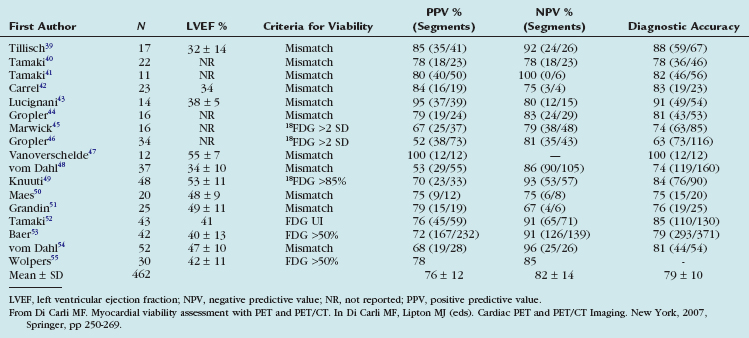
The experience with the combined blood flow/18FDG approach using PET or the PET/SPECT hybrid technique (SPECT perfusion with 18FDG-PET imaging) has been extensively documented in 17 studies including 462 patients (Table 24-2).28 Contractile dysfunction was predicted to be reversible after revascularization in regions with increased 18FDG uptake or a perfusion-metabolism mismatch, and irreversible in regions with reduced 18FDG uptake or a perfusion-metabolism match pattern. Using these criteria, the average positive predictive accuracy for predicting improved segmental function after revascularization is 76% (range 52% to 100%), whereas the average negative predictive accuracy is 82% (range 67% to 100%).
TABLE 24-2 Predictive Values for Segmental Functional Recovery after Revascularization Using Combined Estimates of Myocardial Perfusion and 18FDG Metabolism with PET
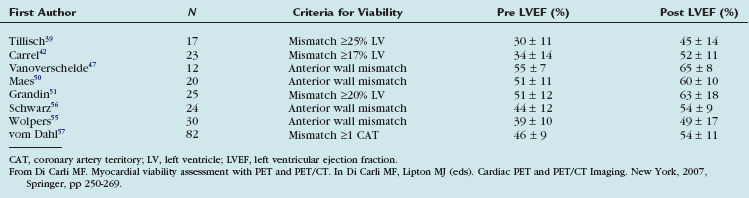
Several studies using different PET approaches have shown that the gain in global left ventricular systolic function after revascularization is related to the magnitude of viable myocardium assessed preoperatively (Table 24-3).28 These data show that clinically meaningful changes in global left ventricular function can be expected after revascularization only in patients with large areas of hibernating or stunned myocardium (≥17% of the left ventricular mass). Patients with large areas of PET mismatch (≥18% of the left ventricle), in particular areas located in the territory served by the left anterior descending coronary artery, had the greatest clinical benefit.
Impact of Viability Assessment on Patient Outcomes
The goal of viability assessment by PET in the setting of severe ischemic cardiomyopathy is to identify patients in whom revascularization can potentially improve left ventricular function, symptoms, and survival. Multiple studies have addressed this question and are summarized in Table 24-4. The studies included a total of 288 patients with CAD and moderate or severe left ventricular dysfunction. Most of these patients had a history of myocardial infarction and multivessel CAD. Patients with viable myocardium had a consistently higher event rate than patients without viability suggesting an increased risk of a cardiac event for patients with viable myocardium treated medically.
TABLE 24-4 Risk of Cardiac Events for Patients with Moderate to Severe Left Ventricular Dysfunction and Hibernating Myocardium Compared with Patients without Hibernating Myocardium
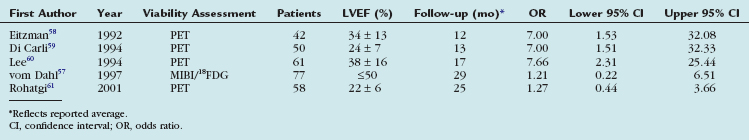
These data suggest that the presence of ischemic but viable myocardium as assessed by 18FDG-PET seems to identify consistently patients with left ventricular dysfunction who are at high risk for cardiac events when treated with medical therapy alone. In addition, Allman and colleagues29 reported a meta-analysis of 24 studies that documented long-term patient outcomes after viability imaging by SPECT, PET, or dobutamine echocardiography in 3088 patients (2228 men, 860 women) with a mean LVEF 32% ± 8% and follow-up for 25 ± 10 months. There was no apparent benefit for revascularization over medical therapy in the absence of demonstrated viability. Meta-regression of the pooled study data in patients with viable myocardium showed an inverse relationship between LVEF and the prognostic benefit associated with revascularization.
The multicenter randomized PARR-2 study did not show a significant reduction in cardiac events in patients with left ventricular dysfunction and suspected coronary disease for 18FDG-PET–assisted management versus standard care.30 The study included 440 patients with severe left ventricular dysfunction and coronary disease being considered for revascularization, heart failure, or transplantation. Patients were randomly assigned to management assisted by 18FDG-PET or standard care. The primary outcome, a composite of cardiac death, MI, or hospitalization within 1 year, was not different between the two groups (30% for the PET arm vs. 36% for the standard arm; relative risk 0.82, P = .16); however, 25% of the patients with PET-indicated revascularization did not have it done. In patients who adhered to PET recommendations and in patients without recent angiography, significant benefits were observed (hazard ratio 0.4, P = .035).
Another target for revascularization in these patients is the control of symptoms and hospital admissions for congestive heart failure. We showed a significant linear correlation between the global extent of a preoperative perfusion-metabolism PET mismatch (reflecting hibernating myocardium) and the percent improvement in functional capacity after coronary artery bypass graft surgery in 36 patients with ischemic cardiomyopathy (LVEF 28% ± 6%) (Fig. 24-11).31 In this study, a perfusion-metabolic PET mismatch involving 18% or greater of the left ventricle on quantitative analysis was associated with a sensitivity of 76% and a specificity of 78% for predicting a significant improvement in heart failure class after bypass surgery.
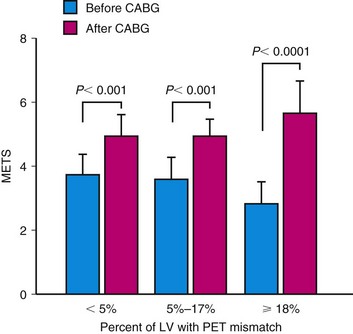
 FIGURE 24-11
CONCLUSIONS AND FUTURE DIRECTIONS
The clinical evidence presented in this chapter indicates that PET and PET/CT are accurate and reproducible techniques for the evaluation of CAD. For PET perfusion imaging, future studies should focus on important patient subgroups that had relatively limited representation—women, obese patients, and diabetics. These subgroups are relevant because they constitute large segments of patients referred for testing for known or suspected CAD. In addition, more information is needed to identify where PET/CT would fit in a clinical strategy as an alternative to SPECT. Many of these questions may be addressed by SPARC (Study of Perfusion versus Anatomy’s Role in CAD), a prospective, multicenter registry comparing stress SPECT, stress PET, and CT angiography alone with respect to outcomes and resource use.32 This study, designed to enroll approximately 3000 patients in 35 to 40 sites, is expected to shed light on the relative value of these newer modalities (PET, CT angiography, hybrid PET/CT) compared with standard approaches (SPECT). In particular, insights may be gained into questions such as which test or combination of tests, sequentially or in combination, in which patients should be used.
1 Di Carli MF, Dorbala S, Meserve J, et al. Clinical myocardial perfusion PET/CT. J Nucl Med. 2007;48:783-793.
2 Selwyn AP, Allan RM, L’Abbate A, et al. Relation between regional myocardial uptake of rubidium-82 and perfusion: absolute reduction of cation uptake in ischemia. Am J Cardiol. 1982;50:112-121.
3 Schelbert HR, Phelps ME, Huang SC, et al. N-13 ammonia as an indicator of myocardial blood flow. Circulation. 1981;63:1259-1272.
4 Hickey KT, Sciacca RR, Bokhari S, et al. Assessment of cardiac wall motion and ejection fraction with gated PET using N-13 ammonia. Clin Nucl Med. 2004;29:243-248.
5 Chow BJ, Beanlands RS, Lee A, et al. Treadmill exercise produces larger perfusion defects than dipyridamole stress N-13 ammonia positron emission tomography. J Am Coll Cardiol. 2006;47:411-416.
6 Bacharach SL, Bax JJ, Case J, et al. PET myocardial glucose metabolism and perfusion imaging. Part 1: guidelines for data acquisition and patient preparation. J Nucl Cardiol. 2003;10:543-556.
7 Di Carli MF, Hachamovitch R. New technology for noninvasive evaluation of coronary artery disease. Circulation. 2007;115:1464-1480.
8 Sampson UK, Dorbala S, Limaye A, et al. Diagnostic accuracy of rubidium-82 myocardial perfusion imaging with hybrid positron emission tomography/computed tomography in the detection of coronary artery disease. J Am Coll Cardiol. 2007;49:1052-1058.
9 Go RT, Marwick TH, MacIntyre WJ, et al. A prospective comparison of rubidium-82 PET and thallium-201 SPECT myocardial perfusion imaging utilizing a single dipyridamole stress in the diagnosis of coronary artery disease. J Nucl Med. 1990;31:1899-1905.
10 Stewart RE, Schwaiger M, Molina E, et al. Comparison of rubidium-82 positron emission tomography and thallium-201 SPECT imaging for detection of coronary artery disease. Am J Cardiol. 1991;67:1303-1310.
11 Bateman TM, Heller GV, McGhie AI, et al. Diagnostic accuracy of rest/stress ECG-gated Rb-82 myocardial perfusion PET: comparison with ECG-gated Tc-99m sestamibi SPECT. J Nucl Cardiol. 2006;13:24-33.
12 Dorbala S, Vangala D, Sampson U, et al. Value of vasodilator left ventricular ejection fraction reserve in evaluating the magnitude of myocardium at risk and the extent of angiographic coronary artery disease: a 82Rb PET/CT study. J Nucl Med. 2007;48:349-358.
13 Kuhle WG, Porenta G, Huang SC, et al. Quantification of regional myocardial blood flow using 13N-ammonia and reoriented dynamic positron emission tomographic imaging. Circulation. 1992;86:1004-1017.
14 Muzik O, Beanlands RS, Hutchins GD, et al. Validation of nitrogen-13-ammonia tracer kinetic model for quantification of myocardial blood flow using PET. J Nucl Med. 1993;34:83-91.
15 El Fakhri G, Sitek A, Guerin B, et al. Quantitative dynamic cardiac 82Rb PET using generalized factor and compartment analyses. J Nucl Med. 2005;46:1264-1271.
16 Lin JW, Sciacca RR, Chou RL, et al. Quantification of myocardial perfusion in human subjects using 82Rb and wavelet-based noise reduction. J Nucl Med. 2001;42:201-208.
17 Yoshinaga K, Chow BJ, Williams K, et al. What is the prognostic value of myocardial perfusion imaging using rubidium-82 positron emission tomography? J Am Coll Cardiol. 2006;48:1029-1039.
18 Dorbala S, Hachamovitch R, Kwong R, et al. Incremental prognostic value of rubidium-82 myocardial perfusion PET-CT imaging in patients with known or suspected CAD. J Am Coll Cardiol. 2007;49:109A.
19 Dorbala S, Hachamovitch R, Kwong R, et al. Incremental prognostic value of left ventricular ejection fraction assessment over myocardial perfusion imaging: a rubidium-82 PET/CT study. J Am Coll Cardiol. 2007;49:109A.
20 Schenker MP, Dorbala S, Hong ECT, et al. Relationship between coronary calcification, myocardial ischemia, and outcomes in patients with intermediate likelihood of coronary artery disease: a combined positron emission tomography/computed tomography study. Circulation. 2008;117:1693-1700.
21 Mahmarian JJ. Computed tomography coronary angiography as an anatomic basis for risk stratification: deja vu or something new? J Am Coll Cardiol. 2007;50:1171-1173.
22 Baker DW, Wright RF. Management of heart failure, IV: anticoagulation for patients with heart failure due to left ventricular systolic dysfunction. JAMA. 1994;272:1614-1618.
23 Braunwald E, Kloner RA. The stunned myocardium: prolonged, postischemic ventricular dysfunction. Circulation. 1982;66:1146-1149.
24 Rahimtoola SH. The hibernating myocardium. Am Heart J. 1989;117:211-221.
25 Opie LH. The Heart: Physiology and Metabolism, 2nd ed. New York: Raven Press; 1991.
26 Di Carli MF, Prcevski P, Singh TP, et al. Myocardial blood flow, function, and metabolism in repetitive stunning. J Nucl Med. 2000;41:1227-1234.
27 Nowak B, Sinha AM, Schaefer WM, et al. Cardiac resynchronization therapy homogenizes myocardial glucose metabolism and perfusion in dilated cardiomyopathy and left bundle branch block. J Am Coll Cardiol. 2003;41:1523-1528.
28 Di Carli MF. Predicting improved function after myocardial revascularization. Curr Opin Cardiol. 1998;13:415-424.
29 Allman KC, Shaw LJ, Hachamovitch R, et al. Myocardial viability testing and impact of revascularization on prognosis in patients with coronary artery disease and left ventricular dysfunction: a meta-analysis. J Am Coll Cardiol. 2002;39:1151-1158.
30 Beanlands RS, Nichol G, Huszti E, et al. F-18-fluorodeoxyglucose positron emission tomography imaging-assisted management of patients with severe left ventricular dysfunction and suspected coronary disease: a randomized, controlled trial (PARR-2). J Am Coll Cardiol. 2007;50:2002-2012.
31 Di Carli MF, Asgarzadie F, Schelbert HR, et al. Quantitative relation between myocardial viability and improvement in heart failure symptoms after revascularization in patients with ischemic cardiomyopathy. Circulation. 1995;92:3436-3444.
32 The Study of Myocardial Perfusion and Coronary Anatomy Imaging Roles in CAD (SPARC) Available at www.sparctrial.org
33 Bateman TM, Heller GV, McGhie AI, et al. Diagnostic accuracy of rest/stress ECG-gated Rb-82 myocardial perfusion PET: comparison with ECG-gated Tc-99m sestamibi SPECT. J Nucl Cardiol. 2006;13:24-33.
34 Marwick TH, Nemec JJ, Stewart WJ, et al. Diagnosis of coronary artery disease using exercise echocardiography and positron emission tomography: comparison and analysis of discrepant results. J Am Soc Echocardiogr. 1992;5:231-238.
35 Grover-McKay M, Ratib O, Schwaiger M, et al. Detection of coronary artery disease with positron emission tomography and rubidium 82. Am Heart J. 1992;123:646-652.
36 Demer LL, Gould KL, Goldstein RA, et al. Assessment of coronary artery disease severity by positron emission tomography: comparison with quantitative arteriography in 193 patients. Circulation. 1989;79:825-835.
37 Tamaki N, Yonekura Y, Senda M, et al. Value and limitation of stress thallium-201 single photon emission computed tomography: comparison with nitrogen-13 ammonia positron tomography. J Nucl Med. 1988;29:1181-1188.
38 Gould KL, Goldstein RA, Mullani NA, et al. Noninvasive assessment of coronary stenoses by myocardial perfusion imaging during pharmacologic coronary vasodilation. VIII. Clinical feasibility of positron cardiac imaging without a cyclotron using generator-produced rubidium-82. J Am Coll Cardiol. 1986;7:775-789.
39 Tillisch J, Brunken R, Marshall R, et al. Reversibility of cardiac wall-motion abnormalities predicted by positron tomography. N Engl J Med. 1986;314:884-888.
40 Tamaki N, Yonekura Y, Yamashita K, et al. Positron emission tomography using fluorine-18 deoxyglucose in evaluation of coronary artery bypass grafting. Am J Cardiol. 1989;64:860-865.
41 Tamaki N, Yonekura Y, Yamashita K, et al. Prediction of reversible ischemia after coronary artery bypass grafting by positron emission tomography. J Cardiol. 1991;21:193-201.
42 Carrel T, Jenni R, Haubold-Reuter S, et al. Improvement in severely reduced left ventricular function after surgical revascularization in patients with preoperative myocardial infarction. Eur J Cardiothorac Surg. 1992;6:479-484.
43 Lucignani G, Paolini G, Landoni C, et al. Presurgical identification of hibernating myocardium by combined use of technetium-99m hexakis 2-methoxyisobutylisonitrile single photon emission tomography and fluorine-18 fluoro-2-deoxy-D-glucose positron emission tomography in patients with coronary artery disease. Eur J Nucl Med. 1992;19:874-881.
44 Gropler RJ, Geltman EM, Sampathkumaran K, et al. Functional recovery after coronary revascularization for chronic coronary artery disease is dependent on maintenance of oxidative metabolism. J Am Coll Cardiol. 1992;20:569-577.
45 Marwick TH, MacIntyre WJ, Lafont A, et al. Metabolic responses of hibernating and infarcted myocardium to revascularization: a follow-up study of regional perfusion, function, and metabolism. Circulation. 1992;85:1347-1353.
46 Gropler RJ, Geltman EM, Sampathkumaran K, et al. Comparison of carbon-11-acetate with fluorine-18-fluorodeoxyglucose for delineating viable myocardium by positron emission tomography. J Am Coll Cardiol. 1993;22:1587-1597.
47 Vanoverschelde JL, Wijns W, Depre C, et al. Mechanisms of chronic regional postischemic dysfunction in humans: new insights from the study of noninfarcted collateral-dependent myocardium. Circulation. 1993;87:1513-1523.
48 vom Dahl J, Eitzman DT, al-Aouar ZR, et al. Relation of regional function, perfusion, and metabolism in patients with advanced coronary artery disease undergoing surgical revascularization. Circulation. 1994;90:2356-2366.
49 Knuuti MJ, Saraste M, Nuutila P, et al. Myocardial viability: fluorine-18-deoxyglucose positron emission tomography in prediction of wall motion recovery after revascularization. Am Heart J. 1994;127(4 Pt 1):785-796.
50 Maes AF, Borgers M, Flameng W, et al. Assessment of myocardial viability in chronic coronary artery disease using technetium-99m sestamibi SPECT: correlation with histologic and positron emission tomographic studies and functional follow-up. J Am Coll Cardiol. 1997;29:62-68.
51 Grandin C, Wijns W, Melin JA, et al. Delineation of myocardial viability with PET. J Nucl Med. 1995;36:1543-1552.
52 Tamaki N, Kawamoto M, Tadamura E, et al. Prediction of reversible ischemia after revascularization: perfusion and metabolic studies with positron emission tomography. Circulation. 1995;91:1697-1705.
53 Baer FM, Voth E, Deutsch HJ, et al. Predictive value of low dose dobutamine transesophageal echocardiography and fluorine-18 fluorodeoxyglucose positron emission tomography for recovery of regional left ventricular function after successful revascularization. J Am Coll Cardiol. 1996;28:60-69.
54 vom Dahl J, Altehoefer C, Sheehan FH, et al. Recovery of regional left ventricular dysfunction after coronary revascularization: impact of myocardial viability assessed by nuclear imaging and vessel patency at follow-up angiography. J Am Coll Cardiol. 1996;28:948-958.
55 Wolpers HG, Burchert W, van den Hoff J, et al. Assessment of myocardial viability by use of 11C-acetate and positron emission tomography: threshold criteria of reversible dysfunction. Circulation. 1997;95:1417-1424.
56 Schwarz ER, Schaper J, vom Dahl J, et al. Myocyte degeneration and cell death in hibernating human myocardium. J Am Coll Cardiol. 1996;27:1577-1585.
57 vom Dahl J, Altehoefer C, Sheehan FH, et al. Effect of myocardial viability assessed by technetium-99m-sestamibi SPECT and fluorine-18-FDG PET on clinical outcome in coronary artery disease. J Nucl Med. 1997;38:742-748.
58 Eitzman D, al-Aouar Z, Kanter HL, et al. Clinical outcome of patients with advanced coronary artery disease after viability studies with positron emission tomography. J Am Coll Cardiol. 1992;20:559-565.
59 Di Carli M, Davidson M, Little R, et al. Value of metabolic imaging with positron emission tomography for evaluating prognosis in patients with coronary artery disease and left ventricular dysfunction. Am J Cardiol. 1994;73:527-533.
60 Lee KS, Marwick TH, Cook SA, et al. Prognosis of patients with left ventricular dysfunction, with and without viable myocardium after myocardial infarction: relative efficacy of medical therapy and revascularization. Circulation. 1994;90:2687-2694.
61 Rohatgi R, Epstein S, Henriquez J, et al. Utility of positron emission tomography in predicting cardiac events and survival in patients with coronary artery disease and severe left ventricular dysfunction. Am J Cardiol. 2001;87:1096-1099.
