CHAPTER 16 Clinical Techniques of Cardiac Magnetic Resonance Imaging
Functional Interpretation and Image Processing
Accurate assessments of global and regional left and right ventricular (LV and RV) function are important when managing patients with cardiovascular disease. Magnetic resonance imaging (MRI) has been developed to characterize cardiac function, yielding high-quality images in patients, regardless of body habitus. Using fast imaging protocols with high temporal resolution, MRI allows one to identify resting and stress-induced changes in LV wall motion to predict the contractile reserve in patients with ischemic heart disease, detect improvement in regional LV performance after coronary artery revascularization1 or transmyocardial placement of stem cells,2 and visualize evidence of ethanol ablation of the myocardium in patients with hypertrophic obstructive cardiomyopathy.3 With MRI, RV function can be defined in those with congenital heart disease,4 arrhythmogenic right ventricular dysplasia (ARVD), and primary pulmonary hypertension.5 The purpose of this chapter is to describe the various MRI techniques used to assess LV and RV function.
IMAGE ACQUISITION TECHNIQUES
“White blood” imaging with fast field gradient-echo, or steady-state free precession (SSFP), sequences provides the basis whereby cine images of LV and RV mass, volume, and ejection fraction (EF) are determined with MRI.6 By grouping the phase encodes and coordinating image acquisition with the rhythmic contraction of the heart, crisp, clear images of cardiac contraction can be obtained in 2 to 4 seconds.
Steady-State Free Precession
Limitation
This technique underestimates turbulent flow associated with intracardiac shunts or valvular heart disease (Table 16-1).

Description
SSFP imaging exhibits high signal-to-noise ratio (SNR) and high contrast-to-noise ratio (CNR) with the blood-myocardial interface. With SSFP, cine MR images depict the endocardial surface, regardless of blood flow velocity.7,8 This technique can be used with brief repetition times repetition times (TR) (<3 ms), leading to short scan times with high temporal resolution. Studies comparing FLASH and SSFP imaging have demonstrated significant improvements with SSFP in the blood-myocardial interface in patients with decreased LV ejection fraction.9 With short echo times of less than 1.5 ms, the blood pool within the cavity appears more uniform and image quality is not hampered by turbulent flow.
Echo-Planar Imaging
Limitation
Because of low spatial and temporal resolution, this technique is not well suited for precise determination of volumes and EF.10
Sensitivity Encoding Parallel Imaging
Indication
The sensitivity-encoding (SENSE) technique obtains images during short periods of breath-holding.
Description
This technique uses sensitivity information from multiple coil elements to correct for k-space undersampling in the post-Fourier domain. Each coil has a different sensitivity profile so that undersampled acquisitions may be unfolded that result in decreased scan time. Images produced with the SENSE technique exhibit consistent contrast, with preserved spatial resolution (see Table 16-1).
TECHNIQUE FOR ASSESSING QUANTITATIVE ANALYSIS OF MYOCARDIAL MOTION
Tagged Imaging
Limitation
With this technique, it is difficult to measure LV function along the LV epicardial and endocardial surfaces.11
Description
Myocardial motion can be tracked in one, two, or three dimensions using tissue tagging.12,13 With tagging, dark saturation bands, or “markers,” are placed across the myocardium for the purpose of quantifying LV function. These markers are induced by prepulse sequences applied immediately after the R wave, usually in planes perpendicular to the imaging plane. Quantification of intramyocardial deformations can be accomplished by tracking the intersection points of the tagging lines to demonstrate myocardial rotation, contraction, relaxation, and strain (Fig. 16-1). The SPAMM (spatial modulation of magnetization) technique,14 uses two perpendicular sets of parallel lines that form a rectangular grid on the image that can be tracked throughout the cardiac cycle. These tagging lines move with the myocardium during the contraction and relaxation phases of the cardiac cycle (see Fig. 16-1).
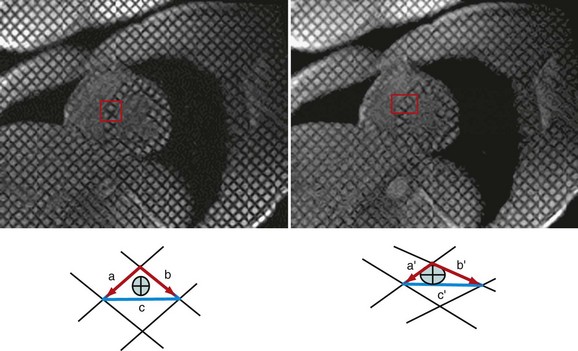
 FIGURE 16-1
As soon as the images are acquired, there are three methods for extraction of motion data from tagged images: (1) tracking the dark tag lines as intensity minima; (2) eusing optical flow analysis; or (3) applying harmonic phase (HARP) determinates. All three of the tracking methods (Table 16-2) are highly accurate for assessing midwall myocardial function but exhibit some difficulty for discriminating tag intersection points near the epicardial and endocardial surfaces.11
TABLE 16-2 Technique for Assessing Quantitative Analysis of Myocardial Motion
| Technique | Advantage | Limitations |
|---|---|---|
| Tagged imaging | Provides the data suited for strain assessment. |
DENSE, displacement encoding with stimulated echoes technique; LV = left ventricle; TDI, tissue Doppler imaging.
Phase-Contrast Velocity Mapping
Description
The change in the phase of the net magnetization inside each pixel is proportional to the velocity of the tissue during systole and diastole. Studies by Markl, Kvitting, and colleagues15,16 have demonstrated the utility of this technique for tracking LV displacement in a manner similar to that performed with tissue Doppler imaging (TDI) during transthoracic echocardiography. Paelinck and associates17 have compared TDI with phase contrast MRI when studying diastolic function in patients with hypertensive heart disease and found a good agreement between MRI and TDI. Westenberg and coworkers18 compared TDI with phase contrast MRI in patients with conduction delay and idiopathic dilated cardiomyopathy and found that MRI was able to classify them as having minimal, intermediate, or extensive disease.
Displacement Encoding with Stimulated Echoes
Indication
Displacement encoding with stimulated echoes (DENSE) is useful for quantifying myocardial motion.
Description
The DENSE technique was developed in an attempt to combine the advantages of the tagging and cine phase contrast velocity imaging techniques. The DENSE technique provides three-dimensional displacement vectors of each pixel at one point in time and then tracks tissue displacement throughout the cardiac cycle.19 With DENSE, regional LV myocardial function data across the entire LV myocardium, endocardium, midwall, and epicardium can be obtained (see Table 16-2).
IMAGE INTERPRETATION
Left Ventricular Volume and Function
Global Left Ventricular Function
Area-Length Method
The area-length technique is based on formulas that assume that the left ventricle exhibits the shape of a simple prolate ellipsoid.20 LV end-diastolic and end-systolic volumes are calculated from the corresponding tracings at both these points of the cardiac cycle. The single-plane ellipsoid method uses the length (L) and two-dimensional area (A) in a single apical long-axis view (usually apical four-chamber view).21

(where EDV is the end-diastolic volume and ESV is the end-systolic volume)
This technique may be imprecise when patients exhibit distorted LV geometry caused by LV dilation or resting regional wall motion abnormalities.22
Multislice Simpson’s Rule Method
Quantification of global function using multiple cine MRI provides measurements of volumes, EF, and mass that do not depend on assumed LV geometry. Using Simpson’s rule, stacked disks are assessed and the end-diastolic and end-systolic volumes are calculated by summing the volume of the blood pool in each slice. This method is highly accurate and reproducible, and has been validated in ex vivo and in vivo models. Figure 16-2 illustrates the method for obtaining standard views and Figure 16-3 shows some standard multislice and LV volume and mass calculations.
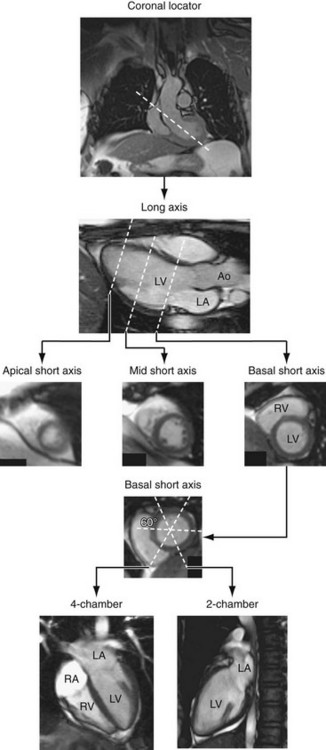
 FIGURE 16-2
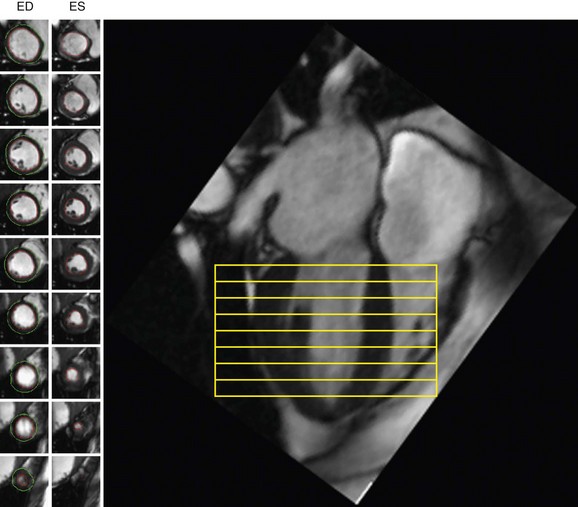
 FIGURE 16-3


Comparison of Left Ventricular Volume Measurements Between SSFP and FLASH
Previous studies at 1.5 T compared FLASH and SSFP techniques for the quantitation of ventricular volumes, mass, and EF. Consistently, SSFP imaging provides larger volume and smaller LV mass determinations with a negligible effect on LVEF. The reason for these volume and mass discrepancies relates to the higher blood-myocardial contrast and higher myocardial SNR in SSFP images. During SSFP imaging, this results in improved definition of the endocardial border without flow artifacts from the LV cavity (see Table 16-1). Of note, these differences at 1.5 T may be present when individuals are scanned at 3.0 T.23
Left Ventricular Mass
Typically, LV mass is measured at end-diastole from multiple short-axis images. The epicardial and endocardial borders are traced in each slice, and papillary muscles and endocardial trabeculae may or may not be included in the LV mass calculation. Left ventricular mass is reported in grams and is calculated by multiplying the volume of the LV myocardium by the specific gravity of the myocardial tissue, 1.05 g/dL. The accuracy of LV mass has been established in autopsy studies of the heart and from studies in live human and animal subjects (see Fig. 16-3).
Regional Left Ventricular Function
Systolic Left Ventricular Function
Qualitative (Wall Motion)
With MRI, regional LV contractile function can be assessed qualitatively by visual inspection. Normally, LV free wall thickness increases more than 40% during systole. Regional hypokinesia is defined as systolic wall thickening less than 30%, akinesia is defined as systolic wall thickening less than 10%, and dyskinesia is defined as systolic outward movement or diastolic bulging of the ventricular wall.24
Left ventricular wall motion is also visualized in orthogonal planes oriented parallel to the long axis of the heart. A combination of three short-axis cines spanning from the base to the apex are routinely acquired (Table 16-3) and apical planes are also acquired. These include the vertical long-axis (VLA) view, or four-chamber view, the horizontal long-axis (HLA) view, or two-chamber view, and the long axis or three-chamber view (Fig. 16-4; also see Fig. 16-2).24
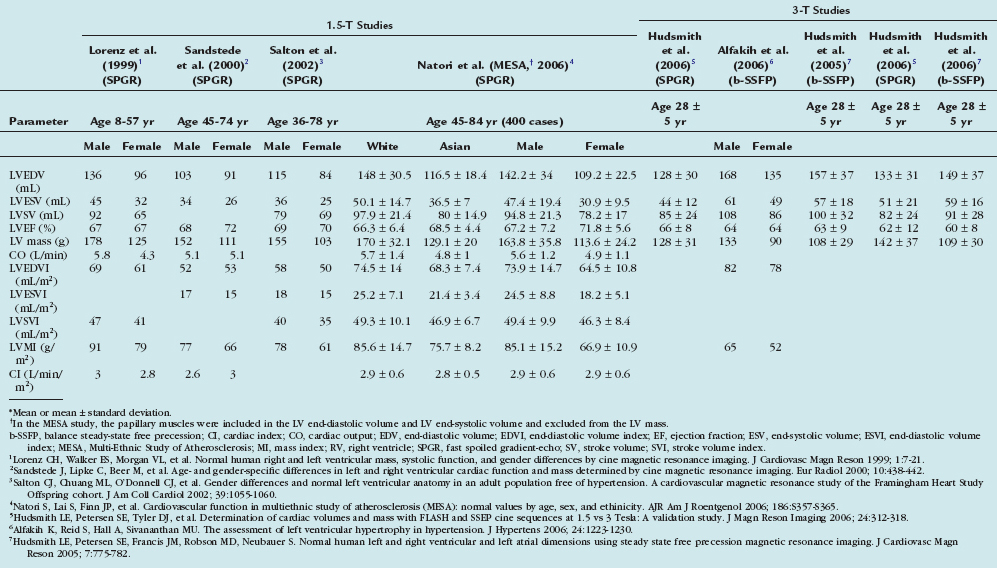
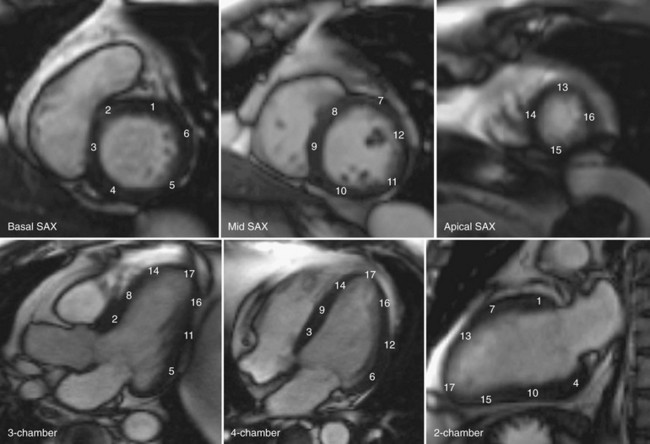
 FIGURE 16-4
Quantitative (Wall Thickening)
Left Ventricular Strain
Left ventricular strain measurements reflect the direction and spatial variation of LV myocardial displacement without dependence on LV preload.25,26 The LV myocardium has a complex architecture—subepicardial and subendocardial fibers are longitudinal, whereas mid-wall fibers are circumferential in direction. LV deformation is therefore composed of radial thickening, circumferential shortening and torsion, and longitudinal shortening. There are two coordinate systems in three orthogonal directions that are used to determine principle strains; radial strain is the myocardial deformation in the radial direction (R), longitudinal strain (L) is myocardial shortening from base to apex (negative value), and circumferential strain is the intramural circumferential shortening (C).27 Shear strains represent the changes in angles between coordinate axes (Fig. 16-5).28
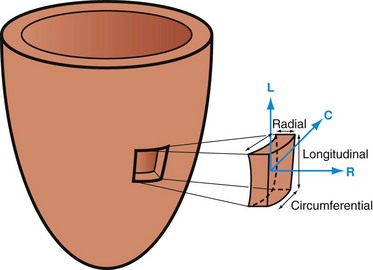
 FIGURE 16-5
The circumferential-longitudinal shear angle describes the twisting motion of the heart and is closely related to torsion of the left ventricle. The twisting motion of the left ventricle stores potential elastic energy by straining the extracellular matrix, which is released during early diastole, and therefore contributes to early diastolic suction.29 The contraction and relaxation of the spiraling myofibers cause the LV torsion and untwisting. Torsion is defined as the circumferential-longitudinal shear on the epicardial surface between two short-axis slices. The net ventricular torsion is the result of the subepicardial contraction and subendocardial counterbalancing contraction.29 Both tagged imaging and DENSE techniques are well suited for tissue tracking for strain assessment. Several studies have reported the use of myocardial strain assessments to evaluate regional systolic and diastolic LV function in patients with myocardial ischemia, infarction, and postinfarction remodeling.29,30
Diastolic Left Ventricular Function and Regional Relaxation
Parameters of diastolic function are determined from rates of inflow into the left ventricle or from the outward relaxation of the myocardium. Phase contrast velocity mapping can be used to quantify ventricular inflow in real time. This information is useful for evaluating the impact of respiratory motion on ventricular filling to demonstrate constrictive physiology (e.g., in constrictive pericarditis). Using the transmitral velocity to measure the mitral inflow pattern can also demonstrate LV filling patterns similar to these obtained with Doppler echocardiographic techniques (Fig. 16-6).
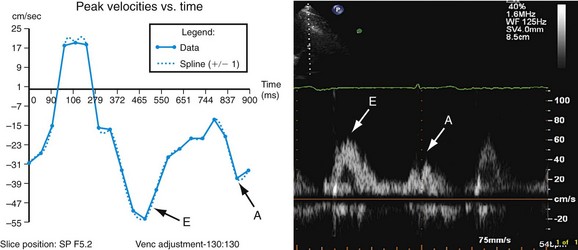
 FIGURE 16-6
The assessment of outward movement of the LV myocardium can be acquired with tissue tagging techniques. By using myocardial tagging to evaluate the diastolic parameters, reverse myocardial strain and shear strain can be assessed at rest or during high-dose dobutamine stress to identify patients with flow-limiting epicardial coronary artery luminal narrowings.31
Right Ventricular Volume and Function
Global Right Ventricular Function
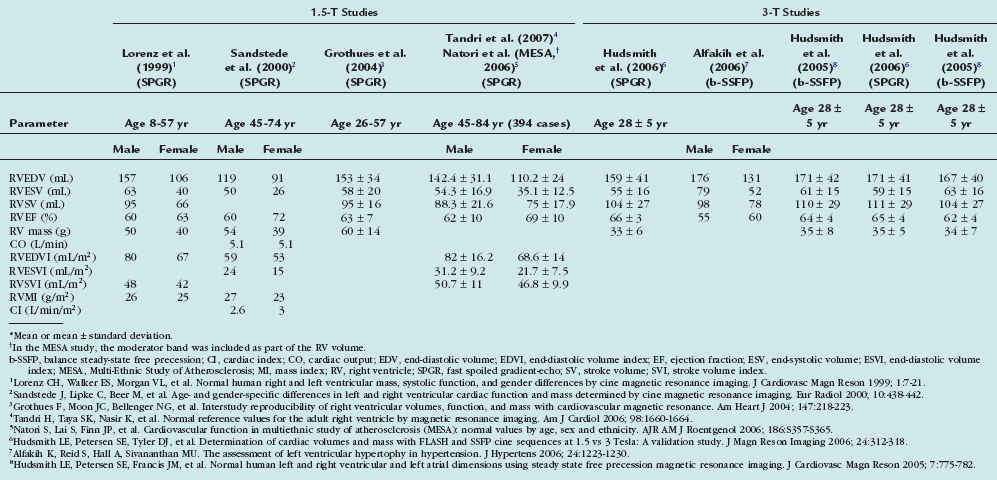
Cardiac MRI demonstrates high interstudy reproducibility for determining RV function (volumes and EF) in healthy subjects, patients with heart failure, and patients with hypertrophy.32 The intraobserver, interobserver, and interstudy variability was demonstrated to be 5% to 6% in normal volunteers.33 Cardiac MRI has been used to follow patients with repaired tetralogy of Fallot. Davlouros and colleagues34 have demonstrated pulmonary regurgitation and RV outflow tract aneurysm associated with RV dilation and a decrement in RV ejection fraction in patients after tetralogy of Fallot repair. Similar to the left ventricle, Simpson’s rule method is used to calculate RV volume and EF. Table 16-4 summarizes normal measures of RV function from various studies.
Regional Right Ventricular Function
There is no standard convention for segmenting the RV myocardium to determine regional RV function. In short-axis views, the RV free wall can be divided into four regions—the inflow tract, outflow tract, midventricular region, and apex. Arrhythmogenic right ventricular cardiomyopathy (ARVC) is a clinically important syndrome with regional RV motion abnormalities (akinesis or dyskinesis) on cine MRI that correspond to areas of adipose tissue replacement.35 As shown in Figure 16-7, MRI is useful for identifying this condition.
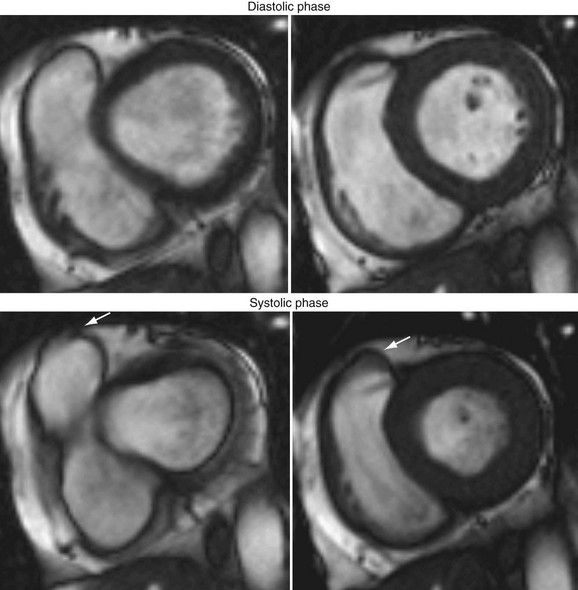
 FIGURE 16-7
Although most myocardial tagging studies have been performed on the left ventricle, tagging of the right ventricle can be used to study RV myocardial deformation in patients with congenital heart diseases such as postoperative atrial switch procedures for transposition of the great arteries.35 Complex RV geometry and the presence of a thin RV wall (normal < 6 mm) result in muscle tagging analyses being technically more demanding relative to the thicker walled left ventricle.
Right Ventricular Diastolic Function
Tricuspid transvalvular flow profiles may be used to assess RV diastolic filling patterns (E and A waves). Diastolic dysfunction within the walls of the right ventricle have been demonstrated using phase contrast velocity mapping in patients with hypertrophic cardiomyopathy.25


Petitjean C, Rougon N, Cluzel P. Assessment of myocardial function: a review of quantification methods and results using tagged MRI. J Cardiovasc Magn Reson. 2004;7:501-516.
Walsh TF, Hundley WG. Assessment of ventricular function with cardiovascular magnetic resonanace. Cardiol Clin. 2007;25:15-33.
1 Gerber BL, Garot J, Bluemke DA, et al. Accuracy of contrast-enhanced magnetic resonance imaging in predicting improvement of regional myocardial function in patients after acute myocardial infarction. Circulation. 2002;106:1083-1089.
2 Mathur A, Martin JF. Stem cells and repair of the heart. Lancet. 2004;364:183-192.
3 Sigwart U. Non-surgical myocardial reduction for hypertrophic obstructive cardiomyopathy. Lancet. 1995;346:211-214.
4 Reddy GP, Higgins CB. Magnetic resonance imaging of congenital heart disease: evaluation of morphology and function. Semin Roentgenol. 2003;38:342-351.
5 Van Wolferen SA, Marcus JT, Boonstra A, et al. Prognostic value of right ventricular mass, volume, and function in idiopathic pulmonary arterial hypertension. Eur Heart J. 2007;28:1250-1257.
6 Grothues F, Smith GC, Moon JC, et al. Comparison of interstudy reproducibility of cardiovascular magnetic resonance with two-dimension echocardiography in normal subjects and in patients with heart failure or left ventricular hypertrophy. Am J Cardiol. 2002;90:29-34.
7 Moon JC, Lorenz CH, Francis JM, et al. Breath-hold FLASH and FISP cardiovascular MR imaging: left ventricular volume differences and reproducibility. Radiology. 2002;223:789-797.
8 Ichikawa Y, Sakuma H, Kitagawa K, et al. Evaluation of left ventricular volumes and ejection fraction using fast steady-state cine MR imaging: comparison with left ventricular angiography. J Cardiovasc Magn Reson. 2003;5:333-342.
9 Shors SM, Cotts WG, Pavlovic-Surjancev, et al. Non-invasive cardiac evaluation in heart failure patients using magnetic resonance imaging: a feasibility study. Heart Fail Rev. 2005;10:265-273.
10 Poustchi-Amin M, Mirowitz SA, Brown JJ, et al. Principles and application of echo-planar imaging: a review for the general radiologist. Radiographics. 2001;21:767-779.
11 Axel L, Montillo A, Kim D. Tagged magnetic resonance imaging of the heart: a survey. Med Image Anal. 2005;9:376-393.
12 Young AA, Axel L. Three-dimensional motion and deformation of the heart wall: estimation with spatial modulation of magnetization—a model-based approach. Radiology. 1992;185:241-247.
13 Ryf S, Spiegel MA, Gerber M, Boesiger P. Myocardial tagging with 3D-CSPAMM. J Magn Reson Imaging. 2002;16:320-325.
14 Axel L, Dougherty L. MR imaging of motion with spatial modulation of magnetization. Radiology. 1989;171:841-845.
15 Markl M, Schneider B, Hennig J, et al. Cardiac phase contrast gradient echo MRI: measurement of myocardial wall motion in healthy volunteers and patients. Int J Cardiol Imaging. 1999;15:441-452.
16 Kvitting JP, Ebbers T, Engvall J, et al. Three-directional myocardial motion assessed using 3D phase contrast MRI. J Cardiovasc Magn Reson. 2004;6:627-636.
17 Paelinck BP, de Roos A, Bax JJ, et al. Feasibility of tissue magnetic resonance imaging: a pilot study in comparison with tissue Doppler imaging and invasive measurement. J Am Coll Cardiol. 2005;45:1109-1116.
18 Westenberg JJ, Lamb HJ, van der Geest RJ, et al. Assessment of left ventricular dyssynchrony in patients with conduction delay and idiopathic dilated cardiomyopathy: head-to-head comparison between tissue Doppler imaging and velocity-encoded magnetic resonance imaging. J Am Coll Cardiol. 2006;47:2042-2048.
19 Rademakers FE, Rogers WJ, Guier WH, et al. Relation of regional cross-fiber shortening to wall thickening in the intact heart. Three-dimensional strain analysis by NMR tagging. Circulation. 1994;89:1174-1182.
20 Van Rossum AC, Visser FC, Sprenger M, et al. Evaluation of magnetic resonance imaging for determination of left ventricular ejection fraction and comparison with angiography. Am J Cardiol. 1988;62:628-633.
21 Cranney GB, Lotan CS, Dean L, et al. Left ventricular volume measurement using cardiac axis nuclear magnetic resonance imaging. Validation by calibrated ventricular angiography. Circulation. 1990;82:154-163.
22 Martin ET, Fuisz AR, Pohost GM. Imaging cardiac structure and pump function. Cardiol Clin. 1998;16:135-160.
23 Hudsmith LE, Petersen SE, Tyler DJ, et al. Determination of cardiac volumes and mass with FLASH and SSFP cine sequences at 1.5 vs 3 Tesla: A validation study. J Magn Reson Imaging. 2006;24:312-318.
24 Cerqueira MD, Weissman NJ, Dilsizian V, et al. American Heart Association Writing Group on Myocardial Segmentation and Registration for Cardiac Imaging. Standardized myocardial segmentation and nomenclature for tomographic imaging of the heart: a statement for healthcare professionals from the Cardiac Imaging Committee of the Council on Clinical Cardiology of the American Heart Association. Circulation. 2002;105:539-542.
25 Dong SJ., Hees PS, Huang WM, et al. Independent effects of preload, afterload, and contractility on left ventricular torsion. Am J Physiol. 1999;277:H1053-H1060.
26 Dong SJ, Hees PS, Siu CO, et al. MRI assessment of LV relaxation by untwisting rate: a new isovolumetric phase measure of t. Am J Physiol. 2001;281:H2002-H2009.
27 Göttte Marco JW, Germans T, et al. Myocardial strain and torsion quantified by cardiovascular magnetic resonance tissue tagging: studies in normal and impaired left ventricular function. J Am coll Cardiol. 2006;48:2002-2011.
28 Reichek N. MRI myocardial tagging. J Magn Reson Imaging. 1999;10:609-616.
29 Bogaert J, Bosmans H, Maes A, et al. Remote myocardial dysfunction after anterior myocardial infarction: impact on left ventricular shape on regional function: a magnetic resonance myocardial tagging study. J Am Coll Cardiol. 2000;35:1525-1534.
30 Marcus JT, Gotte MJ, Van Rossum AC, et al. Myocardial function in infracted and remote regions early after infarction in man assessment by magnetic resonance tagging and strain analysis. J Magn Reson Imaging. 1997;38:803-810.
31 Paetsch I, Foll D, Kaluza A, et al. Magnetic resonance stress tagging in ischemic heart disease. Am. Physiol Heart Circ Physiol. 2005;288:H2708-H2714.
32 Grothues F, Moon JC, Bellenger NG, et al. Interstudy reproducibility of right ventricular volumes, function, and mass with cardiovascular magnetic resonance. Am Heart J. 2004;147:218-223.
33 Lorenz CH, Walker ES, Morgan VL, et al. Normal human right and left ventricular mass, systolic function, and gender differences by cine magnetic resonance imaging. J Cardiovasc Magn Reson. 1999;1:7-21.
34 Davlouros PA, Kilner PJ, Hornung TS, et al. Right ventricular function in adults with repaired tetralogy of Fallot assessed with cardiovascular magnetic resonance imaging: determental role of right ventricular outflow aneurysm or akinesia and adverse right to left ventricular interaction. J Am Coll Cardiol. 2002;40:2044-2052.
35 Pettersen E, Helle-Valle T, Edvardsen T, et al. Contraction pattern of the systemic right ventricle shift from longitudinal to circumferential shortening and absent global ventricular torsion. J Am Coll Cardiol. 2007;49:2450-2456. 2007
