Chapter 32A Clinical Neurophysiology
Electroencephalography and Evoked Potentials
Electroencephalography
Physiological Principles of Electroencephalography
EEG rhythms appear to be part of a complex hierarchy of cortical oscillations that are fundamental to the brain’s information processing mechanisms, including input selection and transient “binding” of distributed neuronal assemblies (Buzsaki and Draguhn, 2004). In addition to reflecting the spontaneous intrinsic activities of cortical neurons, the EEG depends on important afferent inputs from subcortical structures including the thalamus and brainstem reticular formation. Thalamic afferents, for example, probably are responsible for entraining cortical neurons to produce the rhythmic oscillations that characterize normal patterns like alpha rhythm and sleep spindles. An EEG abnormality may occur directly from disruption of cortical neural networks or indirectly from modification of subcortical inputs onto cortical neurons.
A scalp-recorded EEG represents only a limited, low-resolution view of the electrical activity of the brain. This is due in part to the pronounced voltage attenuation and “blurring” that occurs from overlying cerebrospinal fluid (CSF) and tissue layers. Relatively large areas of cortex have to be involved in similar synchronized activity for a discharge to appear on the EEG. For example, recordings obtained from arrays of microelectrodes penetrating into the cerebral cortex reveal a complex architecture of seizure initiation and propagation invisible to recordings from the scalp or even the cortical surface, with seizure-like discharges occurring in areas as small as a single cortical column (Schevon et al., 2008). Furthermore, potentials involving surfaces of gyri are more readily recorded than potentials arising in the walls and depths of sulci. Activity generated over the lateral convexities of the hemispheres records more accurately than does activity coming from interhemispherical, mesial, or basal areas. In the case of epileptiform activity, estimates are that 20% to 70% of cortical spikes do not appear on the EEG, depending on the region of cortex involved. Additionally, although the scalp-recorded EEG consists almost entirely of signals slower than approximately 40 Hz, intracranial oscillations of several hundred hertz may be recorded and, of clinical importance, have been associated with both normal physiological processes and seizure initiation (Schevon et al., 2009).
Normal Electroencephalographic Activities
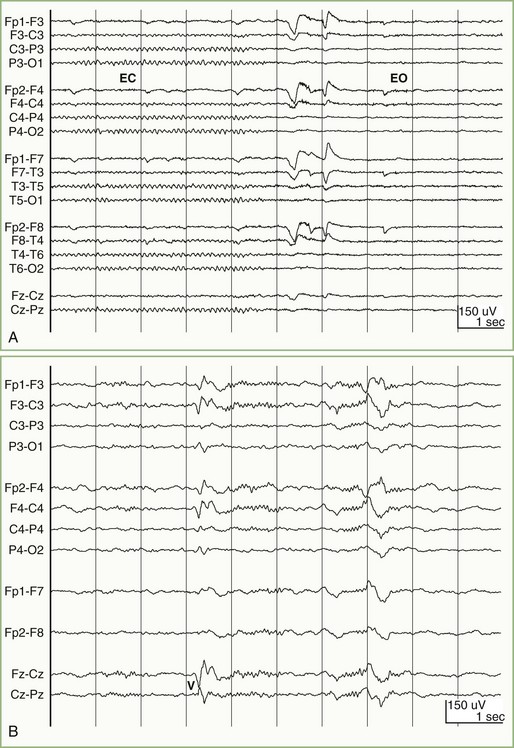
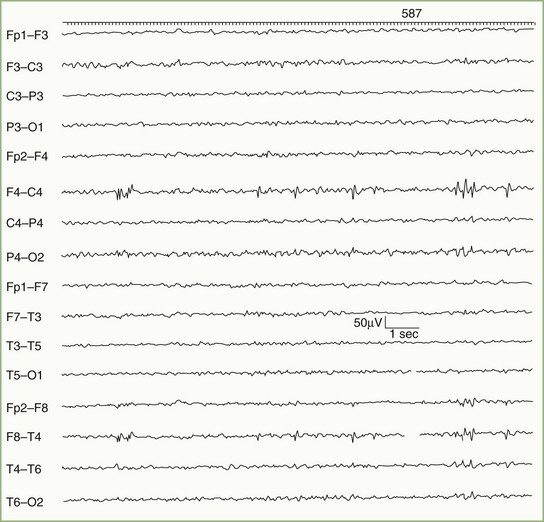
In most normal adults, the waking pattern of EEG activity consists mainly of sinusoidal oscillations occurring at 8 to 12 Hz, which are most prominent over the occipital area—the alpha rhythm (Fig. 32A.1, A). Eye opening, mental activity, and drowsiness attenuate (block) the alpha rhythm. Activity faster than 12 Hz beta activity normally is present over the frontal areas and may be especially prominent in patients receiving barbiturate or benzodiazepine drugs. Activity slower than 8 Hz is divisible into delta activity (1 to 3 Hz) and theta activity (4 to 7 Hz). Adults normally may show a small amount of theta activity over the temporal regions; the percentage of intermixed theta frequencies increases after the age of 60 years. Delta activity is not present normally in adults when they are awake but appears when they fall asleep (see Fig. 32A.1, B). The amount and amplitude of slow activity (theta and delta) correlate closely with the depth of sleep. Slow frequencies are abundant in the EEGs of newborns and young children, but these disappear progressively with maturation.
Common Types of Electroencephalographic Abnormalities
Recording Techniques
The EEG recording methods in common use are summarized in the following discussion. Details can be found in the American Clinical Neurophysiology Society’s Guidelines (2006).
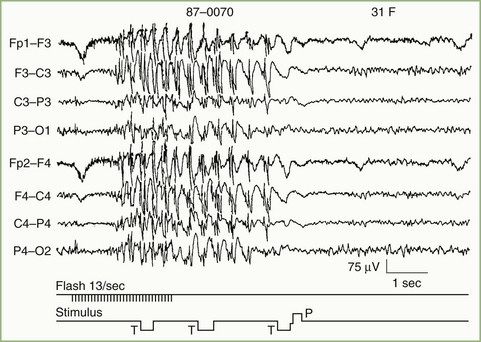
A typical study is about 30 to 45 minutes in duration and includes two types of “activating procedures”: hyperventilation and photic stimulation. In some patients, these techniques provoke abnormal focal or generalized alterations in activity that are of diagnostic importance and would otherwise go undetected (Fig. 32A.2). Recording during sleep and after sleep deprivation, and placement of additional electrodes at other recording sites are useful in detecting specific kinds of epileptiform potentials. The use of other maneuvers depends on the clinical question posed. For example, epileptiform activity may occasionally activate only by movement or specific sensory stimuli. Vasovagal stimulation may be important in some types of syncope.
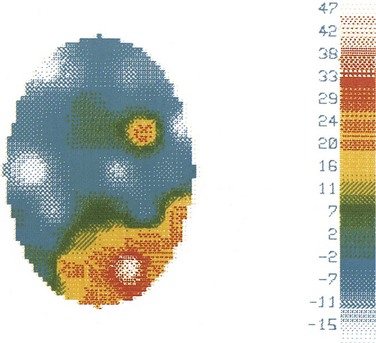
In the past, EEG recording instruments were simple analog devices with banks of amplifiers and pen-writers. In contrast, modern EEG machines make use of digital processing and storage, and the electroencephalographer interprets the EEG from a computer display rather than from paper. Technological advances have not fundamentally changed the principles of EEG interpretation, but they have facilitated EEG reading. Early paper-based EEG systems required that all recording parameters—display gain, filter settings, and the manner in which scalp-recorded signals were combined and displayed (montages)—be fixed by the technologist at the time of recording. In contrast, digital EEG systems permit the electroencephalographer to adjust these settings at the time of interpretation. A given EEG waveform or pattern can be examined using a number of different instrument settings, including sophisticated montages (e.g., Laplacian montages), that were unavailable using traditional analog recording systems. Topographic maps can be useful to depict spatial relationships, displaying features of the EEG in a graphical manner similar to that for functional MRI (fMRI) or PET. For example, topographical maps can illustrate EEG voltage distributions over the scalp at a particular point in time (Fig. 32A.3) as well as the distributions of particular frequencies contained within the EEG. Although this flexibility does not change the interpretive strategies used to read an EEG, it does allow the electroencephalographer to apply them more effectively.
In addition to facilitating the standard interpretation of EEGs, mathematical techniques can also be used to reveal features that may not be apparent to visual inspection of raw EEG waveforms. For example, averaging techniques, useful in improving the signal-to-noise ratios of spikes and sharp waves, can reveal field distributions and timing relationships that are not otherwise appreciable. Dipole source localization methods have been used to characterize both interictal spikes and ictal discharges in patients with epilepsy and may contribute to localization of the seizure focus (Ebersole, 2000). Such methods are based on a number of critical assumptions that, if applied without recognition of their limitations, can result in anatomically and physiologically erroneous conclusions (Emerson et al., 1995), so caution is warranted in their use.
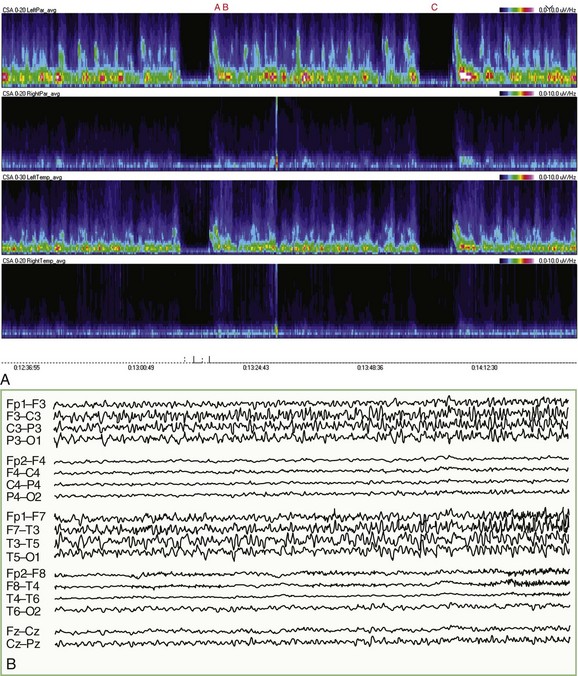
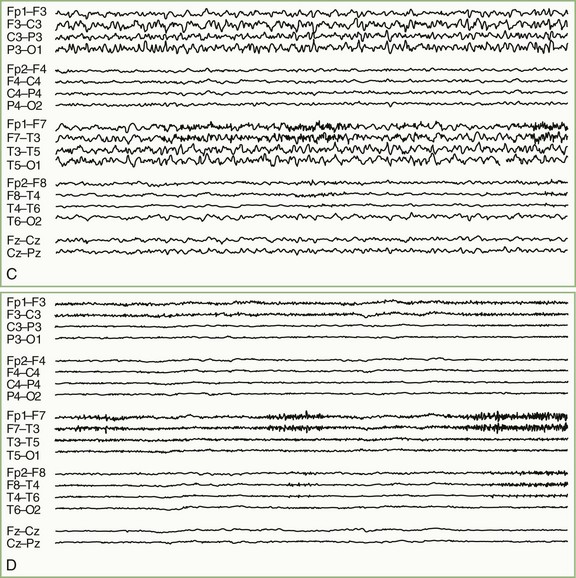
For patients undergoing long-term EEG recordings as part of the diagnosis or management of epilepsy, a time-locked digitally recorded video image of the patient is recorded simultaneously with the EEG. EEG data are often processed by software that can automatically detect most seizure activity. Similar systems are finding increased use in intensive care units (ICU), where EEG monitoring has become increasingly important in the management of patients with nonconvulsive seizure activity, threatened or impending cerebral ischemia, severe head trauma, and metabolic coma (Drislane et al., 2008; Friedman et al., 2009). In this setting, compressed spectrograms, which graphically summarize the frequencies present in several hours of EEG on a single screen, can help the electroencephalographer to rapidly pinpoint important changes in the EEG and sometimes spot patterns or trends that otherwise might go unnoticed (Fig. 32A.4) (Scheuer, 2002). It is important to emphasize that fully automated robust systems analogous to those employed for cardiac monitoring are not now available for EEG, and while various automated methods can be very useful, their proper use in clinical practice should be as adjuncts to standard EEG recording and interpretation. False positives and negatives are commonplace; indeed, the very data reduction that makes such methods useful also makes them unsuitable for stand-alone application.
Clinical Uses of Electroencephalography
Epilepsy
Nonetheless, interpretation of interictal findings always requires caution. Correlating most epileptiform discharges with the frequency and likelihood of recurrence of epileptic seizures is poor (Selvitelli et al., 2010). Furthermore, a substantial number of patients with unquestionable epilepsy have consistently normal interictal EEGs. The most convincing proof that a patient’s episodic symptoms are epileptic is obtained by recording an electrographical seizure discharge during a typical behavioral attack. Although ictal EEG tracings greatly increase the sensitivity of the study in assessing the pathophysiology of specific behavioral episodes, the clinician must still be aware of limitations inherent in such recordings. ( Videos showing actual EEG recordings obtained during seizures [Videos 32A.1 to 32A.3] are available at www.expertconsult.com.)
The type of epileptiform activity on EEG is helpful in classifying a patient’s seizure type correctly and sometimes in identifying a specific epileptic syndrome (see Chapter 67). Clinically, generalized tonic-clonic seizures may be generalized from the outset or may be secondary to spread from a focus. Lapses of awareness with automatisms may be a manifestation either of a generalized nonconvulsive form of epilepsy (absence seizures) or of focal epileptogenic dysfunction (temporal lobe epilepsy). The initial clinical features of a seizure may be uncertain because of postictal amnesia or nocturnal occurrence. In these and similar situations, the EEG can provide information crucial to the correct diagnosis and appropriate therapy.
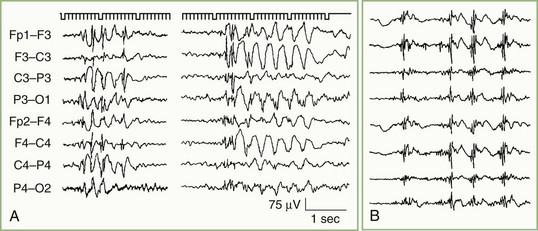
In generalized seizures of nonfocal origin, the EEG typically shows bilaterally synchronous diffuse bursts of spikes and spike-and-wave discharges (Fig. 32A.5). All generalized EEG epileptiform patterns share certain common features, although the exact expression of the spike-wave activity varies depending on whether the patient has pure absence, tonic-clonic, myoclonic, or atonic-astatic seizures. The EEG also may distinguish between primary and secondary generalized epilepsy. In the former instance, no cerebral disease is demonstrable, whereas in the latter, evidence can be found for diffuse brain damage. Typically, primary (idiopathic) generalized epilepsy is associated with normal or near-normal EEG background rhythms, whereas secondary (symptomatic) epilepsy is associated with some degree of generalized slow-wave activity.
Consistently focal epileptiform activity is the signature of partial (focal) epilepsy (Fig. 32A.6). With the exception of the benign focal epilepsies of childhood, focal epileptiform activity results from neuronal dysfunction caused by demonstrable brain disease. The waveform of focal epileptiform discharges is largely independent of localization, but a reasonable correlation exists between spike location and the type of ictal behavior. Anterior temporal spikes usually are associated with complex partial seizures, rolandic spikes with simple motor or sensory seizures, and occipital spikes with primitive visual hallucinations or diminished visual function as an initial feature.
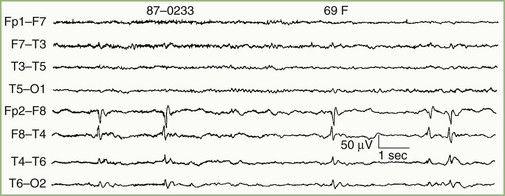
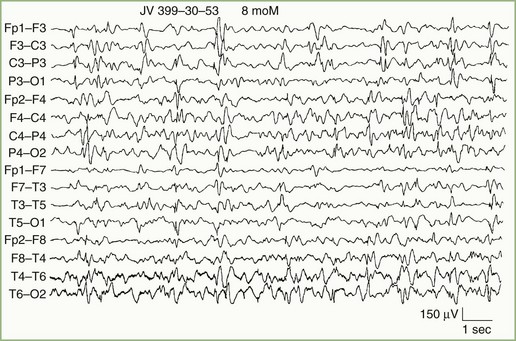
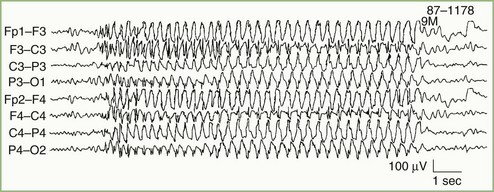
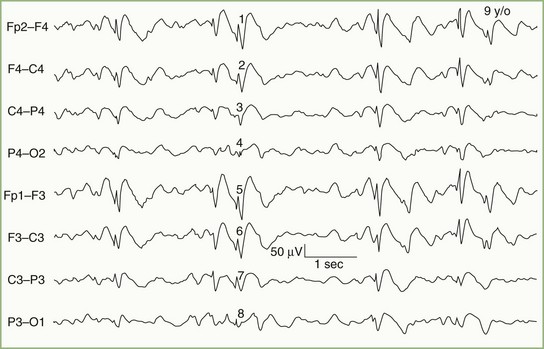
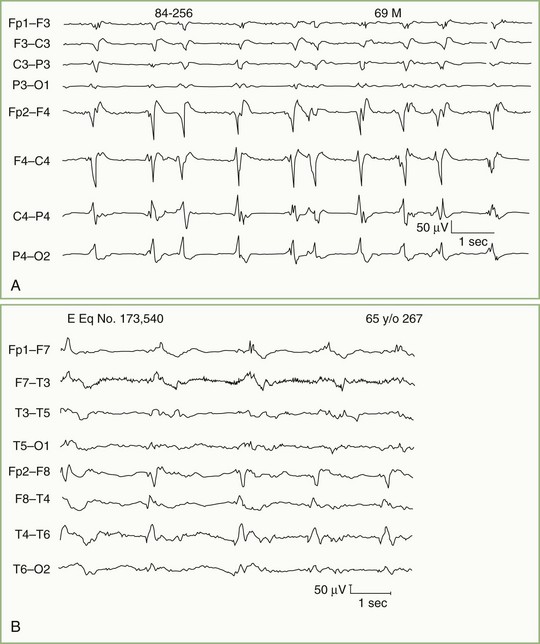
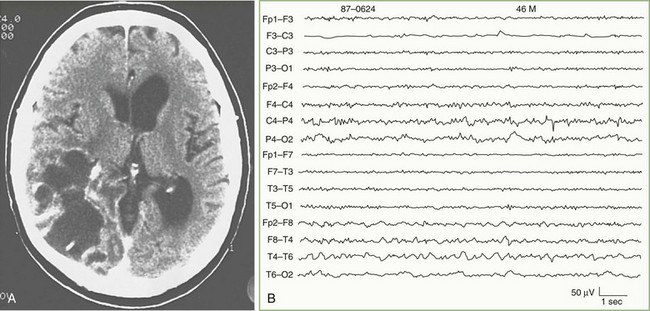
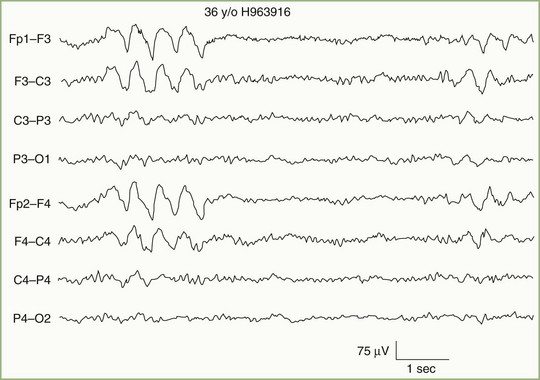
In addition to distinguishing epileptiform from nonepileptiform abnormalities, EEG analysis sometimes identifies specific electroclinical syndromes. Such syndromes include hypsarrhythmia associated with infantile spasms (West syndrome) (Fig. 32A.7); 3-Hz spike-and-wave activity associated with typical absence attacks (petit mal epilepsy) (Fig. 32A.8); generalized multiple spikes and waves (polyspike-wave pattern) associated with myoclonic epilepsy, including so-called juvenile myoclonic epilepsy of Janz (see Fig. 32A.5, B); generalized sharp and slow waves (slow spike-and-wave pattern) associated with Lennox-Gastaut syndrome (Fig. 32A.9); central-midtemporal spikes associated with benign rolandic epilepsy (Fig. 32A.10); and periodic lateralized epileptiform discharges (PLEDs) associated with acute destructive cerebral lesions such as hemorrhagic cerebral infarction, a rapidly growing malignancy, or herpes simplex encephalitis (Fig. 32A.11) (Pohlmann-Eden et al., 1996). PLEDs may also reappear in patients with chronic structural lesions in the context of new metabolic derangements.
Focal Cerebral Lesions
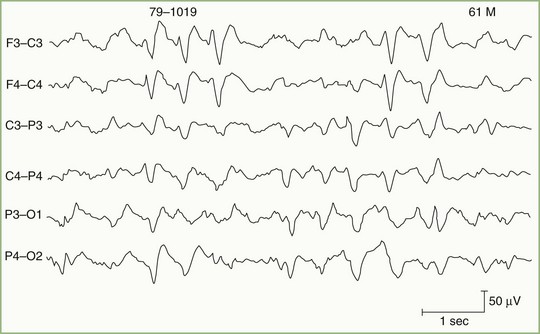
Focal delta activity is the usual EEG sign of a local disturbance. A structural lesion is likely if the delta activity is (1) present continuously; (2) shows variability in waveform, amplitude, duration, and morphology (so-called arrhythmic or polymorphic activity); and (3) persists during changes in wake/sleep states (Fig. 32A.12). The localizing value of focal delta activity increases when it is topographically discrete or associated with depression or loss of superimposed faster background frequencies. Superficial lesions tend to produce restricted EEG changes, whereas deep cerebral lesions produce hemispherical or even bilateral delta activity.
Bilateral paroxysmal bursts of rhythmic delta waves (Fig. 32A.13) with frontal predominance—once attributed to subfrontal, deep midline, or posterior fossa lesions—are actually nonspecific and seen more often with diffuse encephalopathies. Focal or lateralized intermittent bursts of rhythmic delta waves as the prominent EEG abnormality suggest a deep supratentorial (periventricular or diencephalic) lesion.
Altered States of Consciousness


Metabolic Encephalopathies
Metabolic derangements affecting the brain diffusely constitute one of the most common causes of altered mental function in a general hospital. Generalized slow-wave activity is the main indication of decreased consciousness. The degree of EEG slowing closely parallels the patient’s mental status and ranges from only minor slowing of alpha-rhythm frequency (slight inattentiveness and decreased alertness) to continuous delta activity (coma). Slow-wave activity sometimes becomes bisynchronous and assumes a high-voltage, sharply contoured triphasic morphology, especially over the frontal head regions (Fig. 32A.14). These triphasic waves, originally considered diagnostic of hepatic failure, occur with equal frequency in other metabolic disorders such as uremia, hyponatremia, hyperthyroidism, anoxia, and hyperosmolarity. The value of triphasic waves is that they suggest a metabolic cause in an unresponsive patient.
Hypoxia
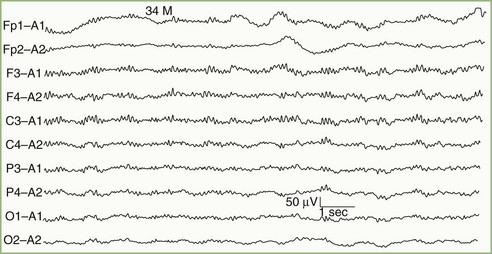
The term alpha coma refers to the apparent paradoxical appearance of monorhythmic alpha frequency activity in the EEG of a comatose patient; the EEG recording may appear normal to the inexperienced observer (Fig. 32A.15). In contrast with normal alpha activity, that seen with alpha coma is generalized, often maximal frontally, and unreactive to external stimuli.
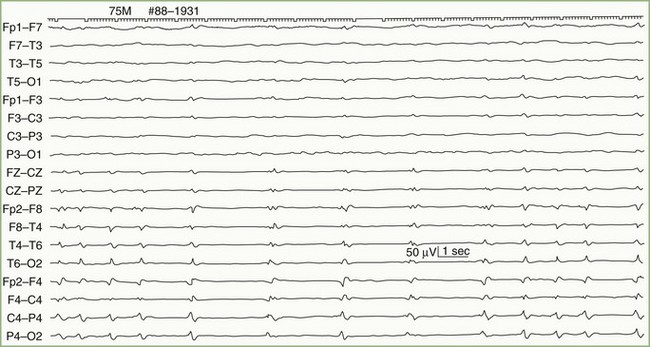
The burst suppression pattern consists of occasional generalized bursts of medium- to high-voltage, mixed-frequency, slow-wave activity, sometimes with intermixed spikes, with intervening periods of severe voltage depression or cerebral inactivity (Fig. 32A.16). Massive myoclonic body jerks may accompany the bursts.
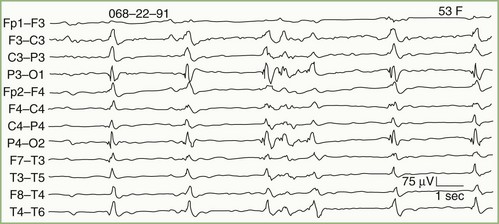
The periodic pattern consists of generalized spikes or sharp waves that recur with a relatively fixed interval, typically 1 or 2 per second (Fig. 32A.17). Sometimes the periodic sharp waves occur independently over each hemisphere. Myoclonic jerks of the limbs or whole body usually accompany a postanoxic periodic pattern.
Infectious Diseases
Viral encephalitis is expected to cause diffuse polymorphic slow-wave activity, and a normal EEG result raises doubt about the diagnosis. With herpes simplex encephalitis, a majority of patients show focal temporal or frontotemporal slowing that may be unilateral or, if bilateral, asymmetrical. Periodic sharp-wave complexes over one or both frontotemporal regions (occasionally in other locations and sometimes generalized) add additional specificity to the EEG findings (see Fig. 32A.11, B). These diagnostic features usually appear between days 2 and 15 of illness and sometimes are detectable only with serial tracings.
Brain Death
Temporary and reversible loss of cerebral electrical activity is observable immediately after cardiorespiratory resuscitation, drug overdose from CNS depressants, and severe hypothermia. Therefore, accurate interpretation of an EEG demonstrating electrocerebral inactivity must take into account these exceptional circumstances. Chapter 48 summarizes the clinical criteria for establishing the diagnosis of brain death.
Aging and Dementia
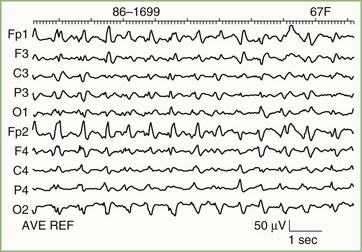
EEG findings in Alzheimer disease are highly dependent on timing. The EEG initially is normal or shows an alpha rhythm at or just below the lower limits of normal. Generalized slowing ensues as the disease progresses. In patients with focal cognitive deficits, accentuation of slow frequency activity over the corresponding brain area may be a feature. Continuous focal slowing is sufficiently unusual to suggest the possibility of another diagnosis. Prominent focal or bilateral independent slow-wave activity, especially if seen in company with a normal alpha rhythm, favors multifocal disease such as multiple cerebral infarcts. Sometimes a specific cause may be suggested. For example, an EEG showing generalized typical periodic sharp-wave complexes in a patient with dementia is virtually diagnostic of Creutzfeldt-Jakob disease (Fig. 32A.18).
Event-related evoked potentials have application in the study of dementia. These long-latency events (i.e., potentials occurring more than 150 msec after the stimulus) are heavily dependent on psychic and cognitive factors. Ideally, they measure the brain’s intrinsic mechanisms for processing certain types of information and are potentially valuable in the electrophysiological assessment of dementia. The best known of the event-related potentials is the P300, or P3, wave. The place of these long-latency evoked potentials in the evaluation of dementia is still under investigation, but the pattern of electrophysiological abnormality may be helpful in distinguishing among types of dementia (Comi and Leocani, 2000).
Magnetoencephalography
Despite these differences, MEG recordings appear substantially similar to EEG recordings, and when interpreted by visual inspection, appear to have sensitivities for epileptiform activity similar to those of sleep-deprived EEGs (Colon et al., 2009). Although MEG may be potentially more “patient-friendly” than EEG, because it does not require placement of electrodes on the scalp, its substantially greater cost has largely precluded its routine use. The main application of MEG has been to localize sources of evoked potentials and focal epileptiform activity, usually in consideration of epilepsy surgery. The limitations that apply to dipole source localization of EEG signals, however, apply similarly to MEG signals. For this reason, interpretation of MEG findings requires caution, and the technique is best viewed as an adjunct to established methods of localization such as intracranial electroencephalography (Cappell et al., 2006).
Evoked Potentials
Visual Evoked Potentials
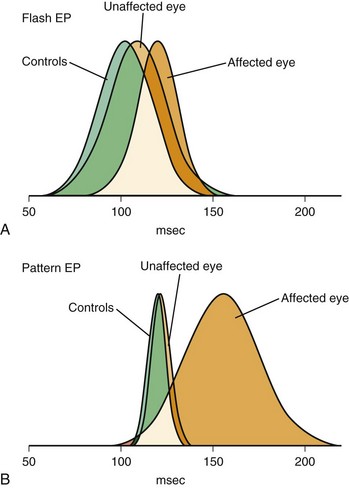
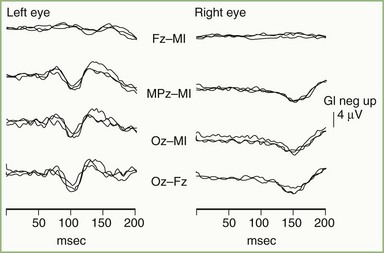
Cerebral visual evoked potentials (VEPs) are responses of the visual cortex to appropriate stimuli. Recording of the composite retinal response to visual stimuli, electroretinography, may be performed separately. Obtaining the cerebral VEP is accomplished by averaging the responses from occipital scalp electrodes generated by 100 or more sequential stimuli. Stimulus characteristics are critically important in determining the portion of the visual system to test by the VEP and the sensitivity of the test needed. Initial clinical applications of VEPs used a stroboscopic flash stimulus, but severely limiting the utility of the flash-evoked VEP are the great variability of responses among normal persons and its relative insensitivity to clinical lesions (Fig. 32A.19). Occasionally, flash VEPs may provide limited information about the integrity of visual pathways when the preferred pattern-reversal stimulus is not usable, as in infants or older patients unable to cooperate for more sensitive testing methods.
Normal Visual Evoked Potential
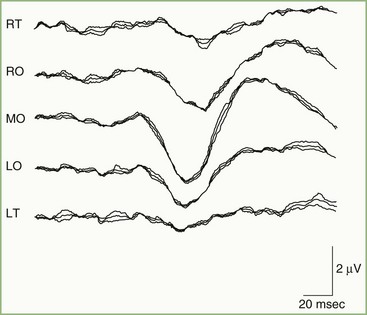
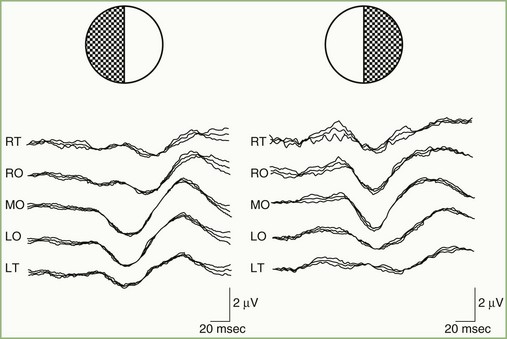
A normal pattern-reversal VEP to full-field monocular stimulation is illustrated in Fig. 32A.20. The VEP waveform is deceptively simple. It is the sum of many waveforms generated simultaneously by various areas of the retinotopically organized occipital cortex. By selectively stimulating portions of the visual field, it is possible to dissect the full-field VEP wave into its component waveforms. For example, Fig. 32A.21, recorded from the same patient as in Fig. 32A.20, illustrates VEPs to right and left hemifield stimulation. It is apparent that the full-field VEP is the sum of the two hemifield responses. In principle, it is possible to divide the visual fields into progressively smaller and smaller components and to record the VEP to each independently.
Visual Evoked Potentials in Neurological Disease
Acute optic neuritis is accompanied by marked attenuation or loss of P100 wave amplitude following pattern-reversal stimulation of the affected eye. After the acute attack, the VEP shows some recovery, but P100 latency usually remains prolonged, even with restoration of functionally normal vision. In patients with a history of optic neuritis, P100 latency typically is prolonged, but waveform amplitude and morphology often are relatively well preserved (Fig. 32A.22). Factors contributing to changes in P100 probably include the combined effects of patchy conduction block, areas of variably slowed conduction, temporal dispersion of the afferent volley in the optic nerve, loss of some components of the normal VEP, and the appearance of previously masked components.
Pattern-reversal VEPs are highly sensitive to demyelinating lesions but are not specific for MS. Box 32A.1 provides a partial list of other causes of abnormal VEPs. VEPs may be helpful in distinguishing hysteria or malingering from blindness. A normal pattern-reversal VEP is strong evidence in favor of psychogenic illness. Rare cases have been reported, however, in which essentially normal VEPs were present in cortical blindness because of bilateral destruction of Brodmann area 17, with preservation of areas 18 and 19, or bilateral occipital infarcts with preservation of area 17 (Epstein, 2000).
Brainstem Auditory Evoked Potentials
Normal Brainstem Auditory Evoked Potentials
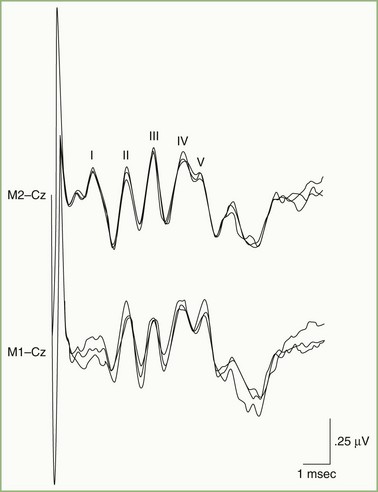
Fig. 32A.23 illustrates a normal BAEP recording. Summated neuronal activities in anatomical structures activated sequentially by the afferent sensory volley produce the components designated by roman numerals. Uncertainty exists regarding the relative contributions to the scalp-recorded BAEP of synaptic potentials occurring in nuclear structures and compound action potentials in fiber tracts. Although the following electroanatomical relationships may be somewhat oversimplified, they are useful for purposes of clinical localization. Wave I, corresponding to N1 of the electrocochleogram, represents the auditory nerve compound action potential, which arises in the distalmost portion of the nerve. The potential represented by wave II is generated mainly in the proximal eighth nerve but probably also includes a contribution from the intraaxial portion of the nerve and perhaps the cochlear nucleus as well. The wave III potential is generated in the lower pons in the region of the superior olive and trapezoid body. The generators of waves IV and V lie in the upper pons and the midbrain, as high as the inferior colliculus. Waves II and IV are inconsistently identified in some normal persons, so clinical interpretation of BAEPs is based primarily on latency measurements of waves I, III, and V. Despite decussation of brainstem auditory pathways at multiple levels, clinical experience indicates that unilateral BAEP abnormalities usually reflect lesions ipsilateral to the stimulated ear.
Brainstem Auditory Evoked Potentials in Neurological Disease
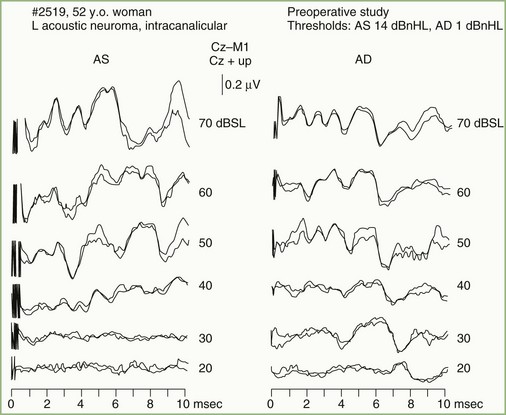
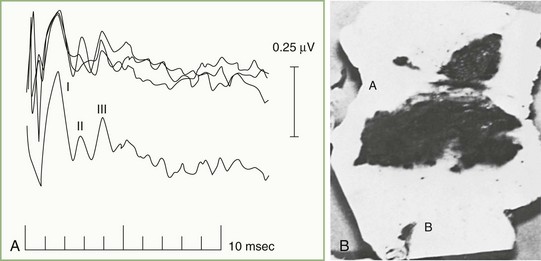
Auditory nerve pathology has several effects on the BAEP, related in part to the nature and size of the lesion. Findings range from prolongation of the I-III interpeak interval, to preservation of wave I with distortion or loss of later components, to loss of all BAEP components. Any of these abnormalities occur with acoustic neurinomas and other cerebellopontine angle tumors (Fig. 32A.24). In fact, the BAEP is perhaps the most sensitive screening test for acoustic neurinoma, detecting abnormalities in greater than 90% of the patients. The sensitivity of the test can be extended further by using a range of stimulus intensities and evaluating the effect on components of the BAEP (the latency intensity) (Fig. 32A.25).
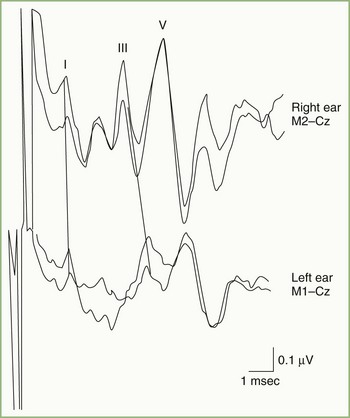
In patients with focal brainstem lesions that impinge on the auditory pathways, the BAEP is abnormal and the type of abnormality reflects the lesion’s location and extent. For example, Fig. 32A.26 illustrates a BAEP recorded in a patient with a brainstem hemorrhage that involved the rostral two-thirds of the pons but spared the caudal third. Waves IV and V are absent, but waves I, II, and III are relatively normal. BAEPs are normal when brainstem lesions do not involve auditory pathways, as is often the case in the locked-in syndrome produced by ventral pontine infarction, or with Wallenberg lateral medullary syndrome. By contrast, pontine gliomas nearly always produce abnormal BAEPs.
BAEPs are useful to assess hearing in young children and in patients otherwise unable to cooperate with standard audiological testing. A latency intensity study, discussed previously, permits characterization of the response threshold for wave V as well as the relationship between wave V latency and stimulus intensity. Such testing allows estimation of hearing threshold and may distinguish between conductive and sensorineural types of hearing impairment. Brainstem audiometry, however, is not really a hearing test per se but rather a measure of the brainstem’s sensitivity to auditory input. The BAEP is normal in the rare patient with deafness due to bilateral cortical lesions. On the other hand, patients with MS or a pontine glioma often have abnormal BAEP results but normal hearing (although their ability to localize sound accurately in space may diminish). One limitation to use of BAEPs to test hearing is that the brainstem must be intact, so that BAEP alterations reflect dysfunction in the peripheral hearing apparatus (Lueders and Terada, 2000).
Somatosensory Evoked Potentials
Normal Median Nerve Somatosensory Evoked Potentials
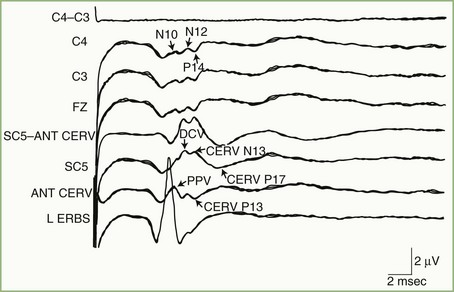
Fig. 32A.27 shows a normal SEP elicited by median nerve stimulation. The accompanying diagram indicates presumed generator sources for the various components of the SEP. An electrode at the Erb point ipsilateral to the stimulated arm registers the afferent volley as it passes through the brachial plexus. The Erb point potential serves as a reference point against which the latencies of subsequent components are measured. Electrodes over the midcervical dorsal spine record two potentials with independent but partially overlapping waveforms that reflect local activity in the spinal cord. The first of these, designated DCV (for dorsal column volley), is the afferent volley in the cuneate tract. The second, N13, reflects postsynaptic activity in the central gray matter of the cervical cord, generated by input from axon collaterals off the primary large-fiber afferents. A simultaneous potential of opposite polarity (P13) over the anterior neck accompanies the N13. Lesions that disrupt the central gray matter, such as syringomyelia, may selectively affect the N13/P13.

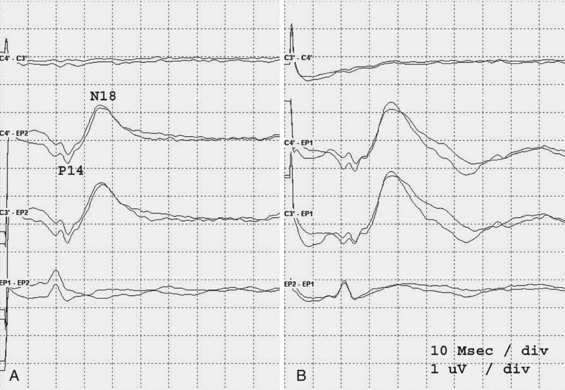
An electrode placed on the scalp away from the primary sensory area best records the SEP components generated in the brainstem. This electrode “sees” subcortical activity that is volume-conducted to the scalp surface. Generation of the P14 is in the cervicomedullary region, probably by the caudal medial lemniscus. Following the P14 is the N18, seen as a long-duration negative wave whose origin is uncertain but probably includes postsynaptic activity from multiple generators in the brainstem. Fig. 32A.28 illustrates preservation of the P14 but loss of the N18 and all later waves in a patient with an arteriovenous malformation of the right pons. This pattern probably is the electrophysiological equivalent of functional transection of the medial lemniscus at a pontine level.
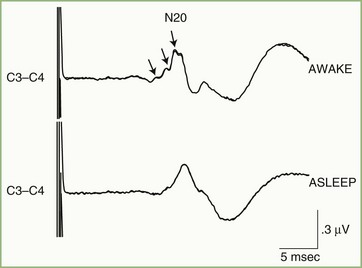
The initial cortical response to the afferent sensory volley is designated N20 and is best recorded by a scalp electrode placed directly over the primary sensory cortex contralateral to the stimulated side. The N20 waveform is a composite made up of signals from multiple generators within or close to the primary cortical receiving area. This can be demonstrated by selective stimulation of cutaneous and muscle-spindle afferent fibers in the median nerve, which are known to project to adjacent but distinct cortical regions, or by observation of state-dependent changes in the N20 (Fig. 32A.29). Sleep, for example, attenuates small inflections that are often present on the waking N20 wave, a phenomenon probably caused by downward modulation of some generators contributing to N20 and to alterations in thalamic input to cortex during sleep.
Normal Posterior Tibial Nerve Somatosensory Evoked Potentials
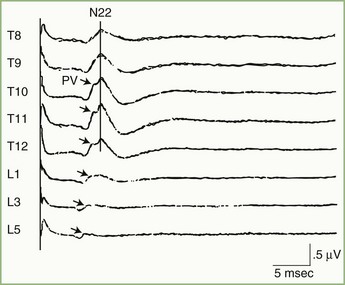
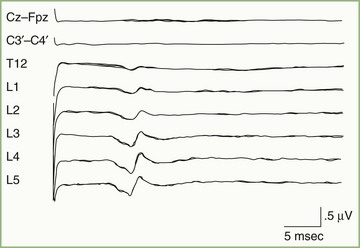
Somatosensory evoked potentials to posterior tibial nerve stimulation are in many ways analogous to median nerve SEPs. When the posterior tibial nerve is stimulated, recordings from electrodes over the lumbar spine show two distinct potentials (Fig. 32A.30). One of these, PV, is produced by the afferent volley in the lumbar nerve roots and gracile tract, and the other, N22, is a summated synaptic potential generated in the gray matter of the lumbar cord. Because of its stability, fixed latency, and relatively high voltage, the clinical use of the N22 lumbar potential is as a reference point against which latencies of subsequent components are measured. Additionally, determination of the spinal level where N22 voltage is maximal provides an approximate indication of the position of the lumbar cord enlargement. This capability sometimes is clinically useful with suspected spinal cord tethering (Fig. 32A.31).
Subcortical activity from posterior tibial nerve stimulation consists of P31, seen on the EEG as a positive wave, followed by N34, seen as a long-duration negative wave (Fig. 32A.32). These components are analogous to the P14 and N18 occurring after median nerve stimulation and probably are generated by the afferent volley in the caudal medial lemniscus and by postsynaptic activity in the rostral brainstem, respectively.
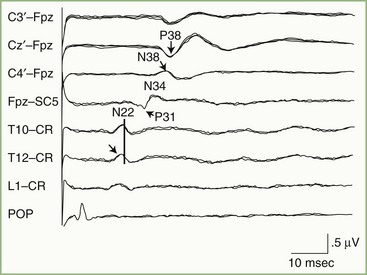
The initial cortical response to posterior tibial nerve stimulation is a prominent positivity (P38) that is recorded from scalp electrodes placed at the vertex and central parasagittal regions, close to the cortical areas representing the leg (see Fig. 32A.32). This positive potential usually is maximal just lateral to the vertex, ipsilateral to the stimulated nerve. This apparently paradoxical localization of the P38 reflects the mesial location of the primary sensory area for the leg and foot within the interhemispherical fissure.
Somatosensory Evoked Potentials in Neurological Disease
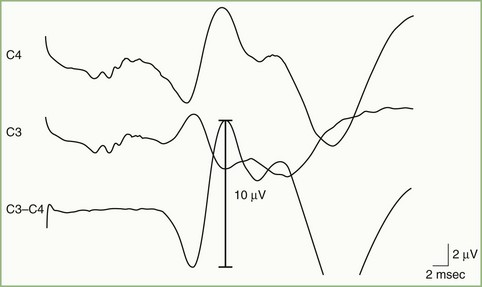
Many lesions alter the SEP by producing a conduction delay or block. This results in prolonged interpeak latencies or in attenuation or even loss of one or more SEP components. Abnormally large SEPs involving exaggeration of cortical components occurring after N20 (from the median nerve) are characteristic of patients with progressive myoclonus epilepsy, some patients with photosensitive epilepsy, and children with late infantile ceroid lipofuscinosis (Fig. 32A.33) (Emerson and Pedley, 2003).
An important application of SEP is as an aid to prognosis in patients resuscitated following cardiopulmonary arrest. In that setting, bilateral absence of the N20 is accurately predictive of a poor neurological outcome (Wijdicks et al., 2006) (Fig. 32A.34).
Motor Evoked Potentials and Magnetic Coil Stimulation
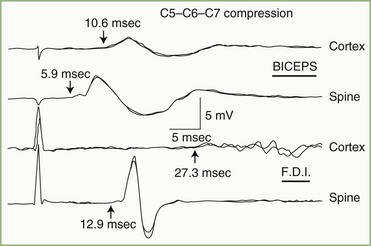
MEPs can provide information about motor pathways that complements data about sensory pathways obtained from SEPs. MEPs frequently are abnormal in patients with myelopathies caused by cervical spondylosis (Fig. 32A.35), in whom they appear to be sensitive to early preclinical spinal cord compression. Often, delay occurs in patients with MS, and MEPs may be more sensitive to demyelinating lesions than VEPs or SEPs. In motor neuron disease, pyramidal tract conduction delays are demonstrable in patients without upper motor neuron signs.
Transcranial magnetic coil stimulation provides a means of studying normal cortical physiology by transiently interrupting the regional function. Disruption of cortical processing produced by single or repetitive magnetic stimuli has been useful to study not only the function of the motor system but also cortical somatosensory, visual, and language processing function. Finally, proposed therapeutic uses for TMS include stroke, epilepsy, parkinsonism, dystonia, and depression (Rossini et al., 2010).
Intraoperative Monitoring
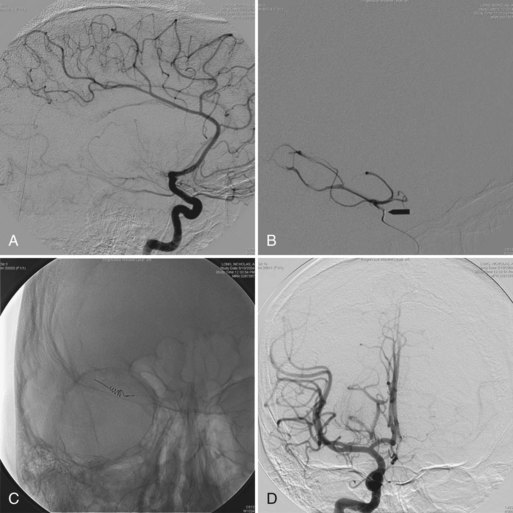
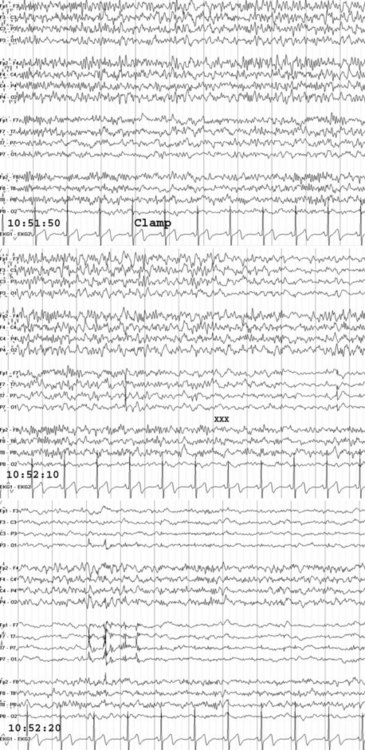
EEG monitoring is commonly used during carotid endarterectomy, embolization of cerebral arteriovenous malformations, and clipping or removal of some aneurysms. Monitoring is especially helpful in selecting patients for shunting during occlusion of the carotid artery (Fig. 32A.36). With monitoring, the rate of overall intraoperative major morbidity for endarterectomy should be reducible to 1%.
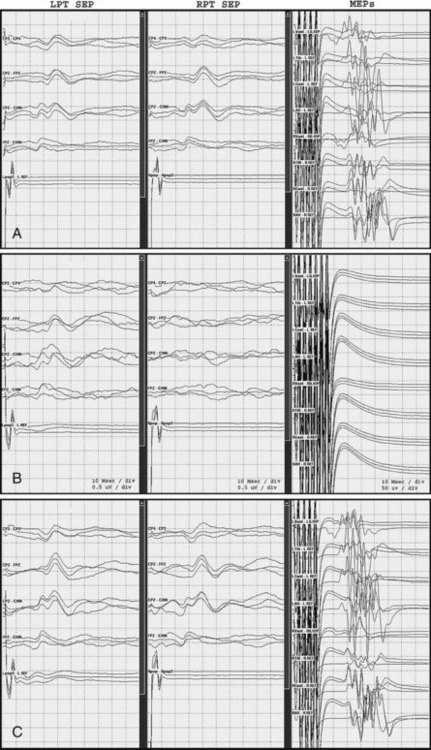
SEPs are in routine use to monitor baseline and spinal cord function during neurosurgical and orthopedic procedures. They provide useful and sensitive feedback information about the integrity of the dorsal column somatosensory system. MEPs are particularly sensitive to the effects of spinal cord ischemia, compression, distraction, and blunt trauma and are useful to monitor spinal cord function during surgical procedures (Fig. 32A.37). They complement SEPs in that SEPs may not detect surgical injuries limited to the lateral and anterior spinal cord (Mendiratta and Emerson, 2009).
American Clinical Neurophysiology Society. Guideline 3: minimum technical standards for EEG recording in suspected cerebral death. J Clin Neurophysiol. 2006;23:97-104.
American Clinical Neurophysiology Society. Guideline 9A, 9B, 9C, 9D. J Clin Neurophysiol. 2006;23:125-179.
Buzsaki G., Draguhn A. Neuronal oscillations in cortical networks. Science. 2004;30:1926-1929.
Cappell J., Schevon C., Emerson R.G. Magnetoencephalography in epilepsy: tailoring interpretation and making inferences. Curr Neurol Neurosci Rep. 2006;6:327-331.
Colon A.J., Ossenblok P., Nieuwenhuis L., et al. Use of routine MEG in the primary diagnostic process of epilepsy. J Clin Neurophysiol. 2009;26:326-332.
Comi G., Leocani L. Electrophysiological correlates of dementia. Suppl Clin Neurophysiol. 2000;53:331-336.
Drislane F.W., Lopez M.R., Blum A.S., et al. Detection and treatment of refractory status epilepticus in the intensive care unit. J Clin Neurophysiol. 2008;25:181-186.
Ebersole J.S. Sublobar localization of temporal neocortical epileptogenic foci by source modeling. Adv Neurol. 2000;84:353-363.
Emerson R.G., Pedley T.A. Somatosensory evoked potentials. In: Ebersole J.S., Pedley T.A. Current Practice of Clinical Electroencephalography. third ed. New York: Lippincott Williams & Williams; 2003:892-922.
Emerson R.G., Turner C.A., Pedley T.A., et al. Propagation patterns of temporal spikes. Electroencephalogr Clin Neurophysiol. 1995;94:338-348.
Epstein C.E. Visual evoked potentials. In: Levin K.H., Lueders H.O. Comprehensive Clinical Neurophysiology. Philadelphia: W. B. Saunders; 2000:507-524.
Friedman D., Claassen J., Hirsch L.J. Continuous electroencephalogram monitoring in the intensive care unit. Anesth Analg. 2009;109:506-523.
Lueders H.O., Terada K. Auditory evoked potentials. In: Levin K.H., Lueders H.O. Comprehensive Clinical Neurophysiology. Philadelphia: W. B. Saunders; 2000:525-541.
Mendiratta A., Emerson R.G. Neurophysiologic intraoperative monitoring of scoliosis surgery. J Clin Neurophysiol. 2009;26(2):62-69.
Pohlmann-Eden B., Hoch D.B., Chiappa K.H. Periodic lateralized epileptiform discharges—a critical review. J Clin Neurophysiol. 1996;13:519-530.
Rossini P.M., Rossini L., Ferreri F. Brain-behavior relations: transcranial magnetic stimulation: a review. IEEE Eng Med Biol Mag. 2010 Jan-Feb;29(1):84-95.
Scheuer M.L. Continuous EEG monitoring in the intensive care unit. Epilepsia. 2002;43:114-127.
Schevon C.A., Ng S., Cappell J., et al. Microphysiology of epileptiform activity in human neocortex. J Clin Neurophysiol. 2008;25:321-330.
Schevon C.A., Trevelyan A.J., Schroeder C.E., et al. Spatial characterization of interictal high frequency oscillations in epileptic neocortex. Brain. 2009;132:3047-3059.
Selvitelli M.F., Walker L.M., Schomer D.L., et al. The relationship of interictal epileptiform discharges to clinical epilepsy severity: a study of routine electroencephalograms and review of the literature. J Clin Neurophysiol. 2010;27:87-92.
Wijdicks E.F.M., Hijdra A., Young G.B., et al. Practice parameter: prediction of outcome in comatose survivors after cardiopulmonary resuscitation (an evidence-based review): report of the Quality Standards Subcommittee of the American Academy of Neurology. Neurology. 2006;67:203-210.