[level-membership-for-basic-science-category]
CHAPTER 3 Chromosomes and Cell Division
At the molecular or submicroscopic level, DNA can be regarded as the basic template that provides a blueprint for the formation and maintenance of an organism. DNA is packaged into chromosomes and at a very simple level these can be considered as being made up of tightly coiled long chains of genes. Unlike DNA, chromosomes can be visualized during cell division using a light microscope, under which they appear as threadlike structures or ‘colored bodies’. The word chromosome is derived from the Greek chroma (= color) and soma (= body).
The study of chromosomes and cell division is referred to as cytogenetics. Before the 1950s it was thought, incorrectly, that each human cell contained 48 chromosomes and that human sex was determined by the number of X chromosomes present at conception. Following the development in 1956 of more reliable techniques for studying human chromosomes, it was realized that the correct chromosome number in humans is 46 (p. 5) and that maleness is determined by the presence of a Y chromosome regardless of the number of X chromosomes present in each cell. It was also realized that abnormalities of chromosome number and structure could seriously disrupt normal growth and development.
Table 3.1 highlights the methodological developments that have taken place during the past 5 decades that underpin our current knowledge of human cytogenetics.
Table 3.1 Development of methodologies for cytogenetics
| Decade | Development | Examples of Application |
|---|---|---|
| 1950–1960s | Reliable methods for chromosome preparations | Chromosome number determined to be 46 (1956) and Philadelphia chromosome identified as t(9;22) (1960) |
| 1970s | Giemsa chromosome banding | Mapping of RB1 gene to chromosome 13q14 by identification of deleted chromosomal region in patients with retinoblastoma (1976) |
| 1980s | Fluorescent in-situ hybridization (FISH) | Interphase FISH for rapid detection of Down syndrome (1994) Spectral karyotyping for whole genome chromosome analysis (1996) |
| 1990s | Comparative genomic hybridization (CGH) | Mapping genomic imbalances in solid tumors (1992) |
| 2000s | Array CGH | Analysis of constitutional rearrangements; e.g., identification of ∼5 Mb deletion in a patient with CHARGE syndrome that led to identification of the gene (2004) |
CHARGE, coloboma of the eye, heart defects, atresia of the choanae, retardation of growth and/or development, genital and/or urinary abnormalities, and ear abnormalities and deafness.
Human Chromosomes
Morphology
At the submicroscopic level, chromosomes consist of an extremely elaborate complex, made up of supercoils of DNA, which has been likened to the tightly coiled network of wiring seen in a solenoid (p. 31). Under the electron microscope chromosomes can be seen to have a rounded and rather irregular morphology (Figure 3.1). However, most of our knowledge of chromosome structure has been gained using light microscopy. Special stains selectively taken up by DNA have enabled each individual chromosome to be identified. These are best seen during cell division, when the chromosomes are maximally contracted and the constituent genes can no longer be transcribed.
Figure 3.1 Electron micrograph of human chromosomes showing the centromeres and well-defined chromatids.
(Courtesy Dr. Christine Harrison. Reproduced from Harrison et al 1983 Cytogenet Cell Genet 35: 21–27; with permission of the publisher, S. Karger, Basel.)
At this time each chromosome can be seen to consist of two identical strands known as chromatids, or sister chromatids, which are the result of DNA replication having taken place during the S (synthesis) phase of the cell cycle (p. 39). These sister chromatids can be seen to be joined at a primary constriction known as the centromere. Centromeres consist of several hundred kilobases of repetitive DNA and are responsible for the movement of chromosomes at cell division. Each centromere divides the chromosome into short and long arms, designated p (= petite) and q (‘g’ = grande), respectively.
Morphologically chromosomes are classified according to the position of the centromere. If this is located centrally, the chromosome is metacentric, if terminal it is acrocentric, and if the centromere is in an intermediate position the chromosome is submetacentric (Figure 3.2). Acrocentric chromosomes sometimes have stalk-like appendages called satellites that form the nucleolus of the resting interphase cell and contain multiple repeat copies of the genes for ribosomal RNA.
Classification
The development of chromosome banding (p. 33) enabled very precise recognition of individual chromosomes and the detection of subtle chromosome abnormalities. This technique also revealed that chromatin, the combination of DNA and histone proteins that comprise chromosomes, exists in two main forms. Euchromatin stains lightly and consists of genes that are actively expressed. In contrast, heterochromatin stains darkly and is made up largely of inactive, unexpressed, repetitive DNA.
The Sex Chromosomes
The X and Y chromosomes are known as the sex chromosomes because of their crucial role in sex determination. The X chromosome was originally labeled as such because of uncertainty as to its function when it was realized that in some insects this chromosome is present in some gametes but not in others. In these insects the male has only one sex chromosome (X), whereas the female has two (XX). In humans, and in most mammals, both the male and the female have two sex chromosomes—XX in the female and XY in the male. The Y chromosome is much smaller than the X and carries only a few genes of functional importance, most notably the testis-determining factor, known as SRY (p. 92). Other genes on the Y chromosome are known to be important in maintaining spermatogenesis.
In the female each ovum carries an X chromosome, whereas in the male each sperm carries either an X or a Y chromosome. As there is a roughly equal chance of either an X-bearing sperm or a Y-bearing sperm fertilizing an ovum, the numbers of male and female conceptions are approximately equal (Figure 3.3). In fact, slightly more male babies are born than females, although during childhood and adult life the sex ratio evens out at 1 : 1.
The process of sex determination is considered in detail later (p. 101).
Methods of Chromosome Analysis
It was generally believed that each cell contained 48 chromosomes until 1956, when Tjio and Levan correctly concluded on the basis of their studies that the normal human somatic cell contains only 46 chromosomes (p. 5). The methods they used, with certain modifications, are now universally employed in cytogenetic laboratories to analyze the chromosome constitution of an individual, which is known as a karyotype. This term is also used to describe a photomicrograph of an individual’s chromosomes, arranged in a standard manner.
Chromosome Preparation
In the case of peripheral (venous) blood, a sample is added to a small volume of nutrient medium containing phytohemagglutinin, which stimulates T lymphocytes to divide. The cells are cultured under sterile conditions at 37°C for about 3 days, during which they divide, and colchicine is then added to each culture. This drug has the extremely useful property of preventing formation of the spindle, thereby arresting cell division during metaphase, the time when the chromosomes are maximally condensed and therefore most visible. Hypotonic saline is then added, which causes the red blood cells to lyze and results in spreading of the chromosomes, which are then fixed, mounted on a slide and stained ready for analysis (Figure 3.4).
Chromosome Banding
Several different staining methods can be used to identify individual chromosomes but G (Giemsa) banding is used most commonly. The chromosomes are treated with trypsin, which denatures their protein content, and then stained with a DNA-binding dye–—also known as ‘Giemsa’–—that gives each chromosome a characteristic and reproducible pattern of light and dark bands (Figure 3.5).
Karyotype Analysis
The banding pattern of each chromosome is specific and can be shown in the form of a stylized ideal karyotype known as an idiogram (Figure 3.6). The cytogeneticist analyzes each pair of homologous chromosomes, either directly by looking down the microscope or using an image capture system to photograph the chromosomes and arrange them in the form of a karyogram (Figure 3.7).
Molecular Cytogenetics
Fluorescent In-Situ Hybridization
This diagnostic tool combines conventional cytogenetics with molecular genetic technology. It is based on the unique ability of a portion of single-stranded DNA (i.e., a probe; see p. 35) to anneal with its complementary target sequence on a metaphase chromosome, interphase nucleus or extended chromatin fiber. In fluorescent in-situ hybridization (FISH), the DNA probe is labeled with a fluorochrome which, after hybridization with the patient’s sample, allows the region where hybridization has occurred to be visualized using a fluorescence microscope. FISH has been widely used for clinical diagnostic purposes during the past 15 years and there are a number of different types of probes that may be employed.
Different Types of FISH Probe
Centromeric probes
These consist of repetitive DNA sequences found in and around the centromere of a specific chromosome. They were the original probes used for rapid diagnosis of the common aneuploidy syndromes (trisomies 13, 18, 21; see p. 274) using non-dividing cells in interphase obtained from a prenatal diagnostic sample of chorionic villi. In the present, quantitative fluorescent polymerase chain reaction is more commonly used to detect these trisomies.
Chromosome-specific unique-sequence probes
These are specific for a particular single locus. Unique-sequence probes are particularly useful for identifying tiny submicroscopic deletions and duplications (Figure 3.8). The group of disorders referred to as the microdeletion syndromes are described in Chapter 18. Another application is the use of an interphase FISH probe to identify HER2 overexpression in breast tumors to identify patients likely to benefit from Herceptin treatment.
Telomeric probes
A complete set of telomeric probes was been developed for all 24 chromosomes (i.e., autosomes 1 to 22 plus X and Y). Using these, a method has been devised that enables the simultaneous analysis of the subtelomeric region of every chromosome by means of only one microscope slide per patient. This proved to be a useful technique for identifying tiny ‘cryptic’ subtelomeric abnormalities, but has largely been replaced with a quantitative polymerase chain reaction method, multiplex ligation-dependent probe amplifications, that simultaneously measures dosage for all the subtelomeric chromosome regions.
Whole-Chromosome paint probes
These consist of a cocktail of probes obtained from different parts of a particular chromosome. When this mixture of probes is used together in a single hybridization, the entire relevant chromosome fluoresces (i.e., is ‘painted’). Chromosome painting is extremely useful for characterizing complex rearrangements, such as subtle translocations (Figure 3.9), and for identifying the origin of additional chromosome material, such as small supernumerary markers or rings.
Comparative Genomic Hybridization
Comparative genomic hybridization (CGH) was originally developed to overcome the difficulty of obtaining good-quality metaphase preparations from solid tumors. This technique enabled the detection of regions of allele loss and gene amplification (p. 220). Tumor or ‘test’ DNA was labeled with a green paint, and control normal DNA with a red paint. The two samples were mixed and hybridized competitively to normal metaphase chromosomes, and an image captured (Figure 3.10). If the test sample contained more DNA from a particular chromosome region than the control sample, that region was identified by an increase in the green to red fluorescence ratio (Figure 3.11). Similarly a deletion in the test sample was identified by a reduction in the green to red fluorescence ratio.
Array CGH
Cytogenetic techniques are traditionally based on microscopic analysis. However, the increasing application of microarray technology is also having a major impact on cytogenetics. Although array CGH is a molecular biology technique, it is introduced in this chapter because it has evolved from metaphase CGH and is being used to investigate chromosome structure.
Array CGH also involves the hybridization of patient and reference DNA, but metaphase chromosomes are replaced as the target by large numbers of DNA sequences bound to glass slides (Figure 3.11). The DNA target sequences have evolved from mapped clones (yeast artificial chromosome [YAC], bacterial artificial chromosome [BAC], or P1-derived artificial chromosome [PAC] or cosmid), to oligonucleotides. They are spotted on to the microscope slides using robotics to create a microarray, in which each DNA target has a unique location. Following hybridization and washing to remove unbound DNA, the relative levels of fluorescence are measured using computer software. Oligonucleotide arrays provide the highest resolution and can include up to 1 million probes.
Chromosome Nomenclature
By convention each chromosome arm is divided into regions and each region is subdivided into bands, numbering always from the centromere outwards (Figure 3.12). A given point on a chromosome is designated by the chromosome number, the arm (p or q), the region, and the band (e.g., 15q12). Sometimes the word region is omitted, so that 15q12 would be referred to simply as band 12 on the long arm of chromosome 15.
A shorthand notation system exists for the description of chromosome abnormalities (Table 3.2). Normal male and female karyotypes are depicted as 46,XY and 46,XX, respectively. A male with Down syndrome as a result of trisomy 21 would be represented as 47,XY,+21, whereas a female with a deletion of the short arm of one number 5 chromosome (cri du chat syndrome; see p. 281) would be represented as 46,XX,del(5p). A chromosome report reading 46,XY,t(2;4)(p23;q25) would indicate a male with a reciprocal translocation involving the short arm of chromosome 2 at region 2 band 3 and the long arm of chromosome 4 at region 2 band 5.
| Term | Explanation | Example |
|---|---|---|
| p | Short arm | |
| q | Long arm | |
| cen | Centromere | |
| del | Deletion | 46,XX,del(1)(q21) |
| dup | Duplication | 46,XY, dup(13)(q14) |
| fra | Fragile site | |
| i | Isochromosome | 46,X,i(Xq) |
| inv | Inversion | 46XX,inv(9)(p12q12) |
| ish | In-situ hybridization | |
| r | Ring | 46;XX,r(21) |
| t | Translocation | 46,XY,t(2;4)(q21;q21) |
| ter | Terminal or end | Tip of arm; e.g., pter or qter |
| / | Mosaicism | 46,XY/47,XXY |
| + or – | Sometimes used after a chromosome arm in text to indicate gain or loss of part of that chromosome | 46,XX,5p– |
Cell Division
Mitosis
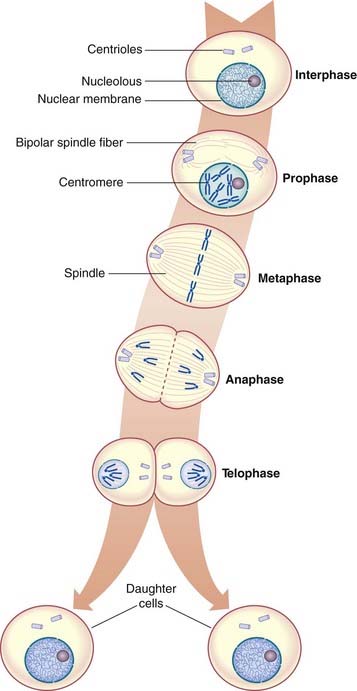
Prior to a cell entering mitosis, each chromosome consists of two identical sister chromatids as a result of DNA replication having taken place during the S phase of the cell cycle (p. 39). Mitosis is the process whereby each of these pairs of chromatids separates and disperses into separate daughter cells.
Mitosis is a continuous process that usually lasts 1 to 2 hours, but for descriptive purposes it is convenient to distinguish five distinct stages. These are prophase, prometaphase, metaphase, anaphase, and telophase (Figure 3.13).
Metaphase
In metaphase the chromosomes become aligned along the equatorial plane or plate of the cell, where each chromosome is attached to the centriole by a microtubule forming the mature spindle. At this point the chromosomes are maximally contracted and, therefore, most easily visible. Each chromosome resembles the letter X in shape, as the chromatids of each chromosome have separated longitudinally but remain attached at the centromere, which has not yet undergone division.
The Cell Cycle
The period between successive mitoses is known as the interphase of the cell cycle (Figure 3.14). In rapidly dividing cells this lasts for between 16 and 24 hours. Interphase commences with the G1 (G = gap) phase during which the chromosomes become thin and extended. This phase of the cycle is very variable in length and is responsible for the variation in generation time between different cell populations. Cells that have stopped dividing, such as neurons, usually arrest in this phase and are said to have entered a noncyclic stage known as G0.
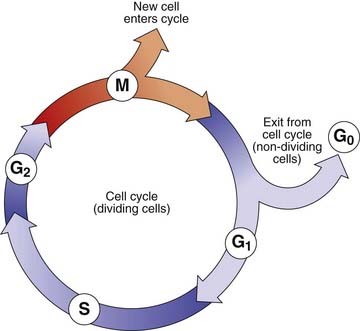
The G1 phase is followed by the S phase (S = synthesis), when DNA replication occurs and the chromatin of each chromosome is replicated. This results in the formation of two chromatids, giving each chromosome its characteristic X-shaped configuration. The process of DNA replication commences at multiple points on a chromosome (p. 14).
Homologous pairs of chromosomes usually replicate in synchrony. However, one of the X chromosomes is always late in replicating. This is the inactive X chromosome (p. 103) that forms the sex chromatin or so-called Barr body, which can be visualized during interphase in female somatic cells. This used to be the basis of a rather unsatisfactory means of sex determination based on analysis of cells obtained by scraping the buccal mucosa—a ‘buccal smear’.
Meiosis
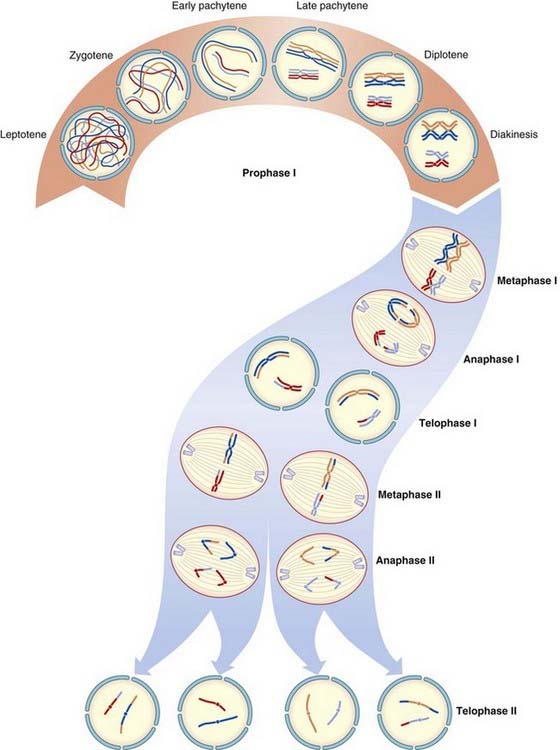
Meiosis I
Prophase I
Chromosomes enter this stage already split longitudinally into two chromatids joined at the centromere. Homologous chromosomes pair and, with the exception of the X and Y chromosomes in male meiosis, exchange of homologous segments occurs between non-sister chromatids; that is, chromatids from each of the pair of homologous chromosomes. This exchange of homologous segments between chromatids occurs as a result of a process known as crossing over or recombination. The importance of crossing over in linkage analysis and risk calculation is considered later (pp. 136, 345).
During prophase I in the male, pairing occurs between homologous segments of the X and Y chromosomes at the tip of their short arms, with this portion of each chromosome being known as the pseudoautosomal region (p. 118).
The prophase stage of meiosis I is relatively lengthy and can be subdivided into five stages.
Diplotene
The homologous recombinant chromosomes now begin to separate but remain attached at the points where crossing over has occurred. These are known as chiasmata. On average, small, medium, and large chromosomes have one, two, and three chiasmata, respectively, giving an overall total of approximately 40 recombination events per meiosis per gamete.
The Consequences of Meiosis
Gametogenesis
The process of gametogenesis shows fundamental differences in males and females (Table 3.3). These have quite distinct clinical consequences if errors occur.
| Males | Females | |
|---|---|---|
| Commences | Puberty | Early embryonic life |
| Duration | 60–65 days | 10–50 years |
| Numbers of mitoses in gamete formation | 30–500 | 20–30 |
| Gamete production per meiosis | 4 spermatids | 1 ovum + 3 polar bodies |
| Gamete production | 100–200 million per ejaculate | 1 ovum per menstrual cycle |
Oogenesis
Mature ova develop from oogonia by a complex series of intermediate steps. Oogonia themselves originate from primordial germ cells by a process involving 20 to 30 mitotic divisions that occur during the first few months of embryonic life. By the completion of embryogenesis at 3 months of intrauterine life, the oogonia have begun to mature into primary oocytes that start to undergo meiosis. At birth all of the primary oocytes have entered a phase of maturation arrest, known as dictyotene, in which they remain suspended until meiosis I is completed at the time of ovulation, when a single secondary oocyte is formed. This receives most of the cytoplasm. The other daughter cell from the first meiotic division consists largely of a nucleus and is known as a polar body. Meiosis II then commences, during which fertilization can occur. This second meiotic division results in the formation of a further polar body (Figure 3.16).
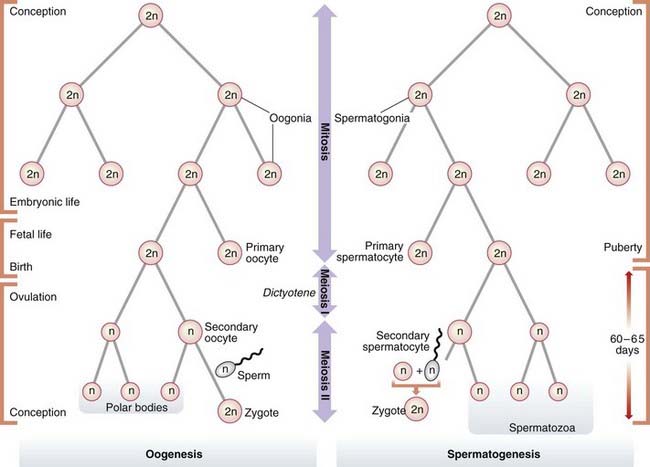
It is probable that the very lengthy interval between the onset of meiosis and its eventual completion, up to 50 years later, accounts for the well documented increased incidence of chromosome abnormalities in the offspring of older mothers (p. 44). The accumulating effects of ‘wear and tear’ on the primary oocyte during the dictyotene phase probably damage the cell’s spindle formation and repair mechanisms, thereby predisposing to non-disjunction (p. 17).
Spermatogenesis
In contrast, spermatogenesis is a relatively rapid process with an average duration of 60 to 65 days. At puberty spermatogonia, which will already have undergone approximately 30 mitotic divisions, begin to mature into primary spermatocytes which enter meiosis I and emerge as haploid secondary spermatocytes. These then undergo the second meiotic division to form spermatids, which in turn develop without any subsequent cell division into mature spermatozoa, of which 100 to 200 million are present in each ejaculate.
Spermatogenesis is a continuous process involving many mitotic divisions, possibly as many as 20 to 25 per annum, so that mature spermatozoa produced by a man of 50 years or older could well have undergone several hundred mitotic divisions. The observed paternal age effect for new dominant mutations (p. 113) is consistent with the concept that many mutations arise as a consequence of DNA copy errors occurring during mitosis.
Chromosome Abnormalities
Specific disorders caused by chromosome abnormalities are considered in Chapter 18. In this section, discussion is restricted to a review of the different types of abnormality that may occur. These can be divided into numerical and structural, with a third category consisting of different chromosome constitutions in two or more cell lines (Box 3.1).
Numerical Abnormalities
Numerical abnormalities involve the loss or gain of one or more chromosomes, referred to as aneuploidy, or the addition of one or more complete haploid complements, known as polyploidy. Loss of a single chromosome results in monosomy. Gain of one or two homologous chromosomes is referred to as trisomy or tetrasomy, respectively.
Trisomy
The presence of an extra chromosome is referred to as trisomy. Most cases of Down syndrome are due to the presence of an additional number 21 chromosome; hence, Down syndrome is often known as trisomy 21. Other autosomal trisomies compatible with survival to term are Patau syndrome (trisomy 13) (p. 275) and Edwards syndrome (trisomy 18) (p. 275). Most other autosomal trisomies result in early pregnancy loss, with trisomy 16 being a particularly common finding in first-trimester spontaneous miscarriages. The presence of an additional sex chromosome (X or Y) has only mild phenotypic effects (p. 104).
Trisomy 21 is usually caused by failure of separation of one of the pairs of homologous chromosomes during anaphase of maternal meiosis I. This failure of the bivalent to separate is called non-disjunction. Less often, trisomy can be caused by non-disjunction occurring during meiosis II when a pair of sister chromatids fails to separate. Either way the gamete receives two homologous chromosomes (disomy); if subsequent fertilization occurs, a trisomic conceptus results (Figure 3.17).
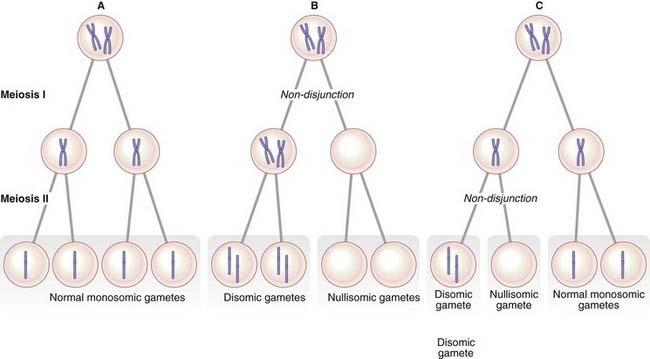
The origin of non-disjunction
The consequences of non-disjunction in meiosis I and meiosis II differ in the chromosomes found in the gamete. An error in meiosis I leads to the gamete containing both homologs of one chromosome pair. In contrast, non-disjunction in meiosis II results in the gamete receiving two copies of one of the homologs of the chromosome pair. Studies using DNA markers have shown that most children with an autosomal trisomy have inherited their additional chromosome as a result of non-disjunction occurring during one of the maternal meiotic divisions (Table 3.4).
Table 3.4 Parental origin of meiotic error leading to aneuploidy
| Chromosome Abnormality | Paternal (%) | Maternal (%) |
|---|---|---|
| Trisomy 13 | 15 | 85 |
| Trisomy 18 | 10 | 90 |
| Trisomy 21 | 5 | 95 |
| 45,X | 80 | 20 |
| 47,XXX | 5 | 95 |
| 47,XXY | 45 | 55 |
| 47,XYY | 100 | 0 |
Non-disjunction can also occur during an early mitotic division in the developing zygote. This results in the presence of two or more different cell lines, a phenomenon known as mosaicism (p. 50).
The cause of non-disjunction
The cause of non-disjunction is uncertain. The most favored explanation is that of an aging effect on the primary oocyte, which can remain in a state of suspended inactivity for up to 50 years (p. 41). This is based on the well-documented association between advancing maternal age and increased incidence of Down syndrome in offspring (see Table 18.4; see p. 275). A maternal age effect has also been noted for trisomies 13 and 18.
Monosomy
The absence of a single chromosome is referred to as monosomy. Monosomy for an autosome is almost always incompatible with survival to term. Lack of contribution of an X or a Y chromosome results in a 45,X karyotype, which causes the condition known as Turner syndrome (p. 277).
Polyploidy
Triploidy can be caused by failure of a maturation meiotic division in an ovum or sperm, leading, for example, to retention of a polar body or to the formation of a diploid sperm. Alternatively it can be caused by fertilization of an ovum by two sperm: this is known as dispermy. When triploidy results from the presence of an additional set of paternal chromosomes, the placenta is usually swollen with what are known as hydatidiform changes (p. 101). In contrast, when triploidy results from an additional set of maternal chromosomes, the placenta is usually small. Triploidy usually results in early spontaneous miscarriage (Figure 3.18). The differences between triploidy due to an additional set of paternal chromosomes or maternal chromosomes provide evidence for important ‘epigenetic’ and ‘parent of origin’ effects with respect to the human genome. These are discussed in more detail in Chapter 6.
Structural Abnormalities
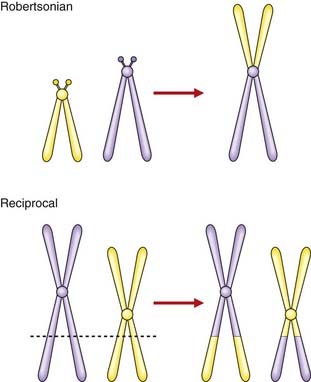
Translocations
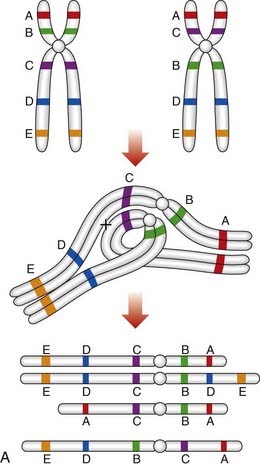
A translocation refers to the transfer of genetic material from one chromosome to another. A reciprocal translocation is formed when a break occurs in each of two chromosomes with the segments being exchanged to form two new derivative chromosomes. A Robertsonian translocation is a particular type of reciprocal translocation in which the breakpoints are located at, or close to, the centromeres of two acrocentric chromosomes (Figure 3.19).
Reciprocal translocations
A reciprocal translocation involves breakage of at least two chromosomes with exchange of the fragments. Usually the chromosome number remains at 46 and, if the exchanged fragments are of roughly equal size, a reciprocal translocation can be identified only by detailed chromosomal banding studies or FISH (see Figure 3.9). In general, reciprocal translocations are unique to a particular family, although, for reasons that are unknown, a particular balanced reciprocal translocation involving the long arms of chromosomes 11 and 22 is relatively common. The overall incidence of reciprocal translocations in the general population is approximately 1 in 500.
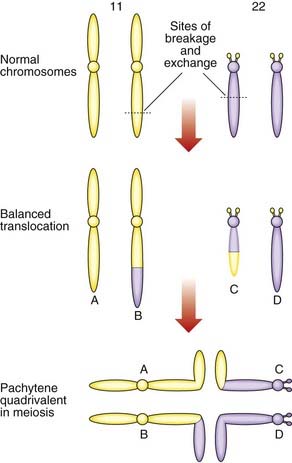
Segregation at meiosis
The importance of balanced reciprocal translocations lies in their behavior at meiosis, when they can segregate to generate significant chromosome imbalance. This can lead to early pregnancy loss or to the birth of an infant with multiple abnormalities. Problems arise at meiosis because the chromosomes involved in the translocation cannot pair normally to form bivalents. Instead they form a cluster known as a pachytene quadrivalent (Figure 3.20). The key point to note is that each chromosome aligns with homologous material in the quadrivalent.
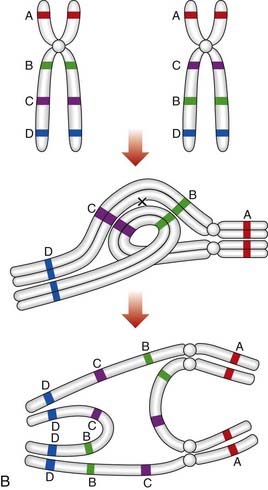
2 : 2 Segregation
When the constituent chromosomes in the quadrivalent separate during the later stages of meiosis I, they can do so in several different ways (Table 3.5). If alternate chromosomes segregate to each gamete, the gamete will carry a normal or balanced haploid complement (Figure 3.21) and with fertilization the embryo will either have normal chromosomes or carry the balanced rearrangement. If, however, adjacent chromosomes segregate together, this will invariably result in the gamete acquiring an unbalanced chromosome complement. For example, in Figure 3.20, if the gamete inherits the normal number 11 chromosome (A) and the derivative number 22 chromosome (C), then fertilization will result in an embryo with monosomy for the distal long arm of chromosome 22 and trisomy for the distal long arm of chromosome 11.
Table 3.5 Patterns of segregation of a reciprocal translocation (see Figures 3.20 and 3.21)
| Pattern of Segregation | Segregating Chromosomes | Chromosome Constitution in Gamete |
|---|---|---|
| 2 : 2 | ||
| Alternate | A + D | Normal |
| B + C | Balanced translocation | |
| Adjacent-1 (non-homologous centromeres segregate together) | A + C or B + D | Unbalanced, leading to a combination of partial monosomy and partial trisomy in the zygote |
| Adjacent-2 (homologous centromeres segregate together) | A + B or C + D | |
| 3 : 1 | ||
| Three chromosomes | A + B + C A + B + D A + C + D B + C + D |
Unbalanced, leading to trisomy in the zygote |
| One chromosome | A B C D |
Unbalanced, leading to monosomy in the zygote |
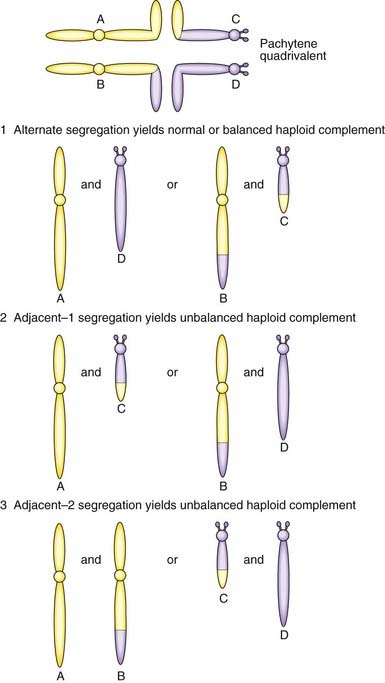
3 : 1 Segregation
Another possibility is that three chromosomes segregate to one gamete with only one chromosome in the other gamete. If, for example, in Figure 3.20 chromosomes 11 (A), 22 (D) and the derivative 22 (C) segregate together to a gamete that is subsequently fertilized, this will result in the embryo being trisomic for the material present in the derivative 22 chromosome. This is sometimes referred to as tertiary trisomy. Experience has shown that, with this particular reciprocal translocation, tertiary trisomy for the derivative 22 chromosome is the only viable unbalanced product. All other patterns of malsegregation lead to early pregnancy loss. Unfortunately, tertiary trisomy for the derivative 22 chromosome is a serious condition in which affected children have multiple congenital abnormalities and severe learning difficulties.
Robertsonian translocations
A Robertsonian translocation results from the breakage of two acrocentric chromosomes (numbers 13, 14, 15, 21, and 22) at or close to their centromeres, with subsequent fusion of their long arms (see Figure 3.19). This is also referred to as centric fusion. The short arms of each chromosome are lost, this being of no clinical importance as they contain genes only for ribosomal RNA, for which there are multiple copies on the various other acrocentric chromosomes. The total chromosome number is reduced to 45. Because there is no loss or gain of important genetic material, this is a functionally balanced rearrangement. The overall incidence of Robertsonian translocations in the general population is approximately 1 in 1000, with by far the most common being fusion of the long arms of chromosomes 13 and 14 (13q14q).
Segregation at meiosis
As with reciprocal translocations, the importance of Robertsonian translocations lies in their behavior at meiosis. For example, a carrier of a 14q21q translocation can produce gametes with (Figure 3.22):
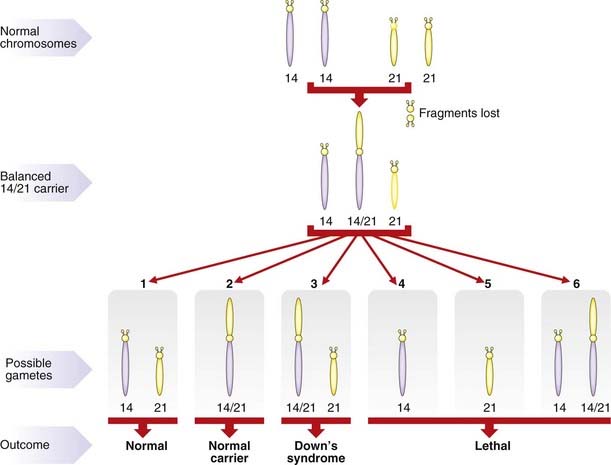
Translocation Down syndrome
The major practical importance of Robertsonian translocations is that they can predispose to the birth of babies with Down syndrome as a result of the embryo inheriting two normal number 21 chromosomes (one from each parent) plus a translocation chromosome involving a number 21 chromosome (Figure 3.23). The clinical consequences are exactly the same as those seen in pure trisomy 21. However, unlike trisomy 21, the parents of a child with translocation Down syndrome have a relatively high risk of having further affected children if one of them carries the rearrangement in a balanced form.
Risks in Robertsonian translocations
Studies have shown that the female carrier of either a 13q21q or a 14q21q Robertsonian translocation runs a risk of approximately 10% for having a baby with Down syndrome, whereas for male carriers the risk is 1% to 3%. It is worth sparing a thought for the unfortunate carrier of a 21q21q Robertsonian translocation. All gametes will be either nullisomic or disomic for chromosome 21. Consequently, all pregnancies will end either in spontaneous miscarriage or in the birth of a child with Down syndrome. This is one of the very rare situations in which offspring are at a risk of greater than 50% for having an abnormality. Other examples are parents who are both heterozygous for the same autosomal dominant disorder (p. 113), and parents who are both homozygous for the same gene mutation causing an autosomal recessive disorder, such as sensorineural deafness.
Deletions
Deletions are now recognized as existing at two levels. A ‘large’ chromosomal deletion can be visualized under the light microscope. Such deletion syndromes include Wolf-Hirschhorn and cri du chat, which involve loss of material from the short arms of chromosomes 4 and 5, respectively (p. 280). Submicroscopic microdeletions were identified with the help of high-resolution prometaphase cytogenetics augmented by FISH studies and include Prader-Willi and Angelman syndromes (pp. 122, 123).
Inversions
An inversion is a two-break rearrangement involving a single chromosome in which a segment is reversed in position (i.e., inverted). If the inversion segment involves the centromere it is termed a pericentric inversion (Figure 3.24A). If it involves only one arm of the chromosome it is known as a paracentric inversion (Figure 3.24B).
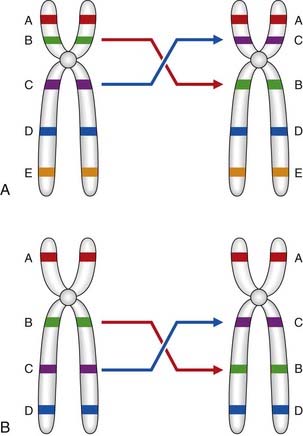
Figure 3.24 A, Pericentric and, B, paracentric inversions.
(Courtesy Dr. J. Delhanty, Galton Laboratory, London.)
Segregation at meiosis
Pericentric inversions
An individual who carries a pericentric inversion can produce unbalanced gametes if a crossover occurs within the inversion segment during meiosis I, when an inversion loop forms as the chromosomes attempt to maintain homologous pairing at synapsis. For a pericentric inversion, a crossover within the loop will result in two complementary recombinant chromosomes, one with duplication of the distal non-inverted segment and deletion of the other end of the chromosome, and the other having the opposite arrangement (Figure 3.25A).
Paracentric inversions
If a crossover occurs in the inverted segment of a paracentric inversion, this will result in recombinant chromosomes that are either acentric or dicentric (Figure 3.25B). Acentric chromosomes, which strictly speaking should be known as chromosomal fragments, cannot undergo mitotic division, so that survival of an embryo with such a rearrangement is extremely uncommon. Dicentric chromosomes are inherently unstable during cell division and are, therefore, also unlikely to be compatible with survival of the embryo. Thus, overall, the likelihood that a balanced parental paracentric inversion will result in the birth of an abnormal baby is extremely low.
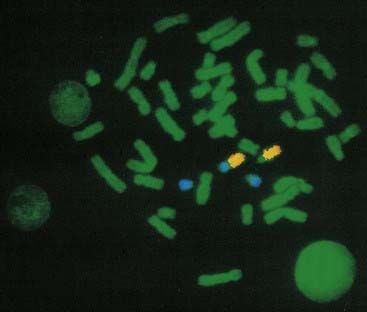
Ring Chromosomes
A ring chromosome is formed when a break occurs on each arm of a chromosome leaving two ‘sticky’ ends on the central portion that reunite as a ring (Figure 3.26). The two distal chromosomal fragments are lost so that, if the involved chromosome is an autosome, the effects are usually serious.
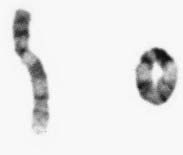
Figure 3.26 Partial karyotype showing a ring chromosome 9.
(Courtesy Meg Heath, City Hospital, Nottingham.)
Isochromosomes
An isochromosome shows loss of one arm with duplication of the other. The most probable explanation for the formation of an isochromosome is that the centromere has divided transversely rather than longitudinally. The most commonly encountered isochromosome is that which consists of two long arms of the X chromosome. This accounts for up to 15% of all cases of Turner syndrome (p. 277).
Mosaicism and Chimerism (Mixoploidy)
Mosaicism
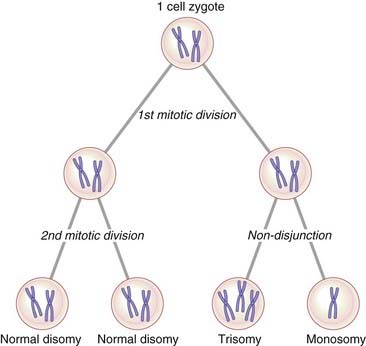
Mosaicism can be defined as the presence in an individual, or in a tissue, of two or more cell lines that differ in their genetic constitution but are derived from a single zygote, that is, they have the same genetic origin. Chromosome mosaicism usually results from non-disjunction in an early embryonic mitotic division with the persistence of more than one cell line. If, for example, the two chromatids of a number 21 chromosome failed to separate at the second mitotic division in a human zygote (Figure 3.27), this would result in the four-cell zygote having two cells with 46 chromosomes, one cell with 47 chromosomes (trisomy 21), and one cell with 45 chromosomes (monosomy 21). The ensuing cell line with 45 chromosomes would probably not survive, so that the resulting embryo would be expected to show approximately 33% mosaicism for trisomy 21. Mosaicism accounts for 1% to 2% of all clinically recognized cases of Down syndrome.
Mosaicism can also exist at a molecular level if a new mutation arises in a somatic or early germline cell division (p. 120). The possibility of germline or gonadal mosaicism is a particular concern when counseling the parents of a child in whom a condition such as Duchenne muscular dystrophy (p. 307) is an isolated case.
Chimerism
Dispermic chimeras
These are the result of double fertilization whereby two genetically different sperm fertilize two ova and the resulting two zygotes fuse to form one embryo. If the two zygotes are of different sex, the chimeric embryo can develop into an individual with true hermaphroditism (p. 287) and an XX/XY karyotype. Mouse chimeras of this type can now be produced experimentally in the laboratory to facilitate the study of gene transfer.
Blood chimeras
Blood chimeras result from an exchange of cells, via the placenta, between non-identical twins in utero. For example, 90% of one twin’s cells can have an XY karyotype with red blood cells showing predominantly blood group B, whereas 90% of the cells of the other twin can have an XX karyotype with red blood cells showing predominantly blood group A. It has long been recognized that, when twin calves of opposite sex are born, the female can have ambiguous genitalia. It is now thought that this is because of gonadal chimerism in the female calves, which are known as freemartins.
Barch MJ, Knutsen T, Spurbeck JL, editors. The AGT cytogenetics laboratory manual, 3rd ed, Philadelphia: Lippincott-Raven, 1997.
A large multiauthor laboratory handbook produced by the Association of Genetic Technologists.
Gersen SL, Keagle MB, editors. The principles of clinical cytogenetics, 3rd ed, Totowa, NJ: Humana Press, 2011.
A detailed multiauthor guide to all aspects of laboratory and clinical cytogenetics.
Shaffer LG, Slovak ML, Campbell LJ, editors. An international system for human cytogenetic nomenclature. Basel: Karger, 2009.
A report giving details of how chromosome abnormalities should be described.
Rooney DE, Czepulkowski BH. Human chromosome preparation. Essential techniques. Chichester, UK: John Wiley; 1997.
A laboratory handbook describing the different methods available for chromosome analysis.
Speicher MR, Carter NP. The new cytogenetics: blurring the boundaries with molecular biology. Nat Rev Gen. 2006;6:782-792.
A review of the exciting advances in FISH and array-based techniques.
Therman E, Susman M. Human chromosomes. Structure, behavior and effects, 3rd ed. New York: Springer; 1993.
A useful and comprehensive introduction to human cytogenetics.
Tjio JH, Levan A. The chromosome number of man. Hereditas. 1956;42:1-6.
National Center for Biotechnology Information. Microarrays: chipping away at the mysteries of science and medicine. Online.
http://www.ncbi.nlm.nih.gov/About/primer/microarrays.html
Elements
[/level-membership-for-basic-science-category][not-level-membership-for-basic-science-category]
CHAPTER 3 Chromosomes and Cell Division
At the molecular or submicroscopic level, DNA can be regarded as the basic template that provides a blueprint for the formation and maintenance of an organism. DNA is packaged into chromosomes and at a very simple level these can be considered as being made up of tightly coiled long chains of genes. Unlike DNA, chromosomes can be visualized during cell division using a light microscope, under which they appear as threadlike structures or ‘colored bodies’. The word chromosome is derived from the Greek chroma (= color) and soma (= body).
The study of chromosomes and cell division is referred to as cytogenetics. Before the 1950s it was thought, incorrectly, that each human cell contained 48 chromosomes and that human sex was determined by the number of X chromosomes present at conception. Following the development in 1956 of more reliable techniques for studying human chromosomes, it was realized that the correct chromosome number in humans is 46 (p. 5) and that maleness is determined by the presence of a Y chromosome regardless of the number of X chromosomes present in each cell. It was also realized that abnormalities of chromosome number and structure could seriously disrupt normal growth and development.
Table 3.1 highlights the methodological developments that have taken place during the past 5 decades that underpin our current knowledge of human cytogenetics.
Table 3.1 Development of methodologies for cytogenetics
| Decade | Development | Examples of Application |
|---|---|---|
| 1950–1960s | Reliable methods for chromosome preparations | Chromosome number determined to be 46 (1956) and Philadelphia chromosome identified as t(9;22) (1960) |
| 1970s | Giemsa chromosome banding | Mapping of RB1 gene to chromosome 13q14 by identification of deleted chromosomal region in patients with retinoblastoma (1976) |
| 1980s | Fluorescent in-situ hybridization (FISH) | Interphase FISH for rapid detection of Down syndrome (1994) Spectral karyotyping for whole genome chromosome analysis (1996) |
| 1990s | Comparative genomic hybridization (CGH) | Mapping genomic imbalances in solid tumors (1992) |
| 2000s | Array CGH | Analysis of constitutional rearrangements; e.g., identification of ∼5 Mb deletion in a patient with CHARGE syndrome that led to identification of the gene (2004) |
CHARGE, coloboma of the eye, heart defects, atresia of the choanae, retardation of growth and/or development, genital and/or urinary abnormalities, and ear abnormalities and deafness.
Human Chromosomes
Morphology
At the submicroscopic level, chromosomes consist of an extremely elaborate complex, made up of supercoils of DNA, which has been likened to the tightly coiled network of wiring seen in a solenoid (p. 31). Under the electron microscope chromosomes can be seen to have a rounded and rather irregular morphology (Figure 3.1). However, most of our knowledge of chromosome structure has been gained using light microscopy. Special stains selectively taken up by DNA have enabled each individual chromosome to be identified. These are best seen during cell division, when the chromosomes are maximally contracted and the constituent genes can no longer be transcribed.
Figure 3.1 Electron micrograph of human chromosomes showing the centromeres and well-defined chromatids.
(Courtesy Dr. Christine Harrison. Reproduced from Harrison et al 1983 Cytogenet Cell Genet 35: 21–27; with permission of the publisher, S. Karger, Basel.)
At this time each chromosome can be seen to consist of two identical strands known as chromatids, or sister chromatids, which are the result of DNA replication having taken place during the S (synthesis) phase of the cell cycle (p. 39). These sister chromatids can be seen to be joined at a primary constriction known as the centromere. Centromeres consist of several hundred kilobases of repetitive DNA and are responsible for the movement of chromosomes at cell division. Each centromere divides the chromosome into short and long arms, designated p (= petite) and q (‘g’ = grande), respectively.
Morphologically chromosomes are classified according to the position of the centromere. If this is located centrally, the chromosome is metacentric, if terminal it is acrocentric, and if the centromere is in an intermediate position the chromosome is submetacentric (Figure 3.2). Acrocentric chromosomes sometimes have stalk-like appendages called satellites that form the nucleolus of the resting interphase cell and contain multiple repeat copies of the genes for ribosomal RNA.
Classification
The development of chromosome banding (p. 33) enabled very precise recognition of individual chromosomes and the detection of subtle chromosome abnormalities. This technique also revealed that chromatin, the combination of DNA and histone proteins that comprise chromosomes, exists in two main forms. Euchromatin stains lightly and consists of genes that are actively expressed. In contrast, heterochromatin stains darkly and is made up largely of inactive, unexpressed, repetitive DNA.
The Sex Chromosomes
The X and Y chromosomes are known as the sex chromosomes because of their crucial role in sex determination. The X chromosome was originally labeled as such because of uncertainty as to its function when it was realized that in some insects this chromosome is present in some gametes but not in others. In these insects the male has only one sex chromosome (X), whereas the female has two (XX). In humans, and in most mammals, both the male and the female have two sex chromosomes—XX in the female and XY in the male. The Y chromosome is much smaller than the X and carries only a few genes of functional importance, most notably the testis-determining factor, known as SRY (p. 92). Other genes on the Y chromosome are known to be important in maintaining spermatogenesis.
In the female each ovum carries an X chromosome, whereas in the male each sperm carries either an X or a Y chromosome. As there is a roughly equal chance of either an X-bearing sperm or a Y-bearing sperm fertilizing an ovum, the numbers of male and female conceptions are approximately equal (Figure 3.3). In fact, slightly more male babies are born than females, although during childhood and adult life the sex ratio evens out at 1 : 1.
The process of sex determination is considered in detail later (p. 101).
Methods of Chromosome Analysis
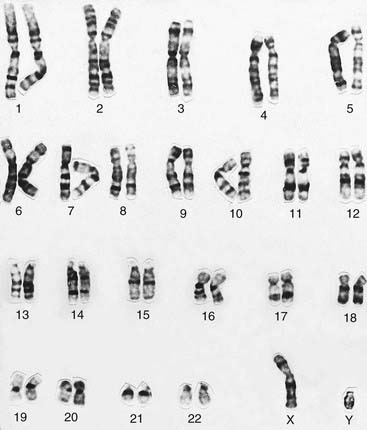
It was generally believed that each cell contained 48 chromosomes until 1956, when Tjio and Levan correctly concluded on the basis of their studies that the normal human somatic cell contains only 46 chromosomes (p. 5). The methods they used, with certain modifications, are now universally employed in cytogenetic laboratories to analyze the chromosome constitution of an individual, which is known as a karyotype. This term is also used to describe a photomicrograph of an individual’s chromosomes, arranged in a standard manner.
Chromosome Preparation
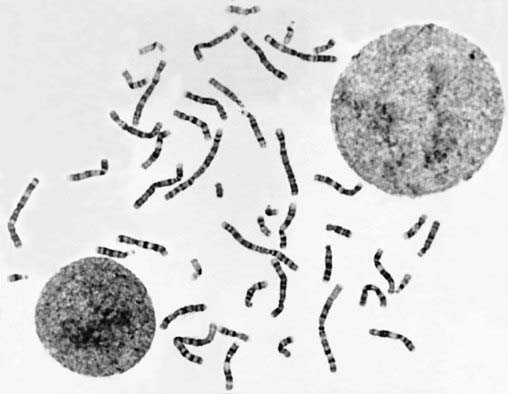
In the case of peripheral (venous) blood, a sample is added to a small volume of nutrient medium containing phytohemagglutinin, which stimulates T lymphocytes to divide. The cells are cultured under sterile conditions at 37°C for about 3 days, during which they divide, and colchicine is then added to each culture. This drug has the extremely useful property of preventing formation of the spindle, thereby arresting cell division during metaphase, the time when the chromosomes are maximally condensed and therefore most visible. Hypotonic saline is then added, which causes the red blood cells to lyze and results in spreading of the chromosomes, which are then fixed, mounted on a slide and stained ready for analysis (Figure 3.4).
Chromosome Banding
Several different staining methods can be used to identify individual chromosomes but G (Giemsa) banding is used most commonly. The chromosomes are treated with trypsin, which denatures their protein content, and then stained with a DNA-binding dye–—also known as ‘Giemsa’–—that gives each chromosome a characteristic and reproducible pattern of light and dark bands (Figure 3.5).
Karyotype Analysis
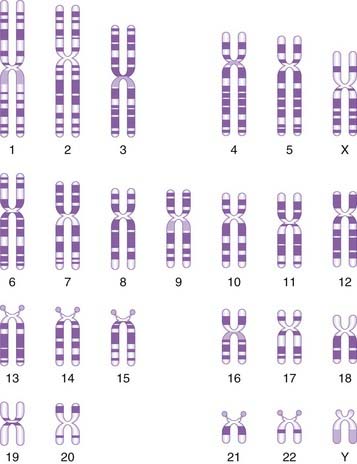
The banding pattern of each chromosome is specific and can be shown in the form of a stylized ideal karyotype known as an idiogram (Figure 3.6). The cytogeneticist analyzes each pair of homologous chromosomes, either directly by looking down the microscope or using an image capture system to photograph the chromosomes and arrange them in the form of a karyogram (Figure 3.7).
Molecular Cytogenetics
Fluorescent In-Situ Hybridization
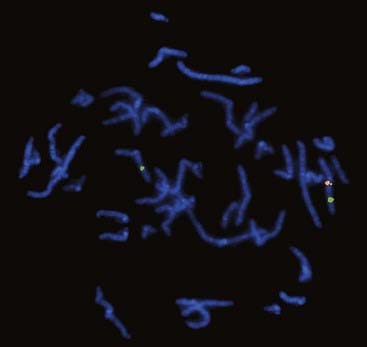
This diagnostic tool combines conventional cytogenetics with molecular genetic technology. It is based on the unique ability of a portion of single-stranded DNA (i.e., a probe; see p. 35) to anneal with its complementary target sequence on a metaphase chromosome, interphase nucleus or extended chromatin fiber. In fluorescent in-situ hybridization (FISH), the DNA probe is labeled with a fluorochrome which, after hybridization with the patient’s sample, allows the region where hybridization has occurred to be visualized using a fluorescence microscope. FISH has been widely used for clinical diagnostic purposes during the past 15 years and there are a number of different types of probes that may be employed.
Different Types of FISH Probe
Centromeric probes
These consist of repetitive DNA sequences found in and around the centromere of a specific chromosome. They were the original probes used for rapid diagnosis of the common aneuploidy syndromes (trisomies 13, 18, 21; see p. 274) using non-dividing cells in interphase obtained from a prenatal diagnostic sample of chorionic villi. In the present, quantitative fluorescent polymerase chain reaction is more commonly used to detect these trisomies.
Chromosome-specific unique-sequence probes
These are specific for a particular single locus. Unique-sequence probes are particularly useful for identifying tiny submicroscopic deletions and duplications (Figure 3.8). The group of disorders referred to as the microdeletion syndromes are described in Chapter 18. Another application is the use of an interphase FISH probe to identify HER2 overexpression in breast tumors to identify patients likely to benefit from Herceptin treatment.
Telomeric probes
A complete set of telomeric probes was been developed for all 24 chromosomes (i.e., autosomes 1 to 22 plus X and Y). Using these, a method has been devised that enables the simultaneous analysis of the subtelomeric region of every chromosome by means of only one microscope slide per patient. This proved to be a useful technique for identifying tiny ‘cryptic’ subtelomeric abnormalities, but has largely been replaced with a quantitative polymerase chain reaction method, multiplex ligation-dependent probe amplifications, that simultaneously measures dosage for all the subtelomeric chromosome regions.
Whole-Chromosome paint probes
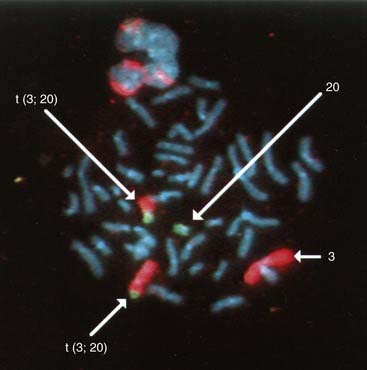
These consist of a cocktail of probes obtained from different parts of a particular chromosome. When this mixture of probes is used together in a single hybridization, the entire relevant chromosome fluoresces (i.e., is ‘painted’). Chromosome painting is extremely useful for characterizing complex rearrangements, such as subtle translocations (Figure 3.9), and for identifying the origin of additional chromosome material, such as small supernumerary markers or rings.
Comparative Genomic Hybridization
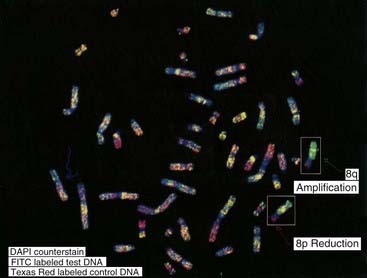
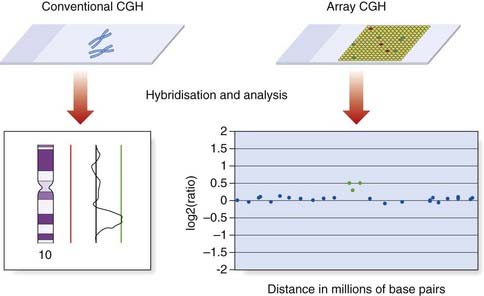
Comparative genomic hybridization (CGH) was originally developed to overcome the difficulty of obtaining good-quality metaphase preparations from solid tumors. This technique enabled the detection of regions of allele loss and gene amplification (p. 220). Tumor or ‘test’ DNA was labeled with a green paint, and control normal DNA with a red paint. The two samples were mixed and hybridized competitively to normal metaphase chromosomes, and an image captured (Figure 3.10). If the test sample contained more DNA from a particular chromosome region than the control sample, that region was identified by an increase in the green to red fluorescence ratio (Figure 3.11). Similarly a deletion in the test sample was identified by a reduction in the green to red fluorescence ratio.
Array CGH
Cytogenetic techniques are traditionally based on microscopic analysis. However, the increasing application of microarray technology is also having a major impact on cytogenetics. Although array CGH is a molecular biology technique, it is introduced in this chapter because it has evolved from metaphase CGH and is being used to investigate chromosome structure.
Array CGH also involves the hybridization of patient and reference DNA, but metaphase chromosomes are replaced as the target by large numbers of DNA sequences bound to glass slides (Figure 3.11). The DNA target sequences have evolved from mapped clones (yeast artificial chromosome [YAC], bacterial artificial chromosome [BAC], or P1-derived artificial chromosome [PAC] or cosmid), to oligonucleotides. They are spotted on to the microscope slides using robotics to create a microarray, in which each DNA target has a unique location. Following hybridization and washing to remove unbound DNA, the relative levels of fluorescence are measured using computer software. Oligonucleotide arrays provide the highest resolution and can include up to 1 million probes.
Chromosome Nomenclature
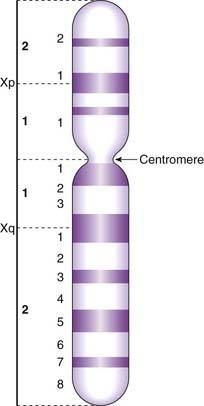
By convention each chromosome arm is divided into regions and each region is subdivided into bands, numbering always from the centromere outwards (Figure 3.12). A given point on a chromosome is designated by the chromosome number, the arm (p or q), the region, and the band (e.g., 15q12). Sometimes the word region is omitted, so that 15q12 would be referred to simply as band 12 on the long arm of chromosome 15.
A shorthand notation system exists for the description of chromosome abnormalities (Table 3.2). Normal male and female karyotypes are depicted as 46,XY and 46,XX, respectively. A male with Down syndrome as a result of trisomy 21 would be represented as 47,XY,+21, whereas a female with a deletion of the short arm of one number 5 chromosome (cri du chat syndrome; see p. 281) would be represented as 46,XX,del(5p). A chromosome report reading 46,XY,t(2;4)(p23;q25) would indicate a male with a reciprocal translocation involving the short arm of chromosome 2 at region 2 band 3 and the long arm of chromosome 4 at region 2 band 5.
| Term | Explanation | Example |
|---|---|---|
| p | Short arm | |
| q | Long arm | |
| cen | Centromere | |
| del | Deletion | 46,XX,del(1)(q21) |
| dup | Duplication | 46,XY, dup(13)(q14) |
| fra | Fragile site | |
| i | Isochromosome | 46,X,i(Xq) |
| inv | Inversion | 46XX,inv(9)(p12q12) |
| ish | In-situ hybridization | |
| r | Ring | 46;XX,r(21) |
| t | Translocation | 46,XY,t(2;4)(q21;q21) |
| ter | Terminal or end |
