Chapter 11 Central Nervous System Monitoring
Nearly half of the 1 million patients undergoing cardiac surgery each year worldwide will likely experience persistent cognitive decline.1 The direct annual cost to U.S. insurers for brain injury from just one type of cardiac surgery, myocardial revascularization, is estimated at $4 billion. Furthermore, the same processes that injure the central nervous system (CNS) also appear to cause dysfunction of other vital organs. Thus, there are enormous clinical and economic incentives to improve CNS protection during cardiac surgery.
Technical developments have begun to alter this perception. First, CNS injuries still occur despite reductions in aortic manipulation with the new approaches to coronary artery bypass and aortic surgery.2 Second, neurophysiologic studies have implicated hypoperfusion and dysoxygenation as major causative factors in CNS injury (Box 11-1). Because these functional disturbances are often detectable and correctable there is an impetus to examine the role of neurophysiologic monitoring in CNS protection.
ELECTROENCEPHALOGRAPHY
First, small, practical, and affordable EEG monitors have only recently become available.
Physiologic Basis of Electroencephalography
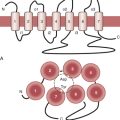
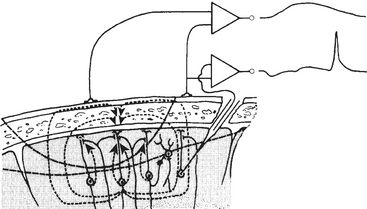
EEG-directed interventions designed to correct cerebral hypoperfusion during cardiac surgery require an appreciation of the underlying neurophysiologic substrate. Scalp-recorded EEG signals reflect the temporal and spatial summation of long-lasting (10 to 100 ms) postsynaptic potentials, which arise from columnar cortical pyramidal neurons (Fig. 11-1).
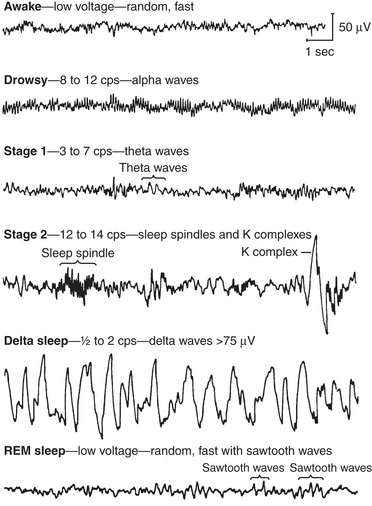
EEG rhythms represent regularly recurring waveforms of similar shape and duration. These signal oscillations depend on the synchronous excitation of a neuronal population. The descriptive nature of conventional EEG characterizes the oscillations (measured in cycles per second [cps] or Hertz [Hz]) as sinusoids that were classified according to their amplitude and frequency. The terminology used to describe the frequency bands of the most common oscillatory patterns is illustrated in Figure 11-2 and listed in Box 11-2.
BOX 11-2 EEG Frequency Bands
| Delta | 0.5 to 2 Hz |
| Theta | 3 to 7 Hz |
| Alpha | 8 to 12 Hz |
| Beta | 13 to 24 Hz |
| Gamma | 25 to 55 Hz |
Practical Considerations of Electroencephalographic Recording and Signal Processing
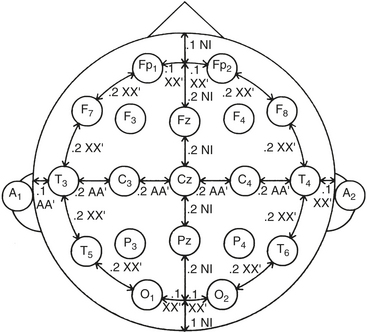
Standardized electrode placement is based on the International 10-20 System (Fig. 11-3). It permits uniform spacing of electrodes, independent of head circumference, in scalp regions known to correlate with specific areas of cerebral cortex. Four anatomic landmarks are used: the nasion, inion, and preauricular points.
Display of Electroencephalographic Information
Time-Domain Analysis
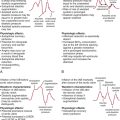
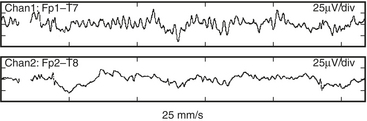
Both EEG diagnostic and monitoring interpretations are based, in part, on the “Law of the EEG” (Box 11-3). It states that amplitude and dominant frequency are inversely related. Simultaneous decreases in both amplitude and frequency may indicate ischemia or anoxia (Fig. 11-4).
Frequency Domain Analysis
An alternative method, frequency domain analysis, is exemplified by the prismatic decomposition of white light into its component frequencies (i.e., color spectrum). As the basis of spectral analysis, the Fourier theorem states that a periodic function can be represented, in part, by a sinusoid at the fundamental frequency and an infinite series of integer multiples (i.e., harmonics). The Fourier function at a specific frequency equals the amplitude and phase angle of the associated sinusoid. Graphs of amplitude and phase angle as functions of frequency are called Fourier spectra (i.e., spectral analysis). The EEG amplitude spectral scale (Fig. 11-5) squares voltage values to eliminate troublesome negative values. Squaring changes the unit of amplitude measure from microvolts to either picowatts (pW) or nanowatts (nW). However, a power amplitude scale tends to overemphasize large-amplitude changes. Clinically important changes in lower amplitude components that are readily discernible in the linearly scaled unprocessed EEG waveform may become invisible in power spectral displays.
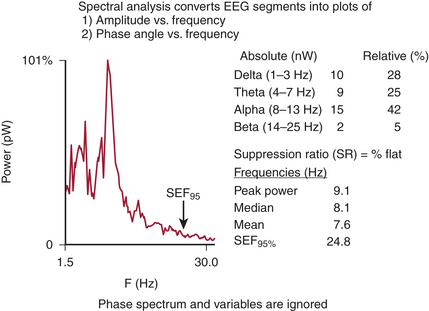
The most widely used univariate frequency descriptors are (1) peak power frequency (the single frequency of the spectrum that contains the highest amplitude) (Box 11-4), (2) median power frequency (frequency below which 50% of the spectral power occurs), (3) mean spectral frequency (sum of power contained at each frequency of the spectrum times its frequency divided by the total power), (4) spectral edge frequency (SEF; frequency below which a predetermined fraction, usually 95%, of the spectral power occurs), and (5) suppression ratio (SR; percent of flat-line EEG contained within sampled epochs).
Pronk evaluated computer-processed univariate descriptors of EEG changes occurring before, during, and after CPB.3 Mean spectral frequency alone was sufficient to adequately describe all EEG changes except those occurring at very low amplitudes. Addition of a single-amplitude factor improved agreement with visual interpretation to 90%. Further factor addition did not improve agreement.
Multivariate (i.e., composed of several variables) descriptors have been developed to improve simple numeric characterization of clinically important EEG changes. With this approach, algorithms are used to generate a single number that represents the pattern of amplitude-frequency-phase relationships occurring in a single epoch. Several commercially available monitors provide unitless numbers that have been transformed to an arbitrary 0-to-100 scale. Each monitor provides a different probability estimate of patient response to verbal instruction. Current examples of these descriptors include the bispectral index (BIS), the patient state index (PSI), and spectral entropy.4,5 BIS and PSI are empirically derived proprietary indices developed from proprietary patient databases. In contrast, spectral entropy is neither empirical nor proprietary but rather represents the novel application of long-established physical sciences entropy equations to the analysis of cranial biopotentials. Each product is designed to require the use of proprietary self-adhesive forehead sensors. Collectively, these products are now in widespread use as objective measures of hypnotic effect (Box 11-5).
Most hypnotics decrease EEG complexity (i.e., variability) in a dose-related fashion. This long-established observation provides the rationale for the use of nonproprietary spectral entropy analysis as an objective measure of hypnotic effect.6 The absence of an empiric rule-based approach avoids the need for arbitrary weighting coefficients and minimizes the potentially distorting influences of very low- and very high-amplitude EEG signals.
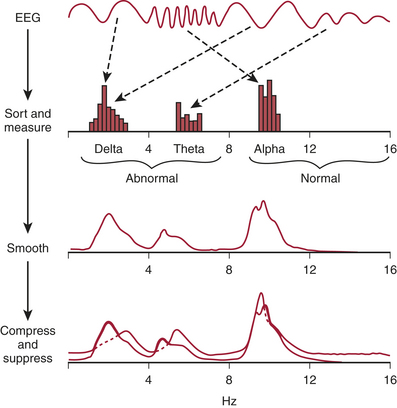
With CSA (Fig. 11-6), successive power spectra of brief (2- to 60-second) EEG epochs are displayed as smoothed histograms of amplitude as a function of frequency. Spectral compression is achieved by partially overlaying successive spectra, with time represented on the z-axis. Hidden-line suppression improves clarity by avoiding overlap of successive traces. Although the display is aesthetically attractive, it has limitations. The extent of data loss due to spectral overlapping depends on the nonstandard axial rotation that varies among EEG monitors.
An alternative to the CSA display to reduce data loss is the density-modulated spectral array (DSA) that uses a two-dimensional dot matrix plot of time as a function of frequency (Fig. 11-7). The density of dots indicates the amplitude at a particular time-frequency intersection (e.g., an intense large spot indicates high amplitude). Clinically significant shifts in frequency may be detected earlier and more easily than with CSA.
In summary, a quick assessment of EEG change in either the time or frequency domain focuses on (1) maximal peak-to-peak amplitude, (2) relation of maximal amplitude to dominant frequency, (3) amplitude and frequency variability, and (4) new or growing asymmetry between homotopic (i.e., same position on each cerebral hemisphere) EEG derivations. These objectives are generally best achieved through the viewing of both unprocessed and processed displays with a clear understanding of the characteristics and limitations of each (Box 11-6).
Electroencephalography for Injury Prevention during Cardiac Surgery
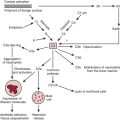
There is normally a tight coupling among cerebral cortical synaptic activity, metabolism, and blood flow. Such coupling is necessary because of the large energy requirements of interneuronal communication. Indeed, at least 60% of neuronal oxygen and glucose is consumed in the processes of synaptic and axonal transmission, whereas the remainder is used to maintain cellular integrity. Neurons rapidly adjust their signaling capabilities to conserve vital energy stores. Even a slight new imbalance between supply and consumption of energy substrates is manifested by altered synaptic activity. The EEG provides a sensitive measure of this synaptic change and represents an early warning of developing injury. Identification and correction of the physiologic imbalance may then avert serious injury (Box 11-7).
Head Position
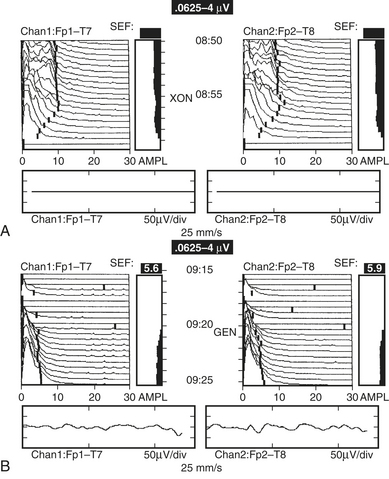
Because of the diffuse nature of atherosclerotic vascular disease, many elderly patients are at increased risk for positional focal or regional cerebral ischemia that may occur before incision. Head rotation for surgical positioning or insertion of a pulmonary artery catheter may compress a vital carotid or vertebral artery. Such ischemia is generally identified by marked depression in the affected frontotemporal EEG derivation (Fig. 11-8).
Vascular Obstruction and Flow Misdirection
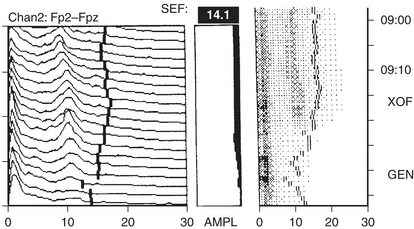
Manipulation or torsion of the aorta or vena cava may result in regional or global cerebral ischemia. During CPB, the aortic cannula can misdirect either cardiac or pump flow away from one or more head vessels while leaving the radial artery pressure unaltered. Alternatively, a malpositioned venous cannula may impair return from the head without noticeable change in central venous pressure or return flow to the venous reservoir. Resulting intracranial hypertension leads to ischemic depression of the EEG (Fig. 11-9).
Cooling
As nasopharyngeal or tympanic temperature decreases to 28°C (Fig. 11-10), there is a gradual loss of absolute spectral power across all frequency bands. Although the reversible decreases in absolute spectral band power are quite large, computing these changes as relative spectral band power minimizes these changes, suggesting that initial brain cooling exerts a similar decrease in spectral power across all frequency bands and cortical regions.7 Cooling below 28°C leads to progressive slowing of the residual EEG until the EEG waveform becomes a flat line.
Myocardial Revascularization without Extracorporeal Support
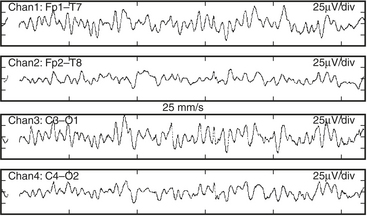
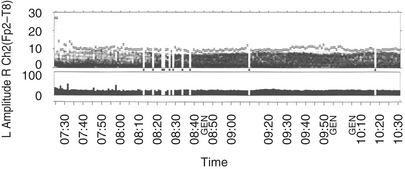
The most recent significant advance in cardiac surgery has been myocardial revascularization on a beating heart. Avoidance of CPB may protect patients from the many potential hazards of this nonphysiologic insult. In addition, its potential economic advantages promise widespread application. Figure 11-11 illustrates the typical remarkable stability of the EEG during a beating heart coronary revascularization despite transient hypotension and bradycardia.
Seizure Detection
Certain anesthetics and adjuvants such as etomidate, enflurane, sevoflurane, and the opioid analgesics may produce seizure-like EEG activity, although the clinical manifestations may be obscured by neuromuscular blockade. Perioperative EEG seizure activity in infant cardiac surgery patients was associated with a 10-point decline in expected intelligence quotient when subsequently measured in the patients’ fifth year after surgery (Box 11-8).
AUDITORY EVOKED POTENTIALS
The specific benefit of AEPs to cardiac surgery derives from their temperature sensitivity, because cooling slows both axonal conduction and synaptic transmission. A decrease of tympanic or nasopharyngeal temperature from 35° to 25°C doubles wave V latency. Further cooling will eventually suppress waves III to V completely, signifying the virtual elimination of synaptic transmission within the brainstem auditory circuits. Brainstem AEPs (BAEPs) document complete deep hypothermic electrocerebral silence before temporary circulatory arrest.8
The critical protective action of hypothermia on the brain cannot be accurately assessed by thermometry because of marked individual differences in thermal compartmentation throughout the body. Even within the brain, cooling technique (e.g., rapid vs. slow, alpha-stat vs. pH-stat acid-base balance, α-adrenergic blockade vs. none) may result in substantial thermal inhomogeneity within the cerebrum. Therefore, hypothermia-induced electrocortical silence (i.e., flat EEG) does not necessarily indicate cessation of synaptic activity within deep brain structures. The high metabolic rates of some of these structures (e.g., basal ganglia and inferior colliculus) render them particularly vulnerable to ischemic injury. EEG quiescence plus a loss of BAEP waves III to V ensures thorough cooling of the brain core. This approach appears to offer an optimal neuroprotective environment during temporary cessation of cerebral perfusion (Box 11-9).
TRANSCRANIAL DOPPLER ULTRASONOGRAPHY
Ultrasound Technology
Pulsed-Wave Spectral Display
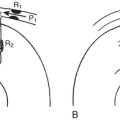
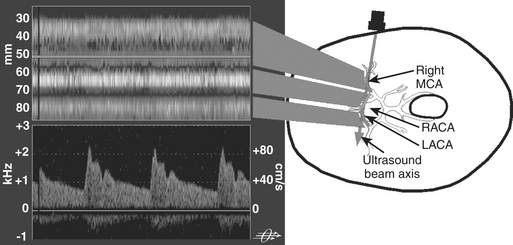
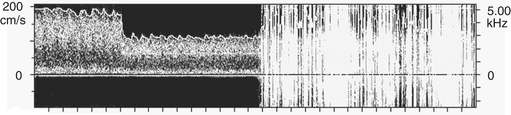
Pulsed-wave Doppler samples the ultrasonic echoes at a user-selected distance (i.e., single gate) below the scalp. The frequency composition of these Doppler-shifted echoes is analyzed by Fourier analysis, the same technique used to quantify EEG frequency patterns. The analysis produces a momentary amplitude spectrum displayed as a function of blood flow velocity (e.g., Doppler-shift frequency). This relationship is mapped as one vertical strip in the spectrogram display (Fig. 11-12). Amplitude at each frequency is expressed as log change (i.e., dB) from the background composed of random echoes. The momentary analysis is repeated 100 times a second to produce a scrolling spectrogram of time-related changes in flow velocity.
Clinical Basis for Intervention
Before Cardiopulmonary Bypass
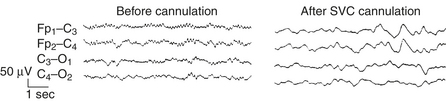
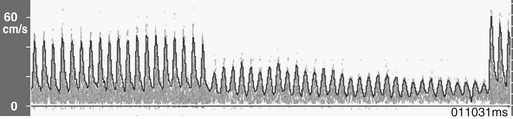
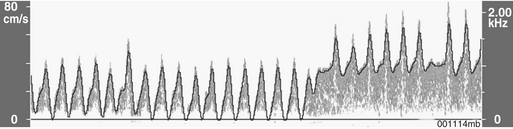
Transcranial Doppler ultrasonography provides cerebral hemodynamic information for the timely detection and correction of perfusion abnormalities that may occur prior to the onset of CPB (Box 11-10). Vascular torsion during neck extension or axial head rotation may result in regional cerebral hypoperfusion detectable by TCD. Excessive hyperventilation may result in inadvertent cerebral ischemia, because blood flow falls by 4%/mm Hg PaCO2 in normally reactive cerebral arteries. Cerebral dysautoregulation is often seen in hypertensive and diabetic patients. This abnormality may result in pressure-dependent brain perfusion and place the patient at risk for ischemic brain injury during even moderate hypotension. TCD may be used to identify pressure dependency and facilitate appropriate individualization of acceptable perfusion pressure. Detection of malpositioned aortic or superior vena caval perfusion cannula is rapidly achieved with TCD monitoring. In the former case, the malposition results in a sudden profound decrease in the peak systolic velocity, whereas in the latter, diastolic velocity is compromised (Figs. 11-13 and 11-14).
During Cardiopulmonary Bypass
Transcranial Doppler imaging is the only available method to continuously assess changes in cerebral hemodynamics associated with CPB. Despite the confounding influences of hemodilution, altered acid-base management, and cooling on absolute flow velocity, TCD nevertheless indicates the presence and direction of cerebral blood flow. A sudden large decrease, increase, or asymmetry indicates, respectively, inadvertent occlusion of a great vessel, hyperperfusion of a single cranial artery, or misdirection of aortic cannula flow. During surgical repair of the aortic arch, TCD documents cerebral artery flow direction during attempts at supplemental retrograde or antegrade (Fig. 11-15) cerebral perfusion during systemic circulatory arrest.9 Because peak velocity changes in large basal cerebral arteries are directly related to peak flow changes, TCD may aid in the determination of safe upper and lower limits for pump flow and perfusion pressure. Deep cooling and circulatory arrest may produce a transient cerebral vasoparesis and result in uncoupling of cerebral blood flow and metabolism. TCD identifies this phenomenon as an unchanging flow velocity during rewarming. Emboli detection by TCD can improve surgical and perfusion technique and facilitate correction of technical problems such as an air leak10 (Box 11-11).
CEREBRAL OXIMETRY
Near-Infrared Technology
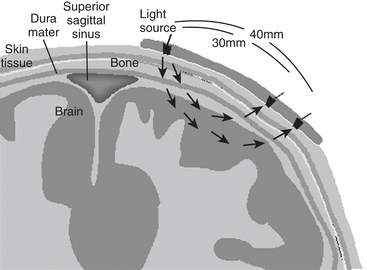
Intravascular regional hemoglobin oxygen saturation (rSo2) may be measured noninvasively with transcranial near-infrared spectroscopy (NIRS) because the human skull is translucent to infrared light. An infrared light source contained in a self-adhesive patch affixed to glabrous skin of the scalp transmits photons through underlying tissues to the outer layers of the cerebral cortex. Adjacent sensors separate photons reflected from the skin, muscle, skull, and dura from those of the brain tissue (Fig. 11-16). Transcranial NIRS measures all hemoglobin, not just the pulsatile arterial component contained in a mixed vascular bed primarily composed of gas-exchanging vessels, venules in particular.11 The measurement is thought to reflect 16% arterial and 84% venous contributions. This ratio remains nearly constant in normoxia, hypoxia, and hypocapnia. Cerebral oximetry appears to both reliably quantify change from an individualized baseline and offer an objective measure of regional hypoperfusion. Unlike pulse and jugular bulb oximetry, respectively, cerebral oximetry may be used during nonpulsatile CPB and circulatory arrest.
Validation
The rSo2 value has been validated from arterial and jugular bulb oxygen saturation measurements in pediatric and adult subjects.12 In these studies, hypoxemia involving cerebral tissue proximate to the sensors was consistently detected by this technology. Except during ischemia and CPB, SjVo2 and rSo2 generally correlate in the midrange saturation, although discrepancies may appear at the extremes. The validity of rSo2 also has been assessed by comparison with direct microprobe measurement of brain tissue oxygen partial pressure (tPO2). Reasonable agreement between these two measures has been found in neurosurgical patients.
Intervention Threshold
There is substantial agreement among investigators attempting to define an rSo2 ischemic/hypoxic threshold. Desaturation of greater than 10 scale units below baseline or an absolute value below 50 was associated with decreased somatosensory evoked potential amplitude after carotid occlusion during carotid endarterectomy performed under general anesthesia. With regional anesthesia and cerebral oximeter monitoring, patients with clamp-related transient neurologic deficits had decreases in rSo2 from 27% to 31% below preclamp values. Symptoms and desaturation resolved with shunt insertion or blood pressure increase. Carotid occlusion associated with neurologic symptoms of regional ischemia resulted in an average 20% decline in rSo2 below the preocclusion baseline, whereas only a 9% decline was seen in asymptomatic patients. Using the criterion of a 20% rSo2 decline to predict clinical signs of ischemia, there was a 2.6% false-negative rate, with a sensitivity of 80% and specificity of 82%. The use of a 20% rSo2 decrease as an ischemic threshold for carotid endarterectomy compares favorably with that observed during syncope induced in conscious patients or subjects by implantable cardioverter/defibrillator testing, tilt-table testing, balloon occlusion of the internal carotid artery, and negative gravitational force testing.13
An alternative basis for an ischemic threshold is a fixed rSo2 value. The increased simplicity must be weighed against the likelihood of decreased sensitivity and specificity. Nevertheless, decreases of rSo2 below 50, even for brief intervals, are associated with significant increases in cognitive or neurologic injury, length of critical care or total hospital stay, and hospital charges. In practice, either approach may be suitable because a 20% decline from the normative mean rSo2 of 67 would be 53, close to the fixed threshold of 50. Using either criterion, patient management could be adjusted to prevent further desaturation (Box 11-12).
Intervention Rationale
Baseline rSo2
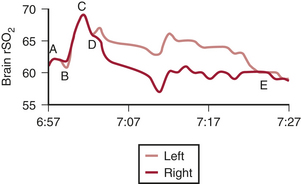
Surgical cerebral oximetric monitoring should be initiated immediately after patient entry to the operating room. Self-adhesive patches containing the infrared light source with shallow (proximate) and deep (distant) sensors are fixed on the forehead on both sides of the midline. The initial objective is the establishment of a reference baseline before preoxygenation and anesthetic induction (Fig. 11-17).
A high cerebral metabolic demand for oxygen may result in abnormally low rSo2 values despite normal pulse oximetry readings. For example, the cerebral oximeter detected oxygen imbalance during high-altitude trekking that was unrecognized by pulse oximetry. Similarly, patients in heart failure often have preoperative baseline values far below the normative range.14 Abnormally high rSo2 values may signify a silent infarction, because injured or dead neurons consume little oxygen. Abnormal (>10 scale units) right-left rSo2 may be caused by unrecognized carotid or intracranial arterial stenosis, intracranial space-occupying lesion, old infarction, skull defect, or extracranial sources such as a hemangioma, sinusitis, or artifactual interference from an infrared-emitting device. An asymmetry or abnormal rSo2 baseline, high or low, alerts the operative team to the increased potential for cerebral oxygen imbalance during surgical challenge and may alter the plan of anesthetic management.
Developing rSo2 Asymmetry
A new asymmetry, signifying cerebral dysoxygenation, may develop quickly during anesthetic induction, pulmonary artery catheter insertion, or final patient positioning. During head rotation, rSo2 may decrease contralateral to a stenotic carotid artery.15 Axial head rotation displaces the lateral mass of the contralateral atlas forward behind the internal carotid artery, just below its entrance into the carotid canal at the skull base. If this process is prolonged or if the artery is adherent to adjacent tissue, it can be compressed from behind, resulting in decreased flow. Furthermore, volatile anesthetics may interfere with the regulatory mechanisms that normally maintain effective cerebral perfusion bilaterally during head rotation in conscious patients.
Fukada and coworkers reported cerebral oximetric detection and successful correction of a malperfusion syndrome during acute type A aortic dissection repair.16 Although parallel recording of radial and femoral arterial pressures is widely used to detect malperfusion, no pressure difference was seen in this case owing to maintenance of perfusion in the leftmost arch branch. Malperfusion-related cerebral ischemia may often be identified by EEG or somatosensory evoked potentials, but these signals are susceptible to compromise by electrocautery, deep anesthesia, and hypothermia. Cerebral oximetry is also used during extracorporeal membrane oxygenation to detect regional deficiencies in brain perfusion associated with carotid cannulation.
rSo2 Responsiveness to CO2
Acid-base management during CPB remains controversial, particularly during deep cooling. Some propose that the higher CO2 tension afforded by pH-stat acid-base management results in fewer neurologic complications. Vijay and colleagues observed that during adult near-normothermic myocardial revascularization, vasopressor-induced perfusion pressure increases alone were sometimes inadequate to correct decreased rSo2 occurring during CPB. In this situation, judiciously applied permissive hypercapnia often was effective in restoring rSo2 to baseline.17
Despite these seeming benefits, hypercapnia has potentially deleterious effects. Hypercapnia-induced cardiac output and heart rate also increase myocardial oxygen demand, whereas cerebral vasodilation may exacerbate preexisting intracranial hypertension. Cerebral oximetry provides a convenient method to document appropriate bihemispheric CO2 reactivity (Box 11-13). In addition, continuous measurement of brain oxygen saturation permits CO2 titration to achieve optimal tissue perfusion at the lowest risk. Individualized management of CO2 tension facilitated by cerebral oximetry enhances the opportunity for anesthesia providers and perfusionists to positively affect the outcome of cardiovascular surgery.
NEUROMONITORING AND OUTCOME
Outcome studies of EEG monitoring primarily have concentrated on process variables, describing occurrences of ischemic EEG changes and their possible association with neurologic complications. To date, the results of only one adequately powered prospective randomized study on EEG clinical and economic benefit have been published. Myles and associates demonstrated a significant 82% decrease in awareness with BIS monitoring. This finding replicated the results of a large nonrandomized study, which showed that BIS monitoring was associated with a 78% decrease in awareness. Both these results are consistent with a number of smaller, nonrandomized studies.18,19
There are two outcome studies that have examined the impact of multimodality neuromonitoring using a combination of EEG, TCD, and cerebral oximetry20,21 (Fig. 11-18). Both found a 2.7-day reduction in length of stay associated with multimodality neuromonitoring. The study of Edmonds also noted an 11% reduction in hospital expenses.20 In addition to the substantial reductions in hospital stay, charges, and neurologic complications, the results suggested possible benefit to other vital organ systems. This finding is not unexpected because the same processes that injure the brain may also injure other organs. Future studies of neuromonitoring efficacy should not overlook these important accessory benefits. In addition, Lozano and Mossad reviewed studies of neuromonitoring during pediatric cardiac surgery and showed that the monitoring was associated with enhanced outcomes (Table 11-1).22
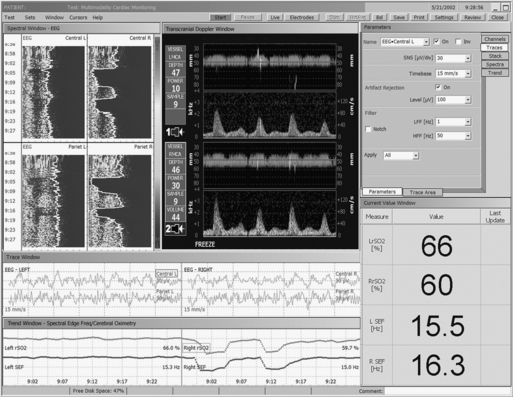
Table 11-1 Multimodality Neuromonitoring for Cardiac Surgery
| Modality | Function |
|---|---|
| Electroencephalography | Cortical synaptic activity |
| Middle latency auditory evoked potentials | Subcortical-cortical activity |
| Brainstem auditory evoked potentials | Brainstem synaptic activity |
| Transcranial Doppler | Blood flow change and emboli |
| Cerebral oximetry | Cortical oxygen balance |
SUMMARY
1. Newman M.F., Kirchner J.L., Phillips-Bute B., et al. Longitudinal assessment of neurocognitive function after coronary artery bypass surgery. N Engl J Med. 2001;344:395.
2. Kilo J., Dzerny M., Gorlitzer M., et al. Cardiopulmonary bypass affects cognitive brain function after coronary artery bypass grafting. Ann Thorac Surg. 1926;72:2001.
3. Pronk R.A.F. EEG Processing in Cardiac Surgery. Utrecht, Inst Med Physics TNO. 1982.
4. Gugino L.D., Chabot R.J., Prichep L.S.D., et al. Quantitative EEG changes associated with loss and return of consciousness in healthy adult volunteers anaesthetized with propofol or sevoflurane. Br J Anaesth. 2001;87:421.
5. Vakkuri A., Yli-Hankala A., Talja P., et al. Time-frequency balanced spectral entropy as a measure of anesthetic effect in central nervous system during sevoflurane, propofol, and thiopental anesthesia. Acta Anaesthesiol Scand. 2004;48:145.
6. Viertiö-Oja H., Maja V., Särkelä M., et al. Description of the Entropy™ algorithm as applied in the Datex-Omeda S/5™ Entropy Module. Acta Anaesthesiol Scand. 2004;48:154.
7. Gugino L.D., Chabot R.J., Aglio L.S., et al. QEEG changes during cardiopulmonary bypass: Relationship to postoperative neuropsychological function. Clin Electroencephalogr. 1999;30:53.
8. Kumar A., Bhattacharya A. Evoked potential monitoring in anaesthesia and analgesia. Anaesthesia. 2000;55:225.
9. Gugino L.D., Aglio L.S., Edmonds H.L.Jr. Neurophysiological monitoring in vascular surgery. Bailliere’s Clin Anaesth. 2000;14:17.
10. Edmonds H.L.Jr. Emboli and renal dysfunction in CABG patients [editorial]. J Cardiothorac Vasc Anesth. 2004;18:545.
11. Watzman H.M., Kurth C.D., Montenegro L.M., et al. Arterial and venous contributions to near-infrared cerebral oximetry. Anesthesiology. 2000;93:947.
12. Pigula F.A., Siewers R.D., Nemoto E. Hypothermic cardiopulmonary bypass alters oxygen/glucose uptake in the pediatric brain. J Thorac Cardiovasc Surg. 2001;121:366.
13. Monk T.G., Reno K.A., Olsen B.S., et al. Postoperative cognitive dysfunction is associated with cerebral oxygen desaturations. Anesthesiology. 2000;93:A167.
14. Madsen P.L., Nielsen H.B., Christiansen P. Well-being and cerebral oxygen saturation during acute heart failure in humans. Clin Physiol. 2000;20:158.
15. Bar-Yosef S., Sanders E.G., Grocott H.P. Asymmetric cerebral near-infrared oximetric measurements during cardiac surgery. J Cardiothorac Vasc Anesth. 2003;17:773.
16. Fukada J., Morishita K., Kawaharada N. Isolated cerebral perfusion for intraoperative cerebral malperfusion in type A aortic dissection. Ann Thorac Surg. 2003;75:266.
17. Vijay V., McCusker K., Stasko A., et al. Cerebral oximetry-directed permissive hypercapnia enhances cerebral perfusion during CPB for heart failure surgery. Heart Surg Forum. 2003;6:205.
18. Myles P.S., Leslie K., McNeil J., et al. Bispectral index monitoring to prevent awareness during anesthesia: The B-Aware randomized controlled trial. Lancet. 2004;363:1757.
19. Ekman A., Lindholm M.-L., Lenmarken C., et al. Reduction in the incidence of awareness using BIS monitoring. Acta Anaesthesiol Scand. 2004;48:20.
20. Edmonds H.L.Jr. Multi-modality neurophysiologic monitoring for cardiac surgery. Heart Surg Forum. 2002;5:225.
21. Laschinger J., Razumovsky A.Y., Stierer K.A., et al. Cardiac surgery: Value of neuromonitoring. Heart Surg Forum. 2003;6:204.
22. Lozano S., Mossad E. Cerebral function monitors during pediatric cardiac surgery: Can they make a difference. J Cardiothorac Vasc Anesth. 2004;18:645.