CHAPTER 7 Cellular Mechanisms of Brain Energy Metabolism
Brain Work Supports Information Processing
The minimum energy cost of binary operations can be calculated from the decline in entropy, which happens only by means of an energy supply. The value must be compared with the actual cost of implementing the mechanical operation. These comparisons suggest that the cost of mechanical implementation of the binary operations in the brain is at least 9 orders of magnitude greater than the cost of the logical operation, which may be as low as 5 × 10⁻²¹ J.1 In contrast, Laughlin and colleagues2 and Abshire and Andreou3 reported that a single binary operation of the blowfly retina requires a minimum energy supply of 2 to 20 × 10−12 J. This is 9 orders of magnitude greater, thus suggesting that the cost of the logical operation is negligible.
Brain Work Maintains Ion Concentrations
It is not known how much of the ATPase activity that fuels the dynamic transfer and processing of information is necessary to keep the cells intact at the resting steady state and poised and ready for increased functional activity. Several lines of evidence suggest that the ATPase activity associated with the functional activity of information transfer varies from a value that is no more than twice the absolute minimum required to maintain cellular integrity to a value that is an order of magnitude greater. Whether the actual changes in information transfer are reflected in proportional changes in energy turnover is not known; however, it appears that energy turnover is generally maintained at specific thresholds associated with major categories of functional activity (see Fig. 7-1 later) rather than being coupled to the moment-to-moment fluctuations in brain function, with minimal variation in the energy turnover rate in response to the fluctuating functional contingencies of each category. This description introduces the concept of a “subliminal” fringe of membrane potential difference that is maintained just below the level required to initiate the exchange of nerve impulses among neurons. This means that the actual initiation and regulation of impulse activity can take place with very little change in the energy turnover rate. Consistent with this is the small cost of the logical element of a binary operation when the mechanical part of the operation is poised very close to the all-or-none position of the switch, as well as measurements of brain states’ influence on the generation of impulses among neurons.4
The impulses that neurons exchange are known as action potentials. The classic “sodium theory” explains both the origin of the membrane potential and the graded or alternating depolarization of cells induced by the presence of sodium, calcium, potassium, and chloride equivalents as free ions in the intracellular and extracellular spaces, as well as the action on and the action of specific ion channels in the plasma membranes across which the ions move.5 The membrane potential differences are diffusion potentials established by the membrane conductances controlled by the channels that determine the ion permeabilities. The conductances of sodium and potassium associated with the resting membrane potential and the increased conductances associated with excitation above a baseline or a resting or “default” average are matched by the active ion pumping that strives to maintain constant ion concentrations.
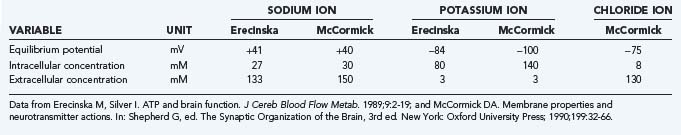
The plasma membrane, or P-type, Na+,K+-ATPase is the protein that enables transport of the major ions across the semipermeable membranes. The protein combines with ATP, magnesium (Mg2+), Na+, and K+ to form an enzyme-substrate complex in which the enzyme is phosphorylated and the Mg2+ ions and adenosine diphosphate (ADP) are released.6 As the phosphorylated enzyme splits into inorganic phosphate (Pi) and the original enzyme, Na+ and K+ ions are translocated in the appropriate directions, outward for sodium and inward for potassium. The energy released by the hydrolysis of ATP at a rate of, for example, 5 µmol/g per minute is sufficient to transport 15 µmol Na+ per gram per minute and 10 µmol K+ per gram per minute. In the steady state, a chloride flux matches the difference between the sodium and potassium fluxes and thus renders the total ion flux electroneutral. In steady-state conditions, the ion fluxes equal the diffusion rates in the opposite directions. The resulting half-life of sodium in the cells is less than a minute under normal circumstances.
The actual ion concentrations and the permeability of the membrane to the ions together determine the membrane potential difference. The average membrane potential approaches the potassium equilibrium potential. Intuitively, it makes sense that the potassium ion, which has greater permeability in the membrane, has the major influence on the sign and magnitude of the membrane potential difference. In the steady state, the apparent average potassium and sodium ion permeabilities, or the membrane permeability–surface area products, can be calculated from the potassium and sodium ion transport fluxes. The average ion concentrations vary among cells and tissue; typical values are listed in Table 7-1. Using the typical values of the average steady-state membrane potential difference, the potassium and sodium fluxes calculated from measured ATP turnover rates, and the 3:2 ratio between the net sodium and potassium fluxes in the steady state,7 the average permeability–surface area products of sodium, potassium, and chloride ions can be calculated by means of Goldman’s flux equation (Table 7-2).8,9 The calculation ignores the calcium ion flux, which represents only a small fraction of the total energy requirement, although it is of major functional significance.10
Brain Energy Metabolism Enables Brain Work
The exact mechanism that links the work performed by brain tissue and the rate of metabolism under steady-state conditions is unclear. When concentrations of metabolites by definition do not change in the steady state, it is hard to conceive of feedback signals that can provide the link. Noradrenaline and the transmitter vasoactive intestinal polypeptide (VIP), when mediated by accumulation of cyclic adenosine monophosphate, both promote glycogenolysis and mobilize glycogen in the cerebral cortex.11 Activation of metabotropic receptors also increases oxidative energy metabolism in brain tissue slices.12 This suggests that monoaminergic neuromodulation regulates both neuron excitability and the energy metabolic rates of glycolysis and oxidative phosphorylation. Because intracortical VIP neurons have a narrow field of action whereas there is wide intracortical expansion of noradrenergic fibers, the two systems may serve to focus the modulation: VIP regulates the energy metabolism locally, within individual cortical columns, and norepinephrine exerts an effect across multiple columns.13
Definition of Brain Activity Levels
Brain functions vary and brain activity varies with these functions. Internal brain states regulate sensory perception, sensorimotor coordination, and learning, as reflected in different patterns of cortical synchrony.4 However, in the presence of distinct brain states, it is unclear that the work and the energy turnover rates change in direct proportion to the functional activity. The definition of a baseline functional activity and the issue of the brain’s normal or average activity are debated. Recent descriptions of brain functional activity distinguish between activation, default, resting, and baseline states, but the definitions of these states are not yet universally understood or accepted.
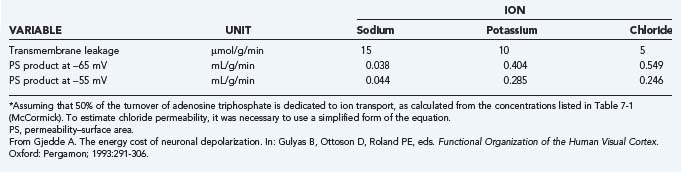
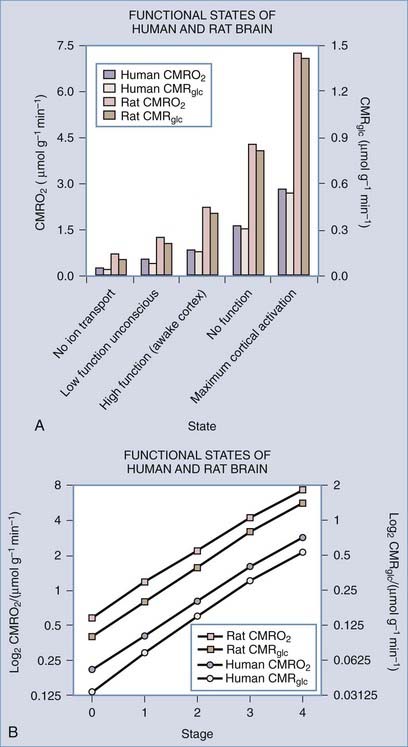
The issue hinges on the definitions of baseline and average functional activity in relation to the different rates of metabolism in these states. Work by Shulman and colleagues implies that steady-state functional activity is related to rates of release of the excitatory neurotransmitter glutamate and the linearly correlated rates of energy metabolism.14–17 In this work, the highest rates of glutamate release and energy metabolism are about twice the average rates observed in the resting awake or “default” state of these brains,18 which in turn are twice the rates observed in apparently unconscious but otherwise intact brains. These rates turn out to be about twice the rates associated with a completely inactive but intact baseline state, which in turn are about twice the rates associated with the state of absent ion transport. This state is not compatible with survival because the necessary ion gradients gradually dissolve.
Brain energy metabolism probably doubles for every categoric increment in functional activity, although within each brain, energy metabolism may be fairly constant (Fig. 7-1). By categoric increment is meant a change from one fundamental state of functional activity to the next. These stages are illustrated in Figure 7-1 and include the states of no ion transport (stage 0 or metabolic baseline), ion transport but no functional activity (stage 1 or functional baseline), low functional activity without consciousness (stage 2), normal functional activity with consciousness (stage 3 or default activity), and high functional activity associated with the highest level of physiologic activation (stage 4). Activity above stage 4 may be pathologic. Panel B shows that the metabolic or work rates associated with these stages can be described by the simple formula
(Data from studies of rat or human brain summarized by Shulman,16 Hyder,17 Gjedde,19 and their colleagues.)
where CMR is the cerebral metabolic rate, CMR(0) is the cerebral metabolic rate of stage 0, and S is one of the five functional stages (0 to 4) defined earlier. The equation has an interesting similarity to the formula (see earlier) for a system that holds S bits of information. It probably shows that distinct internal brain states dynamically regulate cortical membrane potential synchrony during behavior and define specific levels of cortical processing.4
Description of Brain Activity Stages
Metabolic and Nonfunctional Baselines (Stages 0 and 1)
It is likely that maintenance of the membrane potential makes the major contribution to brain energy utilization at the nonfunctional baseline (stage 1). The fraction of metabolism of isolated brain tissue associated with the transport of sodium and potassium is approximately half of the metabolism of the low functional state of isolated brain tissue.20 About half of the nonfunctional baseline remains when ion transport in isolated nervous tissue is blocked completely by inactivation of Na+,K+-ATPase.21–24
Low Functional State (Stage 2)
The unconscious baseline can be thought of as a state of lowered but not absent functional activity in which higher cognitive activity is not present. The state exists in conditions of severed cortical connections, coma, persistent vegetative state, or anesthesia. In these conditions, the metabolic rate is close to 50% of the normal resting awake or default average.25–33 Here, work is associated with lowered but not absent depolarization of neuronal membranes, and the rate of work is about half of the work imposed by the average degree of depolarization existing in the resting awake or default condition.
Normal (Default) and Physiologically Elevated Functional States (Stages 3 and 4)
The normal or default metabolic stage refers to the awake and normally functioning mammalian brain. This stage has been better studied in awake humans than in other mammals. Stage 3 metabolism refers more accurately to the cerebral cortex of a resting awake human being, whereas whole-brain values tend to represent a mixture of stage 2 and 3 metabolic states. Recent steady-state values for the human brain are listed in Table 7-3, together with the estimated steady-state turnover rates of ATP, pyruvate, and lactate.
TABLE 7-3 Average Properties of Human Whole Brain and Cerebral Cortex
| VARIABLE (UNIT) | WHOLE BRAIN | CEREBRAL CORTEX |
|---|---|---|
| CMRGlc (µmol/g/min) | 0.25 | 0.30 |
| CMRO2 (µmol/g/min) | 1.40 | 1.60 |
| CBF (mL/g/min) | 0.43 | 0.50 |
| OGI (ratio) | 5.6 | 5.3 |
| ATP turnover (JATP, µmol/g/min) | 6.25 | 7.5 |
| Pyruvate turnover (JPyr, µmol/g/min) | 0.5 | 0.6 |
| Lactate efflux (JLact, µmol/g/min) | 0.035 | 0.07 |
| LGI (ratio) | −0.14 | −0.23 |
ATP, adenosine triphosphate; CBF, cerebral blood flow; CMRGlc, cerebral metabolic rate of glucose; CMRO2, cerebral metabolic rate of oxygen; LGI, lactate-glucose index; OGI, oxygen-glucose index.
Modified from Kuwabara H, Ohta S, Brust P, et al. Density of perfused capillaries in living human brain during functional activation. Prog Brain Res. 1992;91:209-215; Vafaee MS, Meyer E, Marrett S, et al. Frequency-dependent changes in cerebral metabolic rate of oxygen during activation of human visual cortex. J Cereb Blood Flow Metab. 1999;19:272-277; and Gjedde A, Johannsen P, Cold GE, et al. Cerebral metabolic response to low blood flow: possible role of cytochrome oxidase inhibition. J Cereb Blood Flow Metab. 2005;25:1183-1196.
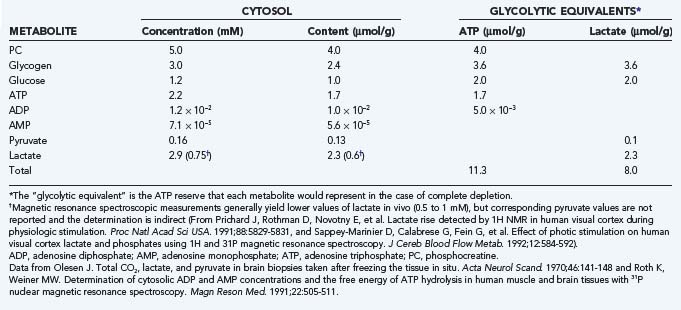
The whole-brain molar oxygen-glucose ratio or index (OGI) is slightly less than 6, thus indicating that about 90% of the metabolized glucose is fully oxidized. At the normal (default) stage, the total glucose consumption of the human cerebral cortex is about 30 µmol/hg per minute, with an OGI of about 5.5. The 10% nonoxidative metabolism of glucose leads to a rate of lactate production of about 5 to 7 µmol/hg per minute. This lactate flux is about 25% of the maximum transport capacity (Tmax) of the type 1 monocarboxylic acid transporter (MCT1, see later) in the blood-brain barrier at a tissue lactate concentration of about 1.5 mM (see Table 7-3). The corresponding ATP turnover in humans is unknown because it depends on the average degree of uncoupling of oxidative metabolism in mitochondria.34,35 In the absence of lactate production and uncoupling in mitochondria, the theoretical upper limit of ATP generation is 38 mol per molecule of glucose. However, with lactate production and uncoupling in mitochondria, the average gain is about 30 mol per molecule of glucose.34,36 Brain tissue metabolite stores are as listed in Table 7-4; an oxidative phosphorylation rate of 7.5 µmol/hg per minute represents less than a minute’s worth of ATP turnover in the human brain.
Atwell and colleagues evaluated the energy demands imposed by the different mechanisms that contribute to functional activity, commonly known as the brain’s energy “budget.”37,38 The main components are the requirements for ion homeostasis and impulse generation. The budget also includes processes such as biosynthesis during functional activity in vivo and neurotransmitter vesicle formation, fusion, and release. In the primate brain, almost all of the energy is spent on the restoration of ion gradients through the action of Na+,K+-ATPase. According to the budget, 90% of the energy turnover is devoted to “synaptic” activity and hence maintenance of membrane potential associated with functional activity in the brain. Eighty percent of the turnover occurs in neurons and about 15% in glial cells.39
Human brain oxygen consumption may increase to as much as 300 µmol/hg per minute under some physiologic circumstances and be accompanied by increased glucose consumption to as much as 50 µmol/hg per minute.16,40 These increases are based on magnetic resonance spectroscopic measurements of the total oxidative metabolism of pyruvate, which may increase to as much as 80 to 90 µmol/g per minute in normal human cerebral cortex.
Metabolism Depends on Delivery of Substrate to the Brain
Glucose Transport
Glucose is the source of pyruvate and enters brain tissue, neurons, and astrocytes by means of facilitative insulin and sodium-insensitive diffusion facilitated by several members of the glucose transporter (GLUT) family of membrane-spanning proteins.41 In brain tissue, the important members of this family are the GLUT1 and GLUT3 proteins.42 The 55-kD GLUT1 protein resides exclusively in the capillary endothelium that constitutes the blood-brain barrier,43 whereas the alternative 45-kD GLUT1 protein belongs to glial cells, the choroid plexus, and the ependyma but is relatively rare in the end-feet of astrocytes close to the blood-brain barrier. The GLUT3 protein occupies the plasma membranes of neurons.44 Transport of glucose is nonlinearly proportional to the difference in concentration between blood plasma and cytoplasm, but it is so avid that the glucose concentration is the same substantial fraction of plasma glucose everywhere in brain tissue.45
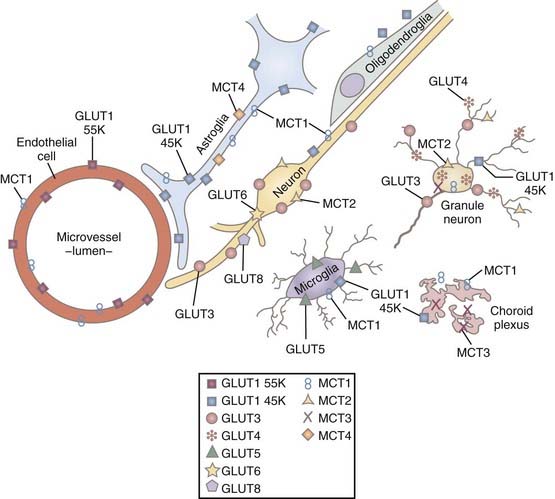
The transport capacity of the GLUT1 protein in the blood-brain barrier is known in some detail, and it has been demonstrated that glucose delivery is rarely rate limiting for brain glucose metabolism.42,46 The maximum transport capacity, or Tmax, of the endothelial GLUT1 protein in the blood-brain barrier is about 4 to 8 times the net influx of glucose. This depends on the species, with twice as much glucose being imported as consumed.42,47 The transport properties of the respective neuronal and glial GLUT3 and GLUT1 proteins are less well known. Simpson and associates summarized the existing information and concluded that the maximum transport capacities of GLUT1 and GLUT3 in the respective cellular compartments were 25% and 5% of the total for GLUT1 in endothelium and interstitial glial membranes and 70% of the total for GLUT3 in neuronal membranes.47 Thus, total transport capacity is low in the glial compartment in comparison to the 20-fold higher capacity in the endothelial and neuronal compartments.46 The interpretation raises the question of compartmentation, which is key to the understanding of homeostasis of glucose and other metabolites in brain tissue. The distribution of glucose transporters is shown in Figure 7-2.47
Under normal circumstances, glucose transport is not rate limiting for glycolysis in neurons, but the sufficiency of glucose delivery to glial cells depends on the amount consumed by these cells, which also maintain a reserve of glucose in the form of glycogen. This is the key issue that will be dealt with later: how much of the glucose is consumed by neurons and glial cells, respectively? Blood-brain glucose transport can become rate limiting in pronounced hypoglycemia, and it is in principle possible that it also could be rate limiting in conditions of extreme glycolytic activity unless blood flow keeps pace with glucose demand. In the brains of very active rats, Silver and Erecinska found slight decreases in the extracellular glucose concentration, as determined by means of a glucose-sensitive microelectrode placed in brain tissue.48 Work by Simpson and coworkers found that at a plasma glucose concentration of 6 mM, the steady-state glucose concentration is less in glial cells (0.9 mM) than in neurons (1.2 mM), which in turn is less than in the interstitium (1.4 mM).47
Monocarboxylate Transport
The monocarboxylic acids pyruvate and lactate and the ketone bodies acetoacetate and β-hydroxybuturate49 cross brain tissue membranes by facilitative proton-dependent transport catalyzed by the MCT family of 14 membrane-spanning proteins.50–54 In brain tissue, the important transporters are MCT1, MCT2, and MCT4.55–57 The low-affinity MCT1 and MCT4 transporters dominate the membranes of the capillary endothelium and astrocytes, whereas the high-affinity MCT2 transporter is specific to neurons, particularly the glutamatergic synapses and postsynaptic densities.58,59 MCT2 further appears to be regulated by neuronal activity and glycolytic rates, and the MCT4 protein appears to be specific for astrocytes.57,60 The distribution of MCT is shown in Figure 7-2.47
The members of the MCT family are near-equilibrium proton symporters and as such are influenced by cell pH such that symport declines when pH rises. In view of the surface area of neurons and glia, it is probable that exchange of pyruvate and lactate among the compartments of the brain is nearly at equilibrium in steady-state conditions, as it is for glucose. The MCT2 protein has 5-fold higher affinity (0.7 mM) for pyruvate and lactate than the MCT1 protein (3.4 mM) does and 50-fold higher affinity than MCT4 (30 mM) does,5,7,8,53,61–63 thus indicating that it achieves greater occupancy by lactate at normal concentrations than do the MCT1 and MCT4 proteins (Table 7-5). For this reason, it is likely that lactate’s preference for transport by MCT proteins is determined by the lactate concentration in the brain. At higher concentrations, lactate prefers the MCT1 and MCT4 proteins. However, the lower affinities also mean that the transporter turnover numbers are higher, which makes the approach to a new steady-state faster, other factors being equal. None of the isoforms restrict the exchange of pyruvate at the normal low concentration, but the MCT2 isoform may restrict the exchange of lactate between neurons and the extracellular space at higher concentrations. The restriction depends on the maximum transport capacity of MCT2, which may increase in common with glutamate receptors during activation.64
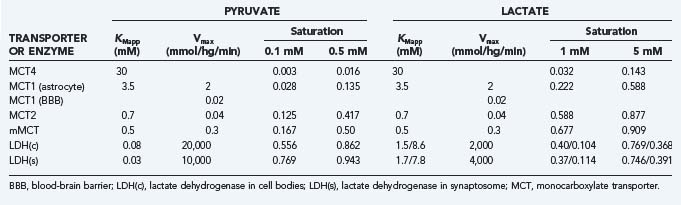
The maximum transport capacity (Tmax) of the MCT1 protein at the blood-brain barrier is 20 µmol/hg per minute,65 with a Michaelis constant for lactate of about 3 to 5 mM,53 which is higher than the normal lactate content of brain (see Table 7-4). In brain tissue, the combined transport capacities of the MCT1, MCT4, and MCT2 proteins amount to as much as 2.5 mmol/hg per minute, or 100-fold greater than the blood-brain barrier transport capacity.58 Because the Tmax and half-saturation concentrations or Michaelis constants (Kt) of the MCT proteins are about the same for pyruvate and lactate,66 efflux of lactate and pyruvate across the blood-brain barrier under normal conditions is the rate-limiting step in the lactate and pyruvate tissue distributions. For the same reason, export of pyruvate to the circulation is no more than 10% that of lactate and thus may be ignored in the greater perspective of brain energy metabolism. The transport of lactate across neuronal membranes is close to saturation because of the high affinity of the MCT2 protein, which implies that net transport of lactate or pyruvate across neuronal membranes is prevented.67
Both pyruvate and lactate are transported into mitochondria by a specific mitochondrial monocarboxylate transporter (mMCT).68 The exact nature of the mMCT protein is not known, but the bulk of the evidence suggests that it is related to the high-affinity MCT2 transporter,53 although identity with the MCT1 protein is also suggested68,69 because both MCT1 and MCT2 can be found in the inner membrane of neuronal mitochondria. Kinship of the mMCT protein to MCT2 rather than the MCT1 protein is supported by the magnitude of the Michaelis constant of mMCT, which is 0.5 µmol/g, or higher than pyruvate’s concentration of 0.1 to 0.2 µmol/g in the cytosol. The Tmax of 0.3 mmol/hg per minute depends on mitochondrial density,70,71 but in any case it is fivefold higher than the average flux of pyruvate in human cerebral cortex (60 µmol/hg per minute). Thus, on average the rate of pyruvate entry into mitochondria can rise fivefold as the protein approaches saturation.
It is possible that the mMCT protein may become rate limiting for oxidative metabolism in the brain,67 as in the heart.72–74 However, it is more commonly held that the mitochondrial pyruvate concentration saturates the flux-generating pyruvate dehydrogenase (PDH) complex, thus rendering the pyruvate flux independent of the pyruvate concentration and instead a function of PDH and mitochondrial activity.
Oxygen Delivery
Oxygen delivery from blood to brain tissue is limited by its binding to hemoglobin. Other factors, such as specific resistance at the endothelium of brain capillaries,75,76 may also influence oxygen delivery. A significant fraction of the oxygen transported to brain tissue is extracted during the passage of blood in microvessels in the brain. On average, 40% of the oxygen in blood is extracted, but it may increase to as much as 60%. It appears that oxygen is delivered to the tissue entirely by diffusion and that the large extraction lowers the pressure gradient responsible for diffusion of oxygen. It is possible to calculate the loss of oxygen from the blood that flows through capillaries and hence the decline in oxygen partial pressure, which depends on the extraction fraction. Elevation of blood flow that exceeds the increment in oxygen consumption counters the decline in the pressure gradient, as described by simple one-dimensional models of oxygen diffusion to brain tissue.77–79 These models explain the nonlinear relationship between changes in blood flow and changes in oxygen consumption, which ensures that the disproportionately elevated blood flow delivers more oxygen during functional activation. The effect is to maintain mitochondrial oxygen tension relatively constant.
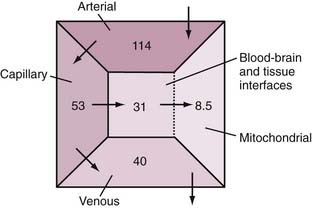
With typical values of the physiologic variables in the equations, the estimated normal distribution of oxygen pressure in the vasculature and tissue compartments is shown in Figure 7-3.80 Quantitative considerations predict that delivery fails when oxygen extraction reaches 60%, in which case extraction cannot increase further because the low capillary oxygen pressure restricts the diffusion.40 The neurovascular coupling responsible for the relationship between blood flow, oxygen delivery, and oxygen consumption has been the subject of research for the past 30 years, but no firm conclusions have yet emerged.
HomeostaTic Mechanisms Maintain Constant Adenosine Triphosphate

and
Under normal circumstances, brain energy metabolism maintains an approximately constant ATP concentration. Observations in the heart and brain suggest that 2- to 10-fold variations in work rate can be sustained with minimal change in ATP.81–85 Thus, the processes that maintain this metabolite must be sensitive (directly or indirectly) to increased ATP utilization by feedback or feedforward mechanisms such as monoaminergic and glutamatergic activation of metabotropic receptors.
Hydrolysis of Phosphocreatine
Creatine kinase (CK) occupies a pivotal role in early buffering of the ATP concentration.85 This cytosolic enzyme has tissue-specific isoforms, including the brain-predominant subtype BB-CK and the Mi-CK isoform bound to the inner mitochondrial membrane. The cytosolic CK reaction is in near equilibrium in living human brain.86,87 The reaction regenerates ATP by transfer of a high-energy phosphate bond from phosphocreatine (PC) to ADP. When the near equilibrium of the cytoplasmic CK reaction is perturbed, it buffers any increase in ADP by increased phosphorylation of ADP. The cytoplasmic PC is replenished by the mitochondrial CK, which in turn is regenerated by hydrolysis of ATP synthesized in mitochondria.88 The advantage is that PC diffuses an order of magnitude faster through the cytosol than do the adenine nucleotides.85 Yet under conditions of high metabolic activity, ATP homeostasis may be limited by the speed of the CK transphosphorylation reaction in mitochondria.88
Glycolysis
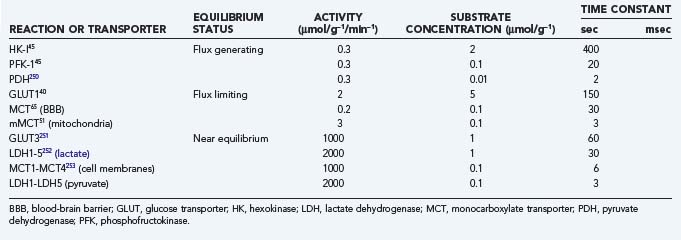
The main reactions and their time constants are listed in Table 7-6, and their interactions are shown in schematic form in Figure 7-4. The time constants dictate the half-times of change, that is, the times that it takes the system to reach the halfway point of a new steady state. It is apparent from Table 7-6 that glycolysis responds to change with time constants on the order of milliseconds whereas oxidative metabolism responds with time constants of seconds or minutes. Hence, oxidative metabolism responds to any stimulus with a certain delay when compared with glycolysis.
Lactate Synthesis
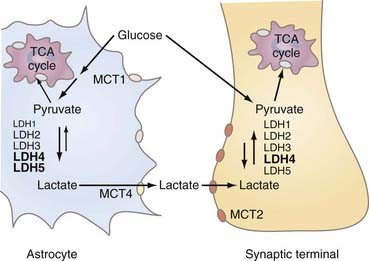
LDH is a tetrameric protein composed of one or more of two subunits, A and B, or M (for muscle type) and H (for heart type), respectively. The combinations yield five normal variants or isozymes (A4 = LDH5, A3B = LDH4, A2B2 = LDH3, AB3 = LDH2, and B4 = LDH1). The brain has all of the isozymes of LDH, but the “muscle” isozymes LDH4 and LDH5 predominate, particularly in astrocytes. Synaptic terminals have a little more of the “heart” isozyme LDH1 than cytosol does in general.89 The distribution of LDH isozymes between the cytosol of both neurons and astrocytes and synaptic terminals is shown in Figure 7-5.89
Both LDH4 and LDH5 have medium affinities for pyruvate and lactate that are close to the normal tissue concentrations of these metabolites, similar to less oxidative tissues such as liver and some muscle cells.90 The relatively intermediate affinities for pyruvate and lactate are reflected in the measured lactate-pyruvate concentration ratio of 10 to 15. Because the near-equilibrium LDH reaction is easily saturated at higher pyruvate and lactate concentrations, these higher concentrations tend to prevent net conversion rates from pyruvate to lactate or vice versa. The observation that the affinity of LDH for pyruvate is 10-fold higher than the affinity of mMCT for pyruvate (see Table 7-5) suggests that pyruvate prefers entry into mitochondria at higher pyruvate concentrations.
where Keq is the equilibrium constant of the LDH reaction. The ratio between the concentrations of lactate and pyruvate is also the apparent ratio between their affinities. At steady state, the ratio must be the same everywhere, given the near-equilibrium and facilitated diffusion nature of the proton symporters of lactate and pyruvate. The constant ratio implies that the different inherent kinetic properties of LDH exist to accommodate differences in the NAD+-NADH ratio in different parts of the tissue.91
It is a common claim that the relatively low affinity of LDH1 for pyruvate makes this enzyme particularly useful to a tissue with high oxidative capacity because it allows rapid buildup of pyruvate, whereas LDH5 is more effective at buffering the increase in pyruvate in a tissue with lower oxidative capacity because of its relatively high affinity for pyruvate. There is evidence that more LDH1 and the mRNA for the subtype are found in synaptic terminals than in neuronal and astrocytic cytosol in general, which in turn appears to possess particularly abundant LDH4 and LDH5 subtypes and their corresponding mRNA.89,92–94 However, it is probably incorrect to infer a net direction of the LDH reaction simply from the presence of a specific subtype in a cell population.95 For practical purposes, it is more useful to regard the properties of the LDH subtypes as being regulated to match the prevailing NAD+-NADH ratios during transient events of activation or deactivation of the tissue, as discussed later.
Oxidative Phosphorylation
At steady state, brain metabolism has a respiratory quotient of unity, consistent with the oxidation of glucose96–98 and with the integration of glycolysis and oxidative metabolism. The net effect of the metabolism of pyruvate to CO2 is to provide the electron chain complexes with the nicotinamide (NADH) and flavin (FADH2) adenine dinucleotides necessary for electron transport and oxygen metabolism. This subsection presents the primary regulatory steps for oxidative metabolism in mitochondria.
Pyruvate Dehydrogenase Complex and the Tricarboxylic Acid Cycle
Recent evidence suggests that mitochondria may import both pyruvate and lactate.68 Inside the mitochondria, the lactate is then reconverted to pyruvate in another LDH-catalyzed near-equilibrium reaction.69,99,100 The pyruvate provides the mitochondrial electron carrier complexes I and II with NADH and FADH2, respectively. Per mole of glucose, 2 mol NAD+ is reduced by glycolysis and 2 mol NAD+ is reduced by the oxidation of pyruvate in the PDH complex. The remainder of the NAD+ and the entire FAD are reduced by the flux-generating tricarboxylic acid (TCA) cycle enzymes citrate synthase and oxoglutarate dehydrogenase. Through the regeneration of guanine triphosphate, the TCA cycle leads to the nonoxidative phosphorylation of 2 mol ATP per mole of glucose. In total, per mole of glucose, 20 hydrogen ion equivalents are extruded from the mitochondrial matrix and join four hydrogen ion equivalents generated in the cytosol. The 24 hydrogen ion equivalents provide the driving force for the rephosphorylation of ADP. In this way, 3 mol of ATP for each mole of NADH oxidized to NAD+ and 2 mol of ATP for each mole of FADH2 are formed from ADP and Pi by the ATP synthase.
Calcium ions play a role in the oxidation of pyruvate by activating the mitochondrial enzymes mediating the nonequilibrium and flux-generating reactions (PDH complex, citrate synthase, NAD+-linked isocitrate dehydrogenase, and the 2-oxoglutarate dehydrogenase complex) that supply the NADH and FADH2 substrates for the mitochondrial complexes I and II.101 In the resting state, mitochondria contain little calcium, but calcium accumulates after excitatory amino acid stimulation of postsynaptic neurons.10,102 Calcium entry is facilitated by the Ca2+ uniporter in the mitochondrial membrane and driven by the mitochondrial membrane potential established by H+ extrusion. Increases in calcium concentration often occur as repeated spikes with steep upslopes and shallower downslopes that reach baseline during sustained excitation.103 A steady agonist level may induce pulsatile release of calcium from calcium stores, and the frequency of this calcium pulsation apparently depends on the agonist concentration.10
Oxidative Phosphorylation
Brain energy metabolism is synonymous with the rate of oxidative phosphorylation of ADP to ATP in mitochondria. This reaction is catalyzed by the proton-driven F-type ATPase in the inner membrane of the mitochondrial cristae, named for its discoverer Ephraim (“F”) Racker104 and now known as ATP synthase. Despite the importance of this process to the entire understanding of brain function, regulation of oxidative phosphorylation in the brain in vivo is still poorly understood. The “near-equilibrium” hypothesis of Erecinska and associates105 and Erecinska and Wilson106 assigned the flux generation to the irreversible reaction between oxygen and cytochrome c and hence to the oxygen tension and the electron saturation and degree of reduction of cytochrome c.107,108 The “near-equilibrium” status refers to the entire electron transport chain and the ATP synthesis reaction, with the important exception of the cytochrome c oxidase reaction.
Cytochrome c oxidase has been calculated to be 95% saturated at the oxygen tension prevailing in mitochondria in human brain in vivo, but its sensitivity to variations in oxygen tension is much greater than implied by this occupancy because diffusion of oxygen from microvessels is impaired at lower mitochondrial oxygen tensions. The “near-equilibrium” hypothesis therefore requires that the maximum reaction rate (Vmax) or apparent affinity (P50), or both, of cytochrome oxidase for oxygen be adjusted in response to the [ADP][Pi]/[ATP], or energy charge, ratio in the cytosol to allow the enzyme to maintain an adequate rate of ATP synthesis. The hypothesis predicts that increases in this ratio change the properties of cytochrome oxidase in such a way that cytochrome c continues to react with oxygen at the rate that matches the rate of cytosolic ATP utilization. There is a theoretical limit to the efficacy of this adjustment, particularly when the cytosolic energy charge is unchanged. In reality, it appears that the near-equilibrium hypothesis assigns the ultimate maintenance of oxygen consumption to the regulation of oxygen delivery, particularly in situations in which mitochondrial oxygen tension threatens to fall below a minimum threshold.40
In rat heart mitochondria, LaNoue and coworkers demonstrated that near equilibrium of oxidative phosphorylation exists when respiration is very slow (state 4) but that mitochondrial ATP synthesis occurs far from equilibrium when respiration is active (state 3).109 These observations show that the near equilibrium of oxidative metabolism could fail in normally and rapidly respiring brain tissue. As a result of the imbalance between oxygen delivery and cytochrome oxidase activity in these states, cytochrome c oxidase does not remain saturated when the mitochondrial oxygen tension declines relative to the average capillary oxygen tension. Energy turnover must therefore fail when mitochondrial oxygen tension declines below a certain threshold, and this takes place very rapidly and in association with loss of consciousness despite adequate intermediate metabolites in the tissue, including ATP.110
Uncoupling
Coupling of oxygen consumption to oxidative phosphorylation depends on the inability of hydrogen ions to escape into the matrix by routes other than through the ATP synthase channels. Alternative routes of dissipation of the hydrogen gradient maintain oxygen consumption by allowing oxide ions to join hydrogens ions without the generation of ATP from ADP. The importance of uncoupling has recently emerged as a potential but still elusive form of control of brain energy metabolism that is not reflected by changes in oxygen consumption. Uncoupling of mitochondria from energy metabolism takes place when protons escape to the matrix through permanent or inducible channels. An important permanent channel is adenine nucleotide translocase, which transfers the newly synthesized ATP out of the matrix. The more active this channel, the greater the leak of hydrogen ions, such that an upper limit of 90% coupling is observed. The lower limit is actually 0% coupling (100% uncoupling) in isolated mitochondria, with a 75% average in the rat in vivo.34 Inducible uncouplers probably also contribute to this average in brain tissue, in which the recently discovered uncoupling protein 2 (UCP2) has been identified. Whether UCP2 plays any role in the regulation of energy metabolism in the brain as a whole or in parts of the brain, such as those associated with appetite control, is unclear.34
Metabolic Compartments Exchange Pyruvate and Lactate
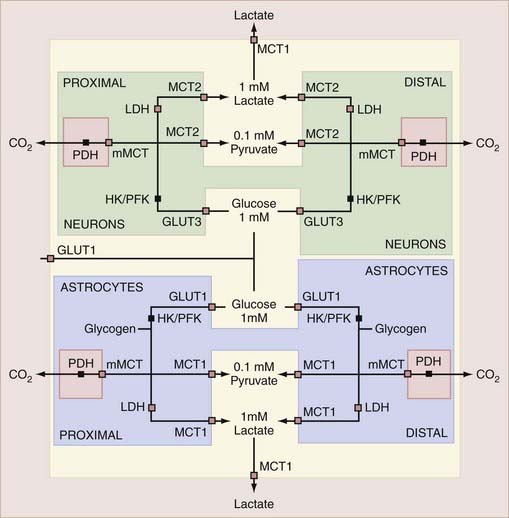
Brain tissue has several populations of cells, all of which play important roles in brain function. This section describes the properties of the separate metabolic compartments of neurons and astrocytes that confer important joint roles of these compartments in the regulation of metabolic responses to excitation. The relationships between the compartments, transporters, and enzymes that determine the exchanges among the compartments are shown schematically in Figure 7-6.
Functional Properties of Neurons and Astrocytes
Classically, the compartmentation of brain metabolism distinguishes between “large” and “small” pools of the excitatory amino acid transmitter glutamate.66,111 Quantitative conversion of glutamine to glutamate takes place in the large pool, catalyzed by glutaminase, whereas the opposite process takes place in the small pool, catalyzed by glutamine synthetase and fueled by ATP. The two pools of glutamate are now largely believed to represent neurons and astrocytes, respectively. In mammalian cortex, transfer of glutamate between the two pools occurs through neuronal release of glutamate during excitation and subsequent import by neurons and glia.
Astrocytes play a critical role in the synthesis of glutamate and import of glutamate and potassium from the interstitial space surrounding the intrasynaptic clefts. Astrocytic processes engulf the synapses and possess excitatory amino acid (glutamate) transporters in abundance (EAAT-3 in humans112 and GLAST and GLT-1 in rats).113 The transporters also reside on neurons,111 but gene “knockout” studies show that glial EAAT is indispensable for normal brain function, unlike neuronal EAAT.114 One molecule of glutamate is symported from the extracellular space with three sodium ions. Such transport increases the intracellular content of sodium and leads to export of sodium ions coupled to astrocytic import and accumulation of potassium ions by means of Na+,K+-ATPase. The result is a net increase in potassium in the astrocytes. This means that the uptake of glutamate by astrocytes disrupts sodium homeostasis, which results in increases in intracellular sodium concentration115 and the subsequent activation of Na+,K+-ATPase.116 This process imposes a metabolic burden on the astrocytes that is reflected by an increase in ATP consumption.117 The increase in metabolic demand is met by an increase in the rate of glycolysis in astrocytes with release of lactate.118
Although the overall process of neuron-glia metabolic coupling known as the “astrocyte-neuron lactate shuttle”119–121 still needs confirmation in vivo, the key role of glutamate uptake by astrocytes as a coupling signal for glucose uptake into the brain parenchyma during activation has been confirmed in animals in which expression of the glial glutamate transporter GLAST (EAAT-1) was downregulated by antisense oligonucleotides122 or eliminated in knockout mice.123 Indeed, in both conditions glucose uptake is reduced in the barrel field after sensory activation of the corresponding vibrissae.
Metabolic Properties of Neurons and Astrocytes
The different transporter properties of neurons and astrocytes show that astrocytes possess the lower affinity MCT1 and MCT4 transporters. In addition, there are important enzymatic differences that cause the two groups of cells to react differently to changes in metabolism. The enzymatic peculiarities of astrocytes include a higher than average presence of the high-affinity LDH4 and LDH5 isozymes and the enzyme pyruvate carboxylase, which provides an alternative pathway of pyruvate metabolism. In addition, astrocytes have comparatively larger stores of glycogen, and they consume acetate in addition to glucose.124 The lower affinity MCT1 and MCT4 transporters and the higher affinity LDH4 and LDH5 isozymes together may establish a preference for export of pyruvate rather than conversion to lactate, thus indicating that astrocytes are particularly well equipped for the generation of pyruvate and subsequent oxidative metabolism, either in the astrocytes or after export to other cells.
Import of glutamate stimulates ATP hydrolysis by glutamine synthetase and Na+,K+-ATPase in glial cells.118,124–126 The neuronal and glial compartments both possess the mechanisms necessary for the completion of glycolysis and oxidative phosphorylation, but the relationship depends on the relative oxidative and glycolytic capacities of the two metabolic compartments.17,19,127 Although it is certain that pyruvate is metabolized oxidatively in astrocytes,127–129 the key to the metabolic relationship between the neuronal and glial compartments is the ratio of glycolytic to oxidative activities in the two cell types under different physiologic conditions. Several factors influence the exchange of metabolites between metabolic compartments: the distribution of glycolytic and hexokinase activities among the compartments, the distribution of oxidative capacity among the compartments, and the volumes of the different compartments. These factors in turn determine the number of compartments that must be considered.
When these factors are taken into account, it is likely that at least four different compartments can be discerned. The answer is important because any local imbalance in glycolytic and oxidative capacities necessarily leads to exchanges of pyruvate and lactate among these localities, facilitated as they are by the more or less homogeneous pools of glucose, pyruvate, and lactate that exist in brain tissue. In these pools, glucose is consumed at the sites of phosphorylation in proportion to the hexokinase activity, wherever this is established, whereas pyruvate is consumed in proportion to the local oxidative capacity, with lactate acting as a buffering intermediate among these sites.129 The current very active discussion of glial metabolism hinges on the relative glycolytic and oxidative capacities of astrocytes and neurons because it remains uncertain whether the metabolic profile of astrocytes not only quantitatively but also qualitatively differs from that of neurons. However, until the advent of high–field strength magnetic resonance spectroscopy,17 isolated populations of astrocytes and neurons were studied only in vitro, where exchange of metabolites among different cell types is absent.
Distribution of Oxidative Capacities
On the oxidative side, the fraction of total brain oxidative metabolism ascribed to non-neuronal cells is 20%,16,17,39,126 although it remains a puzzle that a key step in the oxidative metabolism of glucose, the aspartate-glutamate carrier of the malate-aspartate shuttle in mitochondria, in some studies appears to be absent in glial cells, thus rendering them incapable of complete oxidation of pyruvate.130,131
Distribution of Glycolytic Capacities
The question of the glycolytic activity of the metabolic compartments in vivo is complicated by the lack of specific glycolytic markers. Some studies suggest that astrocytes are considerably more glycolytic than neurons, but detailed regional measurements in mammalian brain in vivo are still lacking. In a study of both cell types in isolation, Itoh and colleagues found that both release lactate, albeit to different extents.132 However, the neuronal release of lactate in vitro cannot, of course, be an accurate model of the potential exchanges of pyruvate and lactate under the more active conditions prevailing in vivo. Thus, neurons or astrocytes, or both, could in principle release pyruvate and lactate at low activity in vitro but still require net uptake of either at high activity in vivo. The significance of this point depends on the individual glycolytic and oxidative capacities of the two cell types and on the extent to which these capacities undergo change during functional activity in vivo. An accurate description of the regional distribution of glycolytic activity, represented by hexokinase, is not available, but there is probably an even distribution of HK-I activity in the cytoplasm of neurons and astrocytes.133 By complex modeling of known GLUT and MCT transport capacities in rat brain, Simpson and colleagues determined that steady-state neuronal glucose consumption exceeded astrocytic glucose consumption by a factor of 5,47 which is consistent with the fraction of astrocytic oxidative metabolism. This is the simplest situation in which neurons and glial cells are equally oxidative and glycolytic, but astrocytes have a lower rate of metabolism when their share of the tissue volume is taken into account.
The notion that glial cells are considerably more glycolytic than neurons arises from different experiments. Herrero-Mendez and associates discovered that neurons have low PFK-1 activity because of constitutionally regulated degradation of the associated PFK-fb3 (6-phosphofructo-2-kinase/fructose-2,6-bisphosphatase-3) enzyme activity.134 From these observations, the authors concluded that the glycolytic activity of neurons or parts of neurons must be low and that metabolism of glucose to pyruvate in neurons mainly takes place in the pentose phosphate pathway, which results in the production of reducing equivalents in the form of NADPH. The latter represents the necessary cofactor in the scavenging of reactive oxygen species produced by the high oxidative activity of neurons.134
Through a different approach, Silver and Erecinska found 25% to 32% of the ATP production in astrocytoma cells in vitro to be glycolytic.135 A simple relationship relates the percentage of glycolytic ATP production to the OGI. Indirect studies in vivo also suggest that the proportion of glycolytically generated ATP is close to 20% in astrocytes in vivo.17,136 The 20% figure is commensurate with an OGI value of 1. The glucose metabolic rate associated with this OGI can be calculated from the oxidative metabolism of the tissue, and the fluxes of ATP and pyruvate and the efflux of lactate in turn can be computed from the glycolytic rate.
Distribution of Volumes among Metabolic Compartments
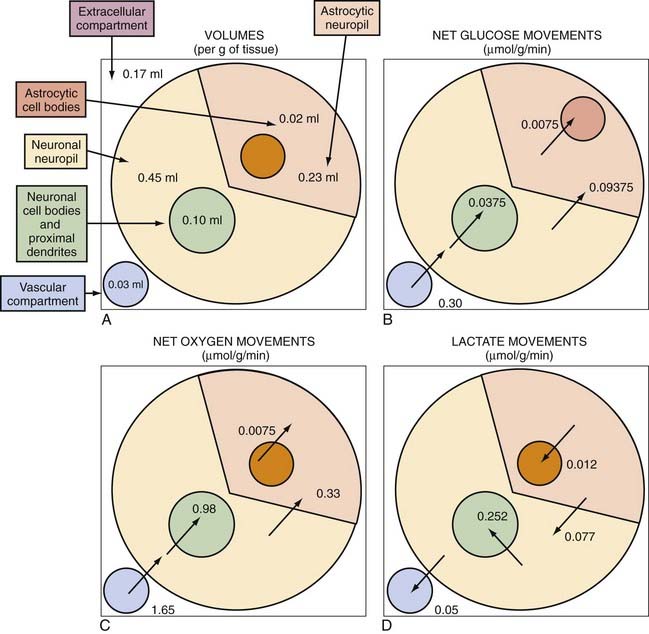
The volumes that neurons and astrocytes occupy in the cerebral cortex are not known with certainty, in part because extensions from the cell bodies (somata) are intertwined in the cortical neuropil. Recent assessment has shown that the somatic volumes of neurons and astrocytes in human cerebral cortex average 10% and 2% of the total volume, respectively.137 With an extracellular volume of 17% and a vascular volume of 3%, it is probable that the total neuropil occupies about 70% of the cortical volume. Less recent assessments of the total volume of astrocytes, including the processes from the somata, vary from 20% to 30%,138,139 which leaves 40% to 50% of the total volume as the neuronal share of the neuropil. The estimation of volumes suggests that at least four compartments are present that correspond to the cell bodies and proximal sites of neurons, cell bodies and proximal sites of astrocytes, distal sites of neurons, and distal sites of astrocytes, with possibly very gradual transitions among the four. These volumes are shown in Figure 7-7A.
Metabolite Cycling
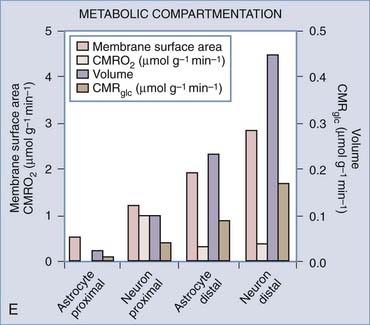
A differential distribution of oxidative capacity can be estimated for the human cerebral cortex by taking into account the relative volumes of neuronal and astroglial somata, the fractions of neuropil volume assigned to the neuronal and astroglial fractions, the relative density of mitochondria in these fractions, and the fraction of total oxidative metabolism assigned to astrocytes as a whole. By combining the oxidative metabolic rate of astrocytes (20% of the total brain energy metabolic rate) with estimates of the OGI of different parts of astrocytes (Table 7-7) and the average OGI of the cerebral cortex (see Table 3), it appears that the proximal parts of neurons would have an OGI of close to 25, or much greater oxygen than direct glucose use (Table 7-7). This is possible only if these parts of the neurons import the majority of the necessary pyruvate in the form of lactate from sources other than the glucose imported directly by neurons. When other compartments, including the distal parts of neurons and the proximal and distal parts of astrocytes and extracerebral sources of lactate, supply pyruvate to a uniform tissue pool, the proximal elements of neurons draw a sizable portion of their glycolytic needs from this pool. Estimated values of these relationships are provided in Table 7-7 and illustrated in Figure 7-7E. Proximal neuronal sites have the highest oxidative metabolic rate, no less than 9.8 µmol/g neuronal somata per minute, and distal neuronal sites (neuropil) have the next to lowest metabolic rate, no more than 0.76 µmol/g neuronal neuropil per minute. In comparison, distal astrocytic sites (processes) then have the second to highest oxidative metabolic rate of 1.4 µmol/g astrocytic processes per minute (although only 14% of neuronal somata), and proximal astrocytic sites (somata) have the lowest oxidative metabolic rate of 0.375 µmol/g astrocytic somata per minute, as shown in Figure 7-7B to D.
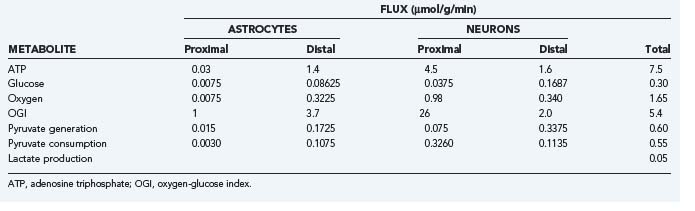
The circumstances listed in Table 7-7 are consistent with a higher rate of production of lactate by astrocytic processes than by neuronal terminals, as demonstrated by Itoh and associates in vitro.132 The calculation shows that the oxidative capacity of astrocytes is low for two reasons: a higher preference for glycolysis because of low oxidative capacity and a lower rate of total work. Thus, the proximal elements of neurons remain the major sites of oxidative rephosphorylation of ATP, accounting for 60% of the oxidative metabolism but only 12.5% of the glycolytic metabolism of brain tissue,16,17,132,135,140,141 whereas astrocytes and the neuropil, including the distal elements of neurons, consume 87.5% of the glucose but only 40% of the oxygen.
It is evident that the issue of the rates of glycolysis and oxidative phosphorylation in neurons and glial cells hinges on the mechanisms underlying the estimates of the relative glycolytic and oxidative capacities of the respective cellular compartments, of which there appears to be at least four, including subdivisions of the neuronal and astrocytic populations of cells. The relative capacities arise from the differential activities of hexokinase/phosphofructokinase and cytochrome oxidase in the compartments, which in turn appear to depend on the time constants of the metabolic fluctuations and on the average metabolic activity. Low time constants are likely to favor glycolysis and low average oxidative rates, whereas high time constants favor high oxidative rates, much as in muscle cells.142–144
Even though neurons and astrocytes differ with respect to metabolite enzyme and transporter distribution, there is no evidence that the pools of glucose, pyruvate, and lactate are compartmentalized inside and outside neurons and glia. Because transport in vivo is entirely passive, it is puzzling that glutamate in vitro inhibits glucose transport into neurons and triggers glucose transport into astrocytes.145,146 However, there is little direct evidence of a fundamental difference between the ability of neurons and glia to oxidize pyruvate, except for the greater activity of glycolytic enzymes in glia and the neuropil and the greater activity of cytochrome oxidase in the proximal parts of neurons.
Unless pyruvate were strictly compartmentalized (the abundance of MCT1 and MCT2 effectively excludes this), it is kinetically impossible for neurons to prefer pyruvate of non-neuronal origin, whether directly or indirectly imported, over pyruvate of neuronal origin.147 The evidence suggests that the four compartments of the two populations of cells contribute differentially to joint pyruvate and lactate pools but that the extent of the differential distribution would be a function of the degree of activation of the two cell types.
The simple model of metabolite pathways gleaned from these considerations is shown in Figure 7-6, in which the control points of the differential glycolytic and oxidative capacities are the HK-I/PFK-1 and PDH steps, respectively. The capacities of the separate PDH steps in the subcompartments of neurons and astrocytes are most likely related to the number of calcium-stimulated mitochondria, whereas the capacities of the HK-I/PFK-1 steps are subject to the temporal requirements of glutamate transport and metabolism in astrocytes and glycolysis in neurons. This analysis suggests that the functional ranges of the activities are very different in the two cell types, in keeping with the very different functional contingencies facing the two cell types in normally functioning brain tissue.
Activation Perturbs Metabolic Compartments Differentially
At the core of this conundrum is consciousness. The emerging discipline of neuroenergetics focuses on measures of the energy turnover of brain tissue as keys to the functional integrity of brain tissue, including consciousness. The insights gleaned from the accomplishments of this discipline have been limited by the convention that changes in energy turnover are a consequence of or response to changes in brain function rather than the opposite.148,149
Thus, it is possible that it is the rate of energy turnover that enables consciousness by means of a phase transition that reorganizes the relevant molecules to such an extent that they cooperate in the service of conscious experiences. Much empirical evidence could be cited in favor of the theory that the unitary experience of consciousness is related to the global level of energy turnover in the brain rather than to the activity in isolated regions of the brain. Among these findings is the correlation between reported magnitudes of global brain energy metabolism and levels of consciousness.16
Ion Homeostasis during Activation
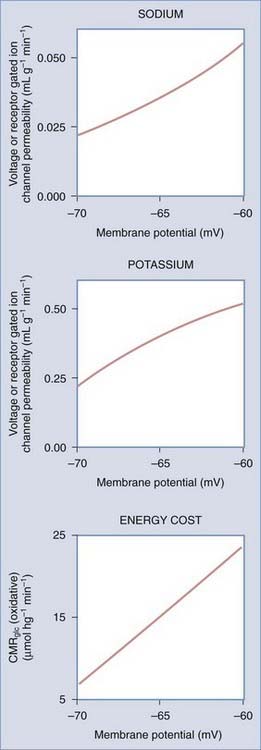
The sodium theory explains how neuronal excitation increases the work of the brain by increasing the leakage of ions across cell membranes and how depolarization of neuronal membranes and influx of calcium ions lead to increased oxygen uptake.12,150 Changes in membrane potential differences occur when ion permeabilities change. The changes in membrane potential reflect changes in both sodium and potassium, or chloride, ion permeabilities. The glucose demand in turn changes to meet the nutrient delivery required to compensate for the increased ATPase activity imposed by oxidative phosphorylation. Figure 7-8 reveals the estimated metabolic consequences of increased sodium and potassium leakage. The glucose supply would have to increase to as much as 60 µmol/hg per minute to fuel an ATP turnover of 2 mmol/hg per minute. In the absence of oxygen (or with no increase in oxygen consumption), the glucose supply would have to increase to as much as 1 mmol/hg per minute, a 30-fold increase, to cover the same need for ATP.
Brain Energy Metabolism during Activation
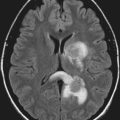
During maximal excitation of brain tissue in vivo, such as with epileptic seizures, local increases in the metabolism of glucose or oxygen can reach 100% or more of the metabolism of the normal default state, depending on the intensity of the stimulus.16,151–153 Under normal circumstances, changes in both blood flow and oxygen consumption tend to be very small, on the order of a few percentage points of the baseline, but the results obtained in experimental conditions vary greatly, depending on the circumstances, some of which may be nonphysiologic.
Global Steady-State Changes in Energy Metabolism
Average global steady-state changes are presented in Figure 7-9, in which recent magnetic resonance spectroscopic and allied studies in rodent cerebral cortex show a linear relationship between calculated cycling rates of glutamate between the larger (neuronal) and smaller (glial) distal metabolic compartments of the neuropil and calculated turnover rates of the TCA cycle in the combined neuronal compartments. In Figure 7-9, these findings are assigned to the canonic functional stages on the basis of the conditions of the human volunteers and experimental animals. The relationship between glutamate cycling and oxidative glucose metabolism shown in Figure 7-9 is consistent with the oxidative metabolism of 1 mol of glucose for each mole of glutamate released from neuronal terminals and recycled. It is important to note that the functional stages assigned to the global changes reflect major perturbations in consciousness that are not consistent with normal cognition. In fact, normal cognition is not accompanied by significant changes in global cerebral energy metabolism,154,155 thus suggesting that any local changes are matched by opposite changes elsewhere or affect regions so small that significance is not achievable.
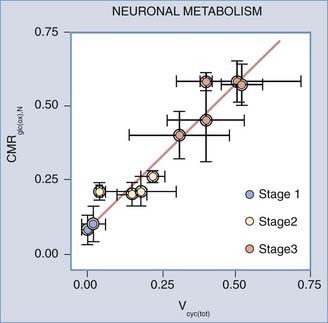
FIGURE 7-9 Stages of rat brain oxidative metabolism versus the rate of glutamate cycling measured by Sibson et al.,14 Choi et al.,254 Henry et al.,255 de Graaf et al.,256 Patel et al.,257 and Oz et al.,258. Abscissa, combined neuronal and astrocytic glutamate turnover rate (µmol/g/min); ordinate, oxidative metabolism of glucose in neurons (µmol/g/min). Functional stages were inferred from the type and level of general anesthesia used in each experiment. The slope of the line is 0.97 (unitless), and the y-intercept is 0.09 µmol/g/min.
(Modified from Hyder F, Patel AB, Gjedde A, et al. Neuronal-glial glucose oxidation and glutamatergic-GABAergic function. J Cereb Blood Flow Metab. 2006;26:865-877.)
Local Changes in Energy Metabolism in Response to Stimulation
Focal changes brought on by specific experimental stimulation of cerebral cortex depend on the stimulus but generally tend to be small, which suggests that the awake or conscious cortex normally functions at the same level most of the time. Focal activation responses in a number of stimulation studies of human brain (summarized in Table 7-8) fall into two fundamentally different categories of stimulation.40,127,156–164 Passive forms of stimulation in which no reaction is required or possible by the subjects generally result in little or no change in oxygen consumption.156–159165 During active forms of stimulation, in which a reaction is required or induced, significant increases in oxygen consumption tend to accompany the changes in blood flow, as referenced in Table 7-8 and illustrated in Figure 7-10.
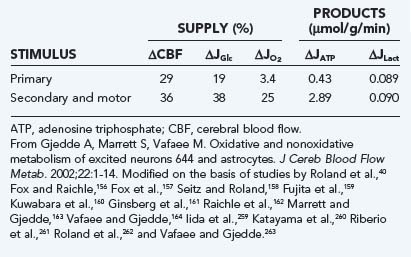
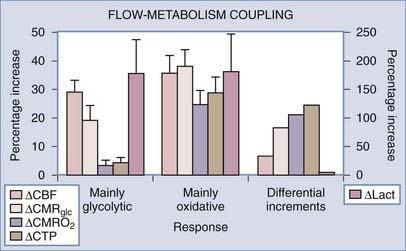
FIGURE 7-10 Flow–cerebral metabolic rate of oxygen (CMRO2) and flow-glycolysis coupling during stimulation of comparatively nonoxidative and oxidative cells. The relative increases in glycolysis, blood flow, and oxidative metabolism are estimated for two categories of response to stimulation: passive, primary somatosensory stimulation (“mainly glycolytic”) response and demanding, secondary somatosensory or motor (“mainly oxidative”) response listed in Table 7-8. Note the similar flow-glycolysis coupling in the two stimulations. Also shown are rates of incremental adenosine triphosphate (ATP) and lactate production during excitation. Stimulus and cells fall into two metabolic categories, one with an average incremental ATP/lactate ratio of less than 10 and one with average ratio of 300. Ordinate: percent increments in the variables listed in the graph. CBF, cerebral blood flow; CMRGlc, cerebral metabolic rate of glucose.
(Modified from Gjedde A, Marrett S, Vafaee M. Oxidative and nonoxidative metabolism of excited neurons and astrocytes. J Cereb Blood Flow Metab. 2002;22:1-14.)
The differences between the two categories of sensorimotor stimulation listed in Table 7-8 suggest that the ultimate increase in oxygen consumption depends significantly on the neuronal pathway mediating the response to the stimulus.166,167 In brain and in muscle cells, the cytochrome oxidase activity of populations of cells is regulated by signals from mitochondria that reflect the habitual energy requirement, averaged over longer periods.168–170 In muscle cells, neural input regulates the categorization of muscle cells into types I, IIa, or IIb. Changing the oxidative capacity requires sustained stimulation for an extended period. Thus, brief transient increases in energy metabolism above the habitual level of activity apparently are not accompanied by commensurately increased oxygen consumption. In the brain, this consideration leads to the conclusion that the two categories of response are related to the known differential oxidative and glycolytic responsiveness of the neuronal and glial compartments (see the earlier section “Metabolic Cycling”).
Changes in Metabolites during Activation
The changes governing the transient alterations in metabolite pools during activation involve many reactants. Because of their concentrations, ease of measurement, or both, the most commonly reported are glucose, glycogen in glial cells, lactate, and the NAD+-NADH pair. To make sense and to give an accurate view of the dynamic relationships, the changes must be compared with the influx and efflux measurements of glucose, lactate, and oxygen during the activation. The relationship between the most important metabolites can be reduced to the formula devised by Dienel and Cruz171:
 is the net rate of glucose transport across the blood-brain barrier,
  is the “lactate-glucose index” or ratio of net lactate and glucose transfer across the blood-brain barrier, and
  similarly is the familiar oxygen-glucose index, in this case the ratio of net rates of oxygen and glucose transfer across the blood-brain barrier, both weighted over the period of observation, shown as ΔT. The equation allows changes in metabolites to be estimated by measurements of the circulation, or vice versa. By taking account of these factors, non–steady states can be properly evaluated during the transients of activation. Two examples of the use of this equation, in rodents and humans, are representative of this approach.
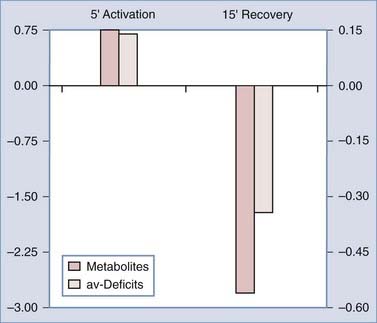
Dienel and Cruz reviewed metabolite and circulatory changes in the rat brain during activation by manual stroking of the rat.171 These changes were subsequently used in Figure 7-11 to compare the accumulation of metabolites and the value of the measured arteriovenous deficits defined in Equation 6. The comparison shows that metabolites accumulate (particularly glucose and lactate) during the 5-minute activation period and decline (particularly glycogen) in the subsequent 15-minute recovery period. The OGI declined during activation and rose above normal at the subsequent recovery. The changes show that the brains of these rats take up more metabolites than they use during the activation period whereas they use more than they take up during recovery. These changes suggest that the four metabolic compartments are subject to different degrees of activation or undergo differential regulation of their oxidative and glycolytic capacities. Ide and colleagues used measurements of arteriovenous differences across the brain in humans to similarly evaluate metabolite accumulation during and after exercise.172 The OGI had declined at the end of the exercise period, only to rise above normal at rest. The calculations confirm that metabolites accumulate during exercise and decline slowly toward normal over the next half hour.
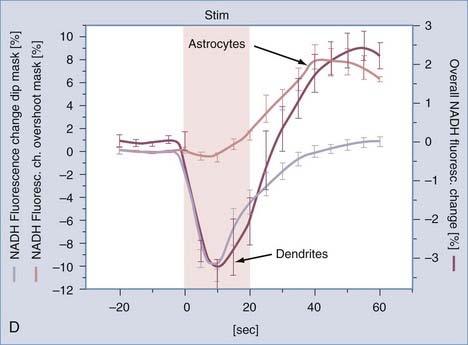
Kasischke and coworkers used fluorescence imaging to determine changes in NADH in hippocampal slices exposed to 32-Hz electrical stimuli.173 The NADH signal from the mitochondria of neurons declined during the first 10 seconds of the 20-second period of stimulation, thus indicating conversion of NADH to NAD+, consistent with the increased activity of NADH complex (I) in mitochondria, and then returned to baseline at the end of the 40-second recovery period. Figure 7-12 shows that the NADH signal from the cytosol of astrocytes increased toward the end of the 20-second stimulus and continued to rise for the following 20 seconds of recovery, thus indicating greater generation than metabolism of pyruvate (oxidative as well as nonoxidative) in astrocytes during this period. These findings reveal a failure of oxidative metabolism to increase in parallel with stimulation, beyond the brief initial exhaustion of the putative oxygen reserve in mitochondria, whether because of limited oxygen delivery to the slice or because of a constitutive inability of mitochondria to match the increased pyruvate generation. The beginning of recovery of NADH in the neuronal (dendritic) mitochondria in the second half of the stimulation is evidence of increased pyruvate oxidation, but it is unclear where this pyruvate is generated. There is no indication of the fate of lactate in the study. Together, the changes in energy metabolism and metabolites show that metabolites accumulate during stimulation and decline during recovery. This paradox implies that oxygen availability declines during stimulation and returns to normal or above normal during recovery.
Substrate Delivery during Activation
The measurements listed in Table 7-8 suggest that the relationship between changes in blood flow and generation of ATP is markedly variable during activation, with relative changes ranging from unity to 20.174 It is not known which specific aspect of neuronal excitation most critically depends on the increase in blood flow, but surprisingly, the findings suggest that changes in blood flow are unrelated to the immediate satisfaction of increased oxygen requirements. This section describes attempts to identify agents to which blood flow does respond when brain tissue undergoes activation.
Regulation of Microvascular Oxygen
Gjedde and associates considered whether the discrepant glycolytic and oxidative reactions to stimulation can be explained by a failure of blood flow to rise sufficiently to raise oxygen delivery,75 but during vibrotactile stimulation of human sensorimotor cortex Kuwabara and colleagues found that oxygen consumption remains constant despite significantly increased blood flow and capillary diffusion capacity.159,160,175 Because oxygen tension rises in the tissue when blood flow rises without a change in oxygen consumption, the experiment indicates that deficient oxygen supply is not the explanation for the limited oxygen consumption.
Possible clues to the discrepant changes in oxygen consumption and blood flow come from studies of the kinetics of oxygen delivery to brain cells.77,78,176 The diffusion limitation imposed by hemoglobin binding renders oxygen transport, as reflected in the extraction fraction, somewhat insensitive to increases in blood flow.177 Therefore, blood flow must increase disproportionately to raise oxygen transport. Perfectly matched flow-metabolism coupling, in contrast, maintains the same capillary oxygen tension profile and extraction fraction and hence cannot raise the oxygen pressure gradient in the absence of capillary recruitment or a decrease in mitochondrial oxygen tension. Kinetic analysis of cytochrome oxidase activity shows that increases in blood flow above the increase in oxygen consumption are needed to deliver more oxygen during excitation.40
With the decline in mitochondrial oxygen tension, oxygen consumption increasingly depends on capillary oxygen tension.178 Brain activation then demands disproportionately increased blood flow to increase mean capillary oxygen tension. The maximum oxygen delivery capacity is the upper limit of oxygen consumption and is reached when mitochondrial oxygen tension drops to the minimum level compatible with sustained cytochrome oxidase activity. The effect of the increase in blood flow is then to raise oxygen consumption. When the rise in blood flow is enough to satisfy the increased need, oxygen extraction declines and the average capillary oxygen tension is raised to a level consistent with the pressure gradient that delivers the necessary oxygen to the mitochondria.40
Blood Oxygenation Level–Dependent Changes in Signal during Activation
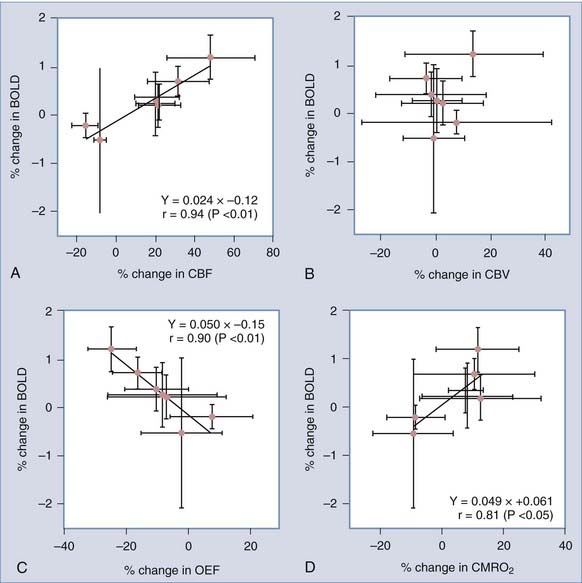
In the absence of proportionately increased oxygen consumption, increased blood flow leads to higher capillary oxygen tensions and lower extraction fractions and reduces the fraction of deoxygenated hemoglobin in capillary and venous blood (see Figure 7-3). The decline is a measure of the relative increase in oxygenation in cerebral veins when blood flow increases. Deoxyhemoglobin is paramagnetic, and the decline gives rise to a blood oxygenation level–dependent (BOLD) magnetic resonance contrast change during brain activation,179–182 which primarily is a function of the average extraction of oxygen from the vascular bed.183 Correlations between changes in metabolism (glucose and oxygen), blood flow, and oxygen extraction fractions and changes in BOLD signal generally support the explanation that changes in BOLD signals reflect the discrepancy between changes in oxygen consumption and blood flow, which are expressed by parallel changes in the oxygen extraction fraction.184–187 The correlated changes in blood flow, BOLD signals, and oxygen extraction fractions observed by Ito and associates are shown in Figure 7-13.184
Changes in Tissue Oxygen during Activation
Disproportionate increases in blood flow allow enough oxygen to enter the tissue during functional activation, but the agents responsible for the increase remain uncertain despite decades of research.188 The minimum oxygen tension in mitochondria can be calculated as the tension that is commensurate with the actual delivery of oxygen, and the commensurate blood flow rate can be estimated for a given arterial oxygen concentration by a form of inverted reasoning in which the mitochondrial oxygen tension must reflect the balance between oxygen delivery and consumption.80 Hence, tissue oxygen tension depends on, rather than controls, the rate of oxygen consumption.189,190 Surprisingly, this reasoning describes a compulsory flow limitation that dictates the oxygen consumption associated with a given blood flow rate when other variables such as cytochrome oxidase affinity and capillary recruitment remain constant. Changes in these variables in turn affect the rate of oxygen consumption. No change in oxygen consumption after a change in blood flow therefore implies a compensatory change in cytochrome c oxidase affinity for oxygen or cytochrome c or a change in the maximum reaction rate.
Some studies of oxygen supply and delivery suggest that the affinity of cytochrome c oxidase for oxygen may change inversely with the oxidative metabolism of a tissue and thus preserve the sensitivity of the cytochrome c oxidase reaction to changes in the maximum velocity.191 Gjedde and colleagues hypothesized that a similar change explains the invariant cerebral oxygen consumption measured during moderate changes in blood flow to the brain.39 Mason and colleagues speculated that the blood flow modulator nitric oxide (NO) could be the adjustable inhibitor of cytochrome c oxidase affinity that competes with access of oxygen to the enzyme.192 The finding that oxygen tension rises during the phase of blood flow increase and declines below normal when brain energy metabolism increases was demonstrated by Thompson and coworkers, who determined oxygen tensions in the cat visual cortex during stimulation with stripes of varying angles.193 Oxygen tensions increased during the stimulation, except when the angle of the stripe elicited activation of the monitored neuron. As predicted by the model, oxygen tension declined when that happened. Calculation of mitochondrial oxygen tensions in human brain in association with strenous body work suggests that the tensions in brain may occasionally decline to an extent that is correlated with the emergence of fatigue194,195 that can be so severe that continued exertion is impossible. The fatigue is deemed cerebral because direct stimulation of the muscles of the subjects shows that contraction of these muscles is still possible. This evidence is consistent with the development of fatigue when ambient oxygen tensions are lower than normal.196,197
The explanations of the mismatch between changes in blood flow and oxygen consumption during activation that underlies the changes in BOLD signals and the decline in oxygen extraction assume that no recruitment of capillaries raises the diffusion capacity of oxygen by shortening the diffusion distances in the tissue or by raising the intrinsic permeability of the capillary endothelial wall. Recruitment of capillaries in the brain is relative at most; that is, it occurs by an increase in the uniformity of transit times rather than by an absolute increase in the number of perfused capillaries.198–200 Relative recruitment may make very little difference to the transport of oxygen because the capillary surface area remains the same.77
Regulation of Blood Flow
There is an emerging consensus that the neurotransmitters glutamate and acetylcholine are the ultimate but indirect agents of change in blood flow when they engage the appropriate membrane receptors, which for glutamate are located primarily on postsynaptic neurons. Among the more direct blood flow stimulators, all of the following compounds, prostaglandins, epoxyeicosatrienoic acid, carbon dioxide, adenosine, and potassium and hydrogen ions, appear to require increased synthesis of the endothelium-derived relaxation factor NO by means of activation of the enzyme responsible for NO synthesis, NO synthase (NOS).10,201–204 Adenosine is a product of the hydrolysis of adenosine nucleotides, which are the key elements in energy metabolism, and hence is attractive as a potential signal for change in blood flow, but the absence of changes in ATP in physiologically functioning brain tissue rules out this role in normal brain. Studies of circulation in skeletal muscle show that a correlation exists between the increase in blood flow and the increase in lactate,205,206 thus suggesting that the increase in blood flow may reflect a glycolytic response.
Nitric Oxide
Emerging evidence gives NO a key role in modulating blood flow and cytochrome c oxidase affinity for oxygen and raises the question of the link between neurotransmitter-induced receptor stimulation and activation of NOS. It now appears that a common link between the synthesis of NO and activation of oxidative metabolism can be the flux of calcium ions into cells through voltage- and receptor-gated channels and through the mitochondrial membrane.10
NO causes vasodilation of brain resistance vessels, in addition to other effects on glial cells and presynaptic and postsynaptic neurons. It is synthesized in endothelial cells and neurons in proportion to the cytosolic concentration of unbound calcium.207 NO is generated in reactions catalyzed by the cell-specific NOSs, which include endothelial eNOS and neuronal nNOS, of which nNOS by far is the most abundant, and the inducible iNOS. Activation of eNOS is mediated by acetylcholine acting on muscarinic receptors of the M5 subtype.208–210 Buerk and colleagues determined the direct link between increases in NO and increases in blood flow in the rat brain,211 as well as oxygen tensions in a related study, as shown in Figure 7-14.212
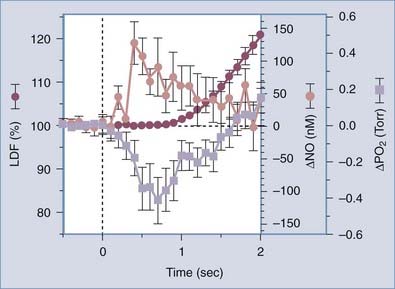
FIGURE 7-14 Initial sequence of temporal events in the rat somatosensory cortex during forepaw stimulation (onset at t = 0; duration, 4 seconds) for combined data (±SE bars) from Buerk et al.211 for tissue nitric oxide (NO) and from Ances et al.264 for tissue PO2. Laser Doppler blood flow (LDF) rates are the averages of the two studies.
(From Buerk DG. Letter to the editor [reply]. Neuroimage. 2003;20:613-614.)
It is not clear to what extent NOS activation is involved in functionally induced increases in cerebral blood flow. Pharmacologic blockade of the vascular receptors involved in the synthesis of NO abolishes functionally induced increases in blood flow, although the specificity of the blockade is in doubt. Focal changes in cortical blood flow induced by sensory stimulation can be eliminated by blocking endothelial acetylcholine receptors, including those involved in mediating the synthesis of NO, apparently without altering the underlying neuronal activation.213 Other evidence suggests that the cerebral vasodilation associated with simple somatosensory stimulation in rodents is modulated rather than mediated by NO synthesized by nNOS and not by eNOS or iNOS.214–217 Reutens and associates stimulated NO synthesis with the precursor L-arginine in humans and found that cerebral blood flow was increased globally but that the increase in regional blood flow in response to vibrotactile stimulation was unaffected, either because NO is not involved in the increase or because the increase was already maximally stimulated by NO.218
Prostanoids
Astrocytes provide a link between the extracellular space close to microvascular walls and the extracellular space close to synapses. On stimulation, astrocytic end-feet have been shown to mediate vasodilation by agents that appear to be products of the prostaglandin-synthesizing enzyme cyclooxygenase-2 (COX-2) in the brain. Products that inhibit COX-2 are known to cause a reduction in cerebral blood flow.40,219 Prostaglandins are released from astrocytes in response to intracellular increases in calcium ion when metabotropic receptors bind glutamate. The evidence shows that the COX product prostaglandin E2 (PGE2) is involved in astrocyte-mediated vasodilation102 and that Ca2+ signaling in astrocytes regulates vascular tone by release of PGE2. Recent evidence also shows that Ca2+ signaling may occur in response to stimuli other than neuronal excitation or may occur spontaneously,220 thus suggesting that changes in flow could occur without relation to functional activation of the cerebral cortex or synaptic activity.221 Interestingly, recent experimental evidence points to lactate as a crucial factor in modulation of the vasoactive role of prostanoids.222
Potassium
As a consequence of the increased potassium conductance of the cell membrane during neuronal excitation, activation raises the extracellular potassium ion concentration, which drives the potassium into astrocytes by several non–energy-requiring routes and in response to glutamate import. Metea and associates specifically ruled out glial K+ siphoning as a factor in neurovascular coupling.223
The role of potassium ions in mediating functionally induced increases in blood flow in the brain was tested by Caesar and colleagues, who found evidence of considerable heterogeneity in responses inasmuch as the relative contributions of extracellular potassium ions and adenosine to regulation of blood flow in the cerebellum varied among the cell populations, with NO and potassium playing the greatest role in parallel fiber connections and NO and adenosine playing the greatest role in climbing fiber connections.224
Adenosine Triphosphate Homeostasis during Activation
To satisfy the need for increased energy turnover during neuronal excitation, the necessary additional nutrients must be supplied from tissue stores or from the circulation. With no additional nutrients and no net loss of ATP, PC, glycogen, and glucose concentrations sustain the additional energy demands of a 100% rise in ATP turnover for less than a minute (see Table 7-6). However, the available evidence suggests that an abundance of additional sources of energy is provided at the onset of activation and that the type of activation determines whether this energy is used.
Hydrolysis of Phosphocreatine during Activation
Hydrolysis of PC buffers ATP concentrations at the expense of increased energy utilization. Roth and Weiner demonstrated that a substantial reduction in the concentration of PC (5 mM) is compatible with minimal change in ATP.86 This decline in PC represents as much as 3 times the normal turnover of ATP in 1 minute and hence allows a threefold increase in ATP hydrolysis with little or no change in the ATP concentration during the first minute. The decrease in PC raises the concentration of ADP in the cytosol. Erecinska and Silver determined that the hydrolysis of 5 mM PC could the raise the pH of brain tissue by as much as 0.3 unit at the prevailing buffering capacity.225 Thus, Chesler and Kraig found that astrocytes become more alkaline when they are depolarized during brain activation.226,227 The change is observed in several kinds of cells in which a rise in pH correlates with an increase in metabolic activity.228
Glycolysis during Activation
The increase in ADP concentration and the alkalinization of brain tissue caused by hydrolysis of PC both stimulate glycolysis at the PFK step, as in skeletal muscle.229 The glycolytic rate then increases by as much as 50% during functional activation of the human cerebral cortex,156,161 and the rate of pyruvate generation rises to 300 to 400 µmol/g per minute in the rat brain when it is maximally stimulated.230,231 This limit is close to the maximum transport rate of the mMCT symporter. At this rate of pyruvate generation, the pyruvate concentration rises until the rate of pyruvate removal matches the rate of generation. The increase benefits the near-equilibrium conversion of pyruvate to lactate, transport into mitochondria, and export to the circulation. Low NAD+-NADH ratios raise the equilibrium lactate-pyruvate ratio and hence delay the rise in pyruvate.
In the absence of increased oxidative phosphorylation, the increased glucose phosphorylation and pyruvate generation cause both the pyruvate and lactate levels and lactate efflux to rise in the tissue. The transporters and enzymes responsible for the removal of pyruvate display saturability in the range of normal pyruvate concentrations, particularly the LDH isozymes LDH4 and LDH5, but also LDH1 and mMCT. Saturability in the relevant concentration range means that the concentration must undergo a greater rise for the flux to increase. The lactate concentration continues to rise with the concentration of pyruvate until the transport of pyruvate into mitochondria and subsequent oxidation, the conversion to lactate, and the efflux of lactate together match the rates of generation. The speed with which the pyruvate concentration rises depends on the turnover numbers of the enzymes and transporters removing pyruvate and hence on the affinities of these mechanisms for pyruvate.67
Substantial lactate generation occurs in particular when glutamate is released presynaptically, but the excitation is subliminal and postsynaptic depolarization is prevented by inhibition. Mathiesen and colleagues showed that stimulation of cerebellar neurons in some cases led to increased blood flow despite inhibition of postsynaptic spiking activity by prevention of postsynaptic depolarization.232 Minimal postsynaptic depolarization would have two important consequences: postsynaptic mitochondrial dehydrogenases would not be activated by calcium, but astrocytes would nevertheless be stimulated to remove glutamate at a rate exceeding the oxidative capacity of the tissue and generating lactate.
Transport and Metabolism of Lactate during Activation
Transporters and enzymes with different affinities are affected differently when substrates rise in the tissue because the individual saturabilities vary according to the affinity. The variable saturability of transporters and enzymes in turn influences the pathway preferences of substrates. Estimates of the saturability of the main transporters and enzymes of interest to the pyruvate and lactate pathways listed in Table 7-5 show that the processes most likely to be inhibited at higher substrate concentrations are MCT2 and mMCT for lactate and LDH for both pyruvate and lactate, although the LDH capacity is so great that it is unlikely to have an effect. This inhibition directs elevated lactate in astrocytes toward MCT1 rather than MCT2, a path that keeps lactate out of neurons, and it directs elevated pyruvate toward MCT1, LDH, MCT2, and mMCT, a path that leads the pyruvate generated in astrocytes toward metabolism in proximal sites in neurons where the density of mMCT is greatest because of the coupling to oxidative capacity.
Oxidative Phosphorylation during Activation
In contrast to the negligible change in oxygen consumption in simple passive somatosensory stimulation, both motor stimulation and more demanding stimulations cause significant increases in oxygen consumption,162–164,233,234 as shown in Table 7-8 and Figure 7-10. If transport of pyruvate into mitochondria is rate limiting in functional stage 3 and 4 activation,74 the consumption of oxygen must depend on the cytosolic pyruvate concentration and hence on the rate of glycolysis, thus implying that oxygen consumption and lactate accumulation change in parallel.171,172
Metabolic Compartmentation during Activation
Sites of Cellular Activity during Activation
The cellular and subcellular sites of the increases in glucose and oxygen metabolism in brain activation have been topics of much investigation.47,89,125,126,235–238 There is evidence that the site of increased glycolysis is the synaptic structures of the neuropil,140,239,240 including astrocytic end-feet,173 which is also the predominant location of LDH.166 Mitochondria, conversely, have been observed to be particularly concentrated in the dendritic structures of the neuropil, particularly the proximal dendrites,127,143,241,242 which stain weakly for hexokinase.243 Recent observations reveal that some portions of astrocytes that engulf synapses also have more mitochondria127 relative to volume of tissue than do adjacent neuronal elements of the neuropil. These observations together suggest that glycolytic and oxidative reactions differ within cellular compartments and among cells, although the compartmentation is not complete (see “Metabolic Cycling” earlier).244
Removal of glutamate and hydrolysis and rephosphorylation of ATP in astrocytes must be sufficiently rapid to allow the frequent firing of excitatory neurons believed to underlie functional integration in the cerebral cortex.245,246 During non–steady-state or otherwise transiently excited states, it is possible that rapid glutamate removal247 may generate pyruvate in excess of the average oxidative capacity which may explain why astrocytes react more glycolytically to stimulation than neurons do. Thus, although recent measurements of the relative contributions of oxidative phosphorylation to the energy turnover in neurons and astrocytes show that 15% of the total energy turnover in brain tissue takes place in astrocytes at normal steady state,16,17 the astrocytes may contribute significantly more to the increase in nonoxidative metabolism when excitation of neurons is inhibited.
Because brain energy metabolism is predominantly oxidative,169 the compartmentation suggests that the enhanced oxidative metabolism associated with brain activation occurs predominantly in the proximal synaptic structures of the neuropil. In cases with little increase in oxidative capacity but increased glutamate uptake,10 the generated lactate is left to be exported across the blood-brain barrier and removed by the increased blood flow, as shown in Table 7-8 and Figure 7-10. This condition is associated with the low ATP-lactate flux ratio seen with the limited response of low oxidative capacity but high glycolytic capacity with passive stimulation. Conversely, with more demanding stimulation, the energy demand rises but additional lactate accumulation is prevented by the rise in oxygen consumption, as shown in Table 7-8 and Figure 7-10. In this case, the ATP-lactate flux ratio is in the high range. The increased oxygen consumption establishes the increased ATP turnover that is characteristic of the response of high oxidative capacity but low glycolytic capacity.
Models of Compartmentation during Activation
Several researchers have attempted to model the changes in metabolite concentrations and fluxes that are likely to occur during activation, given the properties of transporters and enzymes and the anatomy that dictates their distributions, as well as assumptions about the degrees of activation of the different cell groups.47,248,249 The results of these models not surprisingly depend on assumptions that generally beg the question; that is, they assume specific glycolytic and oxidative capacities in the chosen compartments, specific changes in metabolism in each of the compartments, and specific changes in blood flow. Thus, the models tend to illustrate rather than test the observation that spatial heterogeneities of the activities of glycolytic and oxidative metabolism in two or more compartments necessarily result in exchange of metabolites among the compartments, in quantities that depend on the degree of activation of the individual compartments. The real question is how the heterogeneities arise in the first place.
Bittar PG, Charnay Y, Pellerin L, et al. Selective distribution of lactate dehydrogenase isoenzymes in neurons and astrocytes of human brain. J Cereb Blood Flow Metab. 1996;16:1079-1089.
Buxton R, Frank R. A model for the coupling between cerebral blood flow and oxygen consumption during neuronal stimulation. J Cereb Blood Flow Metab. 1997;17:64-72.
Fujita H, Kuwabara H, Reutens DC, et al. Oxygen consumption of cerebral cortex fails to increase during continued vibrotactile stimulation. J Cereb Blood Flow Metab. 1999;19:266-271.
Gjedde A, Marrett S, Vafaee M. Oxidative and nonoxidative metabolism of excited neurons and astrocytes. J Cereb Blood Flow Metab. 2002;22:1-14.
Herrero-Mendez A, Almeida A, Fernández E, et al. The bioenergetic and antioxidant status of neurons is controlled by continuous degradation of a key glycolytic enzyme by APC/C-Cdh1. Nat Cell Biol. 2009;11:747-752.
Iadecola C, Nedergaard M. Glial regulation of the cerebral microvasculature. Nat Neurosci. 2007;10:1369-1376.
Lovatt D, Sonnewald U, Waagepetersen HS, et al. The transcriptome and metabolic gene signature of protoplasmic astrocytes in the adult murine cortex. J Neurosci. 2007;27:12255-12266.
Magistretti PJ. Neuron-glia metabolic coupling and plasticity. J Exp Biol. 2006;209:2304-2311.
Magistretti PJ, Chatton J-Y. Relationship between L-glutamate–regulated intracellular (Na+) dynamics and ATP hydrolysis in astrocytes. J Neural Transm. 2005;112:77-85.
Ogawa S, Lee TM, Kay AR, et al. Brain magnetic resonance imaging with contrast dependent on blood oxygenation. Proc Natl Acad Sci U S A. 1990;87:9868-9872.
Pellerin L, Magistretti PJ. Glutamate uptake into astrocytes stimulates aerobic glycolysis: a mechanism coupling neuronal activity to glucose utilization. Proc Natl Acad Sci U S A. 1994;91:10625-10629.
Silver IA, Erecinska M. Energetic demands of the Na+/K+ ATPase in mammalian astrocytes. Glia. 1997;21:35-45.
Vafaee MS, Meyer E, Marrett S, et al. Frequency-dependent changes in cerebral metabolic rate of oxygen during activation of human visual cortex. J Cereb Blood Flow Metab. 1999;19:272-277.
1 Morowitz HJ. Foundations of Bioenergetics. New York: Academic Press; 1978.
2 Laughlin SB, de Ruyter van Steveninck RR, Anderson JC. The metabolic cost of neural information. Nat Neurosci. 1998;1:36-41.
3 Abshire PA, Andreou AG. A communication channel model for information transmission in the blowfly photoreceptor. Biosystems. 2001;62:113-133.
4 Poulet JF, Petersen CC. Internal brain state regulates membrane potential synchrony in barrel cortex of behaving mice. Nature. 2008;454:881-885.
5 Hodgkin AL, Huxley A. A quantitative description of membrane current and its application to conductance and excitation in nerve. J Physiol (Lond). 1952;117:500-544.
6 Skou JC. Further investigations on a Mg++-Na+-activated adenosine-triphosphatase, possibly related to the active, linked transport of Na+ and K+ across the nerve membrane. Biochim Biophys Acta. 1960;42:6-23.
7 Gjedde A. The energy cost of neuronal depolarization. In: Gulyas B, Ottoson D, Roland PE, editors. Functional Organization of the Human Visual Cortex. Oxford: Pergamon Press; 1993:291-306.
8 Goldman DE. Potential, impedance, and rectification in membranes. J Gen Physiol. 1943;27:37-60.
9 Hodgkin AL, Katz B. The effect of sodium ions on the electrical activity of the giant axon of the squid. J Physiol (Lond). 1949;108:37-77.
10 Lauritzen M, Lauritzen M. Reading vascular changes in brain imaging: is dendritic calcium the key? Nat Rev Neurosci. 2005;6:77-85.
11 Magistretti PJ, Morrison JH, Shoemaker WJ, et al. Vasoactive intestinal polypeptide induces glycogenolysis in mouse cortical slices: a possible regulatory mechanism for the local control of energy metabolism. Proc Natl Acad Sci U S A. 1981;78:6535-6539.
12 Kann O, Kovács R, Heinemann U. Metabotropic receptor-mediated Ca2+ signaling elevates mitochondrial Ca2+ and stimulates oxidative metabolism in hippocampal slice cultures. J Neurophysiol. 2003;90:613-621.
13 Magistretti PJ, Morrison JH. Noradrenaline- and vasoactive intestinal peptide–containing neuronal systems in neocortex: functional convergence with contrasting morphology. Neuroscience. 1988;24:367-378.
14 Sibson NR, Dhankhar A, Mason GF, et al. Stoichiometric coupling of brain glucose metabolism and glutamatergic neuronal activity. Proc Natl Acad Sci U S A. 1998;95:316-321.
15 Shulman RG, Rothman DL. Interpreting functional imaging studies in terms of neurotransmitter cycling. Proc Natl Acad Sci U S A. 1998;95:11993-11998.
16 Shulman RG, Rothman DL, Behar KL, et al. Energetic basis of brain activity: implications for neuroimaging. Trends Neurosci. 2004;27:489-495.
17 Hyder F, Patel AB, Gjedde A, et al. Neuronal-glial glucose oxidation and glutamatergic-GABAergic function. J Cereb Blood Flow Metab. 2006;26:865-877.
18 Gusnard DA, Raichle ME. Searching for a baseline: functional imaging and the resting human brain. Nat Rev Neurosci. 2001;2:685-694.
19 Gjedde A, Marrett S, Vafaee M. Oxidative and nonoxidative metabolism of excited neurons and astrocytes. J Cereb Blood Flow Metab. 2002;22:1-14.
20 Whittam R. The dependence of the respiration of brain cortex on active cation transport. Biochem J. 1962;82:205-212.
21 Baker PF, Connelly CM. Some properties of the external activation site of the sodium pump in crab nerve. J Physiol (Lond). 1966;185:270-297.
22 Ritchie JM. The oxygen consumption of mammalian non-myelinated fibres at rest and during activity. J Physiol (Lond). 1967;188:309-329.
23 Hertz L, Schousboe A. Ion and energy metabolism of the brain at the cellular level. Int Rev Neurobiol. 1975;18:141-211.
24 Mata M, Fink DG, Gainer H, et al. Activity-dependent energy metabolism in rat posterior pituitary primarily reflects sodium pump activity. J Neurochem. 1980;34:213-215.
25 McIlwain H. Metabolic response in vitro to electrical stimulation of section. Biochem J. 1951;49:382-393.
26 Shalit MN, Beller AJ, Feinsod M, et al. The blood flow and oxygen consumption of the dying brain. Neurology. 1970;20:740-748.
27 Shalit MN, Beller AJ, Feinsod M. Clinical equivalents of cerebral oxygen consumption in coma. Neurology. 1972;22:155-160.
28 Brodersen P, Jørgensen EO. Cerebral blood flow and oxygen uptake, and cerebrospinal fluid biochemistry in severe coma. J Neurol Neurosurg Psychiatry. 1974;37:384-391.
29 Sokoloff L, Reivich M, Kennedy C, et al. The [14C]deoxyglucose method for the measurement of local cerebral glucose utilization: theory, procedure, and normal values in the conscious and anesthetized albino rat. J Neurochem. 1977;28:897-916.
30 Levy DE, Sidtis JJ, Rottenberg DA, et al. Differences in cerebral blood flow and glucose utilization in vegetative versus locked-in patients. Ann Neurol. 1987;22:673-682.
31 Alkire MT, Haier RJ, Barker SJ, et al. Cerebral metabolism during propofol anesthesia in humans studied with positron emission tomography. Anesthesiology. 1995;82:393-403.
32 Alkire MT, Haier RJ, Shah NK, et al. Positron emission tomography study of regional cerebral metabolism in humans during isoflurane anesthesia. Anesthesiology. 1997;86:549-557.
33 Alkire MT, Pomfrett CJ, Haier RJ, et al. Functional brain imaging during anesthesia in humans: effects of halothane on global and regional cerebral glucose metabolism. Anesthesiology. 1999;90:701-709.
34 Harper ME, Green K, Brand MD. The efficiency of cellular energy transduction and its implications for obesity. Annu Rev Nutr. 2008;28:13-33.
35 Mehta SL, Li PA. Neuroprotective role of mitochondrial uncoupling protein 2 in cerebral stroke. J Cereb Blood Flow Metab. 2009;29:1069-1078.
36 Brand MD. The efficiency and plasticity of mitochondrial energy transduction. Biochem Soc Trans. 2005;33:897-904.
37 Attwell D, Laughlin SB. An energy budget for signaling in the grey matter of the brain. J Cereb Blood Flow Metab. 2001;21:1133-1145.
38 Attwell D, Iadecola C. The neural basis of functional brain imaging signals. Trends Neurosci. 2002;25:621-625.
39 Gjedde A, Johannsen P, Cold GE, et al. Cerebral metabolic response to low blood flow: possible role of cytochrome oxidase inhibition. J Cereb Blood Flow Metab. 2005;25:1183-1196.
40 Roland PE, Eriksson L, Stone-Elander S, et al. Does mental activity change the oxidative metabolism of the brain? J Neurosci. 1987;8:2373-2389.
41 Gjedde A. Blood-brain glucose transfer. In: Bradbury MWB, editor. Handbook of Experimental Pharmacology. Berlin Heidelberg: Springer-Verlag; 1992:65-115.
42 Drewes L. Transport of brain fuels, glucose and lactate. In: Paulson OB, Knudsen GM, Moos T, editors. Brain Barrier Systems, Alfred Benzon Symposium 45. Copenhagen: Munksgaard; 1999:285-295.
43 Maher F, Vannucci SJ, Simpson IA. Glucose transporter isoforms in brain: absence of GLUT3 from the blood-brain barrier. J Cereb Blood Flow Metab. 1993;13:342-345.
44 Vannucci SJ. Developmental expression of GLUT1 and GLUT3 glucose transporters in rat brain. J Neurochem. 1994;62:240-246.
45 Silver IA, Erecinska M. Energetic demands of the Na+/K+ ATPase in mammalian astrocytes. Glia. 1997;21:35-45.
46 Gjedde A. Modulation of substrate transport to the brain. Acta Neurol Scand. 1983;67:3-25.
47 Simpson IA, Carruthers A, Vannucci SJ. Supply and demand in cerebral energy metabolism: the role of nutrient transporters. J Cereb Blood Flow Metab. 2007;27:1766-1791.
48 Silver IA, Erecinska M. Extracellular glucose concentration in mammalian brain: continous monitoring of changes during increased neuronal activity and upon limitation in oxygen supply in normo-, hypo-, and hyperglycemic animals. J Neurosci. 1994;14:5068-5076.
49 Gjedde A, Crone C. Induction processes in blood-brain transfer of ketone bodies during starvation. Am J Physiol. 1975;229:1165-1169.
50 Oldendorf WH. Carrier-mediated blood-brain barrier transport of short-chain monocarboxylic organic acids. Am J Physiol. 1973;224:1450-1453.
51 Halestrap AP. The mitochondrial pyruvate carrier. Biochem J. 1975;148:85-96.
52 Poole RC, Halestrap AP. Transport of lactate and other monocarboxylates across mammalian plasma membranes. Am J Physiol. 1993;264:C761-C782.
53 Halestrap AP, Price NT. The proton-linked monocarboxylate transporter (MCT) family: structure, function and regulation. Biochem J. 1999;343:281-299.
54 Halestrap AP, Meredith D. The SLC16 gene family—from monocarboxylate transporters (MCTs) to aromatic amino acid transporters and beyond. Pflugers Arch. 2004;447:619-628.
55 Drewes LR. Molecular architecture of the brain microvasculature: perspective on blood-brain transport. J Mol Neurosci. 2002;16:93-98.
56 Hertz L, Dienel GA. Lactate transport and transporters: general principles and functional roles in brain cells. J Neurosci Res. 2005;79:11-18.
57 Pellerin L, Magistretti PJ. Ampakine CX546 bolsters energetic response of astrocytes: a novel target for cognitive-enhancing drugs acting as alpha-amino-3-hydroxy-5-methyl-4-isoxazolepropionic acid (AMPA) receptor modulators. J Neurochem. 2005;92:668-677.
58 Broer S, Rahman B, Pellegri G, et al. Comparison of lactate transport in astroglial cells and monocarboxylate transporter 1 (MCT 1) expressing Xenopus laevis oocytes. Expression of two different monocarboxylate transporters in astroglial cells and neurons. J Biol Chem. 1997;272:30096-30102.
59 Bergersen LH, Magistretti PJ, Pellerin L. Selective postsynaptic co-localization of MCT2 with AMPA receptor GluR2/3 subunits at excitatory synapses exhibiting AMPA receptor trafficking. Cereb Cortex. 2005;15:361-370.
60 Bergersen L, Rafiki A, Ottersen OP. Immunogold cytochemistry identifies specialized membrane domains for monocarboxylate transport in the central nervous system. Neurochem Res. 2002;27:89-96.
61 Bröer S, Bröer A, Schneider HP, et al. Characterization of the high-affinity monocarboxylate transporter MCT2 in Xenopus laevis oocytes. Biochem J. 1999;341:529-535.
62 Dimmer KS, Friedrich B, Lang F, et al. The low-affinity monocarboxylate transporter MCT4 is adapted to the export of lactate in highly glycolytic cells. Biochem J. 2000;350:219-227.
63 Chatton JY, Marquet P, Magistretti PJ. A quantitative analysis of L-glutamate–regulated Na+ dynamics in mouse cortical astrocytes: implications for cellular bioenergetics. Eur J Neurosci. 2000;12:3843-3853.
64 Pierre K, Chatton JY, Parent A, et al. Eur J Neurosci. 2009;29:1951-1963.
65 Pardridge WM. Transport of nutrients and hormones through the blood-brain barrier. Diabetolgia. 1981;20:246-254.
66 Cremer JE, Cunningham VJ, Pardridge WM, et al. Kinetics of blood-brain barrier transport of pyruvate, lactate and glucose in suckling, weanling and adult rats. J Neurochem. 1979;33:439-446.
67 Gjedde A, Marrett S. Glycolysis in neurons, not astrocytes, delays oxidative metabolism of human visual cortex during sustained checkerboard stimulation in vivo. J Cereb Blood Flow Metab. 2001;21:1384-1392.
68 Brooks GA, Brown MA, Butz CE, et al. Cardiac and skeletal muscle mitochondria have a monocarboxylate transporter MCT1. J Appl Physiol. 1999;87:1713-1718.
69 Hashimoto T, Hussien R, Cho H-S, et al. Evidence for the mitochondrial lactate oxidation complex in rat neurons: demonstration of an essential component of brain lactate shuttles. PLoS ONE. 2008;3(8):e2915.
70 LaNoue KF, Schoolwerth AC. Metabolite transport in mitochondria. Annu Rev Biochem. 1979;48:871-922.
71 Nalecz KA, Kaminska J, Nalecz MJ, et al. The activity of pyruvate carrier in a reconstituted system: substrate specificity and inhibitor sensitivity. Arch Biochem Biophys. 1992;297:162-168.
72 Halestrap AP. Stimulation of pyruvate transport in metabolizing mitochondria through changes in the transmembrane pH gradient induced by glucagon treatment of rat. Biochem J. 1978;172:389-398.
73 Halestrap AP, Armston AE. A re-evaluation of the role of mitochondrial pyruvate transport in the hormonal control of rat liver mitochondrial pyruvate metabolism. Biochem J. 1984;223:677-685.
74 Shearman MS, Halestrap AP. The concentration of the mitochondrial pyruvate carrier in rat liver and heart mitochondria determined with alpha-cyano-beta-(1-phenylindol-3-yl) acrylate. Biochem J. 1984;223:673-676.
75 Gjedde A, Ohta S, Kuwabara H, et al. Is oxygen diffusion limiting for blood-brain transfer of oxygen? In: Lassen NA, Ingvar DH, Raichle ME, et al, editors. Brain Work and Mental Activity, Alfred Benzon Symposium 31. Copenhagen: Munksgaard; 1991:177-184.
76 Kassissia IG, Goresky CA, Rose CP, et al. Tracer oxygen distribution is barrier-limited in the cerebral microcirculation. Circ Res. 1995;77:1201-1211.
77 Buxton R, Frank R. A model for the coupling between cerebral blood flow and oxygen consumption during neuronal stimulation. J Cereb Blood Flow Metab. 1997;17:64-72.
78 Gjedde A. The relation between brain function and cerebral blood flow and metabolism. In: Batjer HH, editor. Cerebrovascular Disease. New York: Lippincott-Raven; 1997:23-40.
79 Vafaee MS, Meyer E, Gjedde A. Impaired activation of oxygen consumption and blood flow in visual cortex of patients with mitochondrial encephalomyopathy. Ann Neurol. 2000;48:676-679.
80 Gjedde A. Blood-brain transfer and metabolism of oxygen. In: Dermietzel R, Spray DC, Nedergaard M, editors. Blood-Brain Barriers. New York: Wiley-VCHO, 2006.
81 Balaban RS, Kantor HL, Katz LA, et al. Relation between work and phosphate metabolites in the in vivo paced mammalian heart. Science. 1986;232:1121-1123.
82 Matthews PM, Bland JL, Gadian DG, et al. The steady-state rate of ATP synthesis in the perfused rat heart measured by 31P NMR saturation transfer. Biochem Biophys Res Commun. 1981;103:1052-1059.
83 Detre JA, Koretsky AP, Williams DS, et al. Absence of pH changes during altered work in the in vivo sheep heart: a 31P-NMR investigation. J Mol Cell Cardiol. 1990;22:543-553.
84 Detre JA, Williams DS, Koretsky AP. Nuclear magnetic resonance determination of flow, lactate, and phosphate metabolites during amphetamine stimulation of the rat brain. Nucl Magn Res Biomed. 1990;3:272-278.
85 Wyss M, Smeitink J, Wevers RA, et al. Mitochondrial creatine kinase: a key enzyme of aerobic energy metabolism. Biochim Biophys Acta. 1992;1102:119-166.
86 Roth K, Weiner MW. Determination of cytosolic ADP and AMP concentrations and the free energy of ATP hydrolysis in human muscle and brain tissues with 31P NMR spectroscopy. Magn Reson Med. 1991;22:505-511.
87 Mora BN, Narasimhan PT, Ross BD. 31P magnetization transfer studies in the monkey brain. Magn Reson Med. 1992;26:100-115.
88 Fedosov SN. Creatine–creatine phosphate shuttle modeled as two-compartment system at different levels of creatine kinase activity. Biochim Biophys Acta. 1994;1208:238-246.
89 O’Brien J, Kla KM, Hopkins IB, et al. Kinetic parameters and lactate dehydrogenase isozyme activities support possible lactate utilization by neurons. Neurochem Res. 2007;32:597-607.
90 Kaplan NO, Everse J. Regulatory characteristics of lactate dehydrogenases. Adv Enzyme Regul. 1972;10:323-336.
91 Newsholme EA, Crabtree B. Theoretical principles in the approaches to control of metabolic pathways and their application to glycolysis in muscle. J Mol Cell Cardiol. 1979;11:839-856.
92 Tholey G, Roth-Schechter BF, Mandel P. Activity and isoenzyme pattern of lactate dehydrogenase in neurons and astroblasts cultured from brains of chick embryos. J Neurochem. 1981;36:77-81.
93 Bittar PG, Charnay Y, Pellerin L, et al. Selective distribution of lactate dehydrogenase isoenzymes in neurons and astrocytes of human brain. J Cereb Blood Flow Metab. 1996;16:1079-1089.
94 Laughton JD, Charnay Y, Belloir B, et al. Differential messenger RNA distribution of lactate dehydrogenase LDH-1 and LDH-5 isoforms in the rat brain. Neuroscience. 2000;96:619-625.
95 Van Hall G. Lactate as a fuel for mitochondrial respiration. Acta Physiol Scand. 2000;168:643-656.
96 Himwich HE, Fazekas JF. Effect of hypoglycemia on metabolism of brain. Endocrinology. 1937;21:800-807.
97 Gibbs EL, Lennox WG, Nims LF, et al. Arterial and cerebral venous blood; arterial-venous differences in man. J Biol Chem. 1942;144:325-332.
98 Himwich WA, Himwich HE. Pyruvic acid exchange of brain. J Neurophysiol. 1946;9:133-136.
99 Brandt RB, Laux JE, Spainhour SE, et al. Lactate dehydrogenase in rat mitochondria. Arch Biochem Biophys. 1987;259:412-422.
100 Brooks GA, Dubouchaud H, Brown M, et al. Role of mitochondrial lactate dehydrogenase and lactate oxidation in the intracellular lactate shuttle. Proc Natl Acad Sci U S A. 1999;96:1129-1134.
101 Denton RM, McCormack JG. Ca transport by mammalian mitochondria and its role in hormone action. Am J Physiol. 1985;249:E543-E554.
102 Zonta M, Angulo MC, Gobbo1 S, et al. Neuron-to-astrocyte signaling is central to the dynamic control of brain microcirculation. Nat Neurosci. 2003;6:43-50.
103 Clapham DE. Calcium signalling. Cell. 1995;80:259-268.
104 Pullman ME, Penefsky HS, Datta A, et al. Partial resolution of the enzymes catalyzing oxidative phosphorylation. I. Purification and properties of soluble dinitrophenol–stimulated adenosine triphosphatase. J Biol Chem. 1960;235:3322-3329.
105 Erecinska M, Veech RL, Wilson DF. Thermodynamic relationships between the oxidation-reduction reactions and the ATP synthesis in suspensions of isolated pigeon heart mitochondria. Arch Biochem Biophys. 1974;160:412-421.
106 Erecinska M, Wilson DF. Regulation of cellular energy metabolism. J Membr Biol. 1982;70:1-14.
107 Wang H, Oster G. Energy transduction in the F1 motor of ATP synthase. Nature. 1998;396:279-282.
108 Springett R, Wylezinska M, Cady EB, et al. Oxygen dependency of cerebral oxidative phosphorylation in newborn piglets. J Cereb Blood Flow Metab. 2000;20:280-289.
109 LaNoue KF, Jeffries FM, Radda GK. Kinetic control of mitochondrial ATP synthesis. Biochemistry. 1986;25:7667-7675.
110 Anderson DP, Allen WJ, Barcroft H, et al. Circulatory changes during fainting and coma caused by oxygen lack. J Physiol. 1946;104:426-434.
111 Cremer JE. The influence of liver-bypass on transport and compartmentation in vivo. Adv Exp Med Biol. 1976;69:95-102.
112 Vandenberg RJ. Molecular pharmacology and physiology of glutamate transporters in the central nervous system. Clin Exp Pharmacol Physiol. 1998;25:393-400.
113 Rothstein JD, Dykes Hoberg M, Pardo CA, et al. Knockout of glutamate transporters reveals a major role for astroglial transport in excitotoxicity and clearance of glutamate. Neuron. 1996;16:675-686.
114 Tanaka K, Watase K, Manabe T, et al. Epilepsy and exacerbation of brain injury in mice lacking the glutamate transporter GLT-1. Science. 1997;276:1699-1702.
115 Chatton JY, Marquet P, Magistretti PJ. A quantitative analysis of L-glutamate–regulated Na+ dynamics in mouse cortical astrocytes: implications for cellular bioenergetics. Eur J Neurosci. 2000;12:3843-3853.
116 Pellerin L, Magistretti PJ. Glutamate uptake stimulates Na+/K+-ATPase activity in astrocytes via activation of a distinct subunit highly sensitive to ouabain. J Neurochem. 1997;69:2132-2137.
117 Magistretti PJ, Chatton J-Y. Relationship between L-glutamate–regulated intracellular Na+ dynamics and ATP hydrolysis in astrocytes. J Neural Transm. 2005;112:77-85.
118 Pellerin L, Magistretti PJ. Glutamate uptake into astrocytes stimulates aerobic glycolysis: a mechanism coupling neuronal activity to glucose utilization. Proc Natl Acad Sci U S A. 1994;91:10625-10629.
119 Bittar PG, Charnay Y, Pellerin L, et al. Selective distribution of lactate dehydrogenase isoenzymes in neurons and astrocytes of human brain. J Cereb Blood Flow Metab. 1996;16:1079-1089.
120 Magistretti PJ. Neuron-glia metabolic coupling and plasticity. J Exp Biol. 2006;209:2304-2311.
121 Pellerin L, Bouzier-Sore AK, Aubert A, et al. Activity-dependent regulation of energy metabolism by astrocytes: an update. Glia. 2007;55:1251-1262.
122 Cholet N, Pellerin L, Welker E, et al. Local injection of antisense oligonucleotides targeted to the glial glutamate transporter GLAST decreases the metabolic response to somatosensory activation. J Cereb Blood Flow Metab. 2001;21:404-412.
123 Voutsinos-Porche B, Bonvento G, Tanaka K, et al. Glial glutamate transporters mediate a functional metabolic crosstalk between neurons and astrocytes in the mouse developing cortex. Neuron. 2003;37:1-20.
124 Hertz L, Peng L, Dienel GA. Energy metabolism in astrocytes: high rate of oxidative metabolism and spatiotemporal dependence on glycolysis/glycogenolysis. J Cereb Blood Flow Metab. 2007;27:219-249.
125 Magistretti PJ, Cardinaux JR, Martin JL. VIP and PACAP in the CNS: regulators of glial energy metabolism and modulators of glutamatergic signaling. Ann N Y Acad Sci. 1998;865:213-225.
126 Magistretti PJ, Pellerin L, Rothman DL, et al. Energy on demand. Science. 1999;283:496-497.
127 Lovatt D, Sonnewald U, Waagepetersen HS, et al. The transcriptome and metabolic gene signature of protoplasmic astrocytes in the adult murine cortex. J Neurosci. 2007;27:12255-12266.
128 Alves PM, McKenna MC, Sonnewald U. Lactate metabolism in mouse brain astrocytes studied by [13C]NMR spectroscopy. Neuroreport. 1995;6:2201-2204.
129 Wyss MT, Weber B, Treyer V, et al. Stimulation-induced increases of astrocytic oxidative metabolism in rats and humans investigated with 1-11C-acetate. J Cereb Blood Flow Metab. 2009;29:44-56.
130 Berkich DA, Ola MS, Cole J, et al. Mitochondrial transport proteins of the brain. J Neurosci Res. 2007;85:3367-3377.
131 Xu Y, Ola MS, Berkich DA, et al. Energy sources for glutamate neurotransmission in the retina: absence of the aspartate/glutamate carrier produces reliance on glycolysis in glia. J Neurochem. 2007;101:120-131.
132 Itoh Y, Esaki T, Shimoji K, et al. Dichloroacetate effects on glucose and lactate oxidation by neurons and astroglia in vitro and on glucose utilization by brain in vivo. Proc Natl Acad Sci U S A. 2003;100:4879-4884.
133 Fields HM, Rinaman L, Devaskar SU. Distribution of glucose transporter isoform-3 and hexokinase I in the postnatal murine brain. Brain Res. 1999;846:260-264.
134 Herrero-Mendez A, Almeida A, Fernández E, et al. The bioenergetic and antioxidant status of neurons is controlled by continuous degradation of a key glycolytic enzyme by APC/C-Cdh1. Nat Cell Biol. 2009;11:747-752.
135 Silver IA, Erecinska M. Energetic demands of the Na+/K+ ATPase in mammalian astrocytes. Glia. 1997;21:35-45.
136 Nehlig A, Wittendorp-Rechenmann E, Lam CD. Selective uptake of [14C]2-deoxyglucose by neurons and astrocytes: high-resolution microautoradiographic imaging by cellular 14C-trajectography combined with immunohistochemistry. J Cereb Blood Flow Metab. 2004;24:1004-1014.
137 Rabinowicz T, Petetot JM, Gartside PS, et al. Structure of the cerebral cortex in men and women. J Neuropathol Exp Neurol. 2002;61:46-57.
138 Norenberg MD. Astrocyte responses to CNS injury. J Neuropathol Exp Neurol. 1994;53:213-220.
139 Benesova J, Hock M, Butenko O, et al. Quantification of astrocyte volume changes during ischemia in situ reveals two populations of astrocytes in the cortex of GFAP/EGFP mice. J Neurosci Res. 2009;87:96-111.
140 Sokoloff L. Energetics of functional activation in neural tissues. Neurochem Res. 1999;24:321-329.
141 Hassel B, Bråthe A. Cerebral metabolism of lactate in vivo: evidence for neuronal pyruvate carboxylation. J Cereb Blood Flow Metab. 2000;20:327-336.
142 Pysh JJ, Khan T. Variations in mitochondrial structure and content of neurons and neuroglia in rat brain: an electron microscopic study. Brain Res. 1972;36:1-18.
143 Wong-Riley MT. Cytochrome oxidase: an endogenous metabolic marker for neuronal activity. Trends Neurosci. 1989;12:94-101.
144 Fields HM, Rinaman L, Devaskar SU. Distribution of glucose transporter isoform-3 and exokinase I in the postnatal murine brain. Brain Res. 1999;846:260-264.
145 Loaiza A, Porras OH, Barros LF. Glutamate triggers rapid glucose transport stimulation in astrocytes as evidenced by real-time confocal microscopy. J Neurosci. 2003;23:7337-7342.
146 Porras OH, Loaiza A, Barros LF. Glutamate mediates acute glucose transport inhibition in hippocampal neurons. J Neurosci. 2004;24:9669-9673.
147 Poitry-Yamate CL, Poitry S, Tsacopoulos M. Lactate released by Muller glial cells is metabolized by photoreceptors from mammalian retina. J Neurosci. 1995;15:5179-5191.
148 Fodor JA. The Modularity of Mind. Cambridge: MIT Press; 1983.
149 Fodor JA. The Mind Doesn’t Work That Way. Cambridge: MIT Press; 2000.
150 Erecinska M, Nelson D, Chance B. Depolarization-induced changes in cellular energy production. Proc Natl Acad Sci U S A. 1991;88:7600-7604.
151 Bowers C, Zigmond R. Localization of neurons in the rat superior cervical ganglion that project into different postganglionic trunks. J Comp Neurol. 1979;185:381-391.
152 Yarowsky PJ, Ingvar DH. Neuronal activity and energy metabolism. Fed Proc. 1981;40:2353-2362.
153 Kadekaro M, Crane AM, Sokoloff L. Differential effects of electrical stimulation of sciatic nerve on metabolic activity in spinal cord and dorsal root ganglion in the rat. Proc Natl Acad Sci U S A. 1985;82:6010-6013.
154 Madsen PL, Schmidt JF, Holm S, et al. Mental stress and cognitive performance do not increase overall level of cerebral O2 uptake in humans. J Appl Physiol. 1992;73:420-426.
155 Paulson OB. Blood-brain barrier, brain metabolism and cerebral blood flow. Eur Neuropsychopharmacol. 2002;12:495-501.
156 Fox PT, Raichle ME. Focal physiological uncoupling of cerebral blood flow and oxidative metabolism during somatosensory stimulation in human subjects. Proc Natl Acad Sci U S A. 1986;83:1140-1144.
157 Fox PT, Raichle ME, Mintun MA, et al. Nonoxidative glucose consumption during focal physiological activity. Science. 1988;241:462-464.
158 Seitz RJ, Roland PE. Vibratory stimulation increases and decreases the regional cerebral blood flow and oxidative metabolism: a positron emission tomography (PET) study. Acta Neurol Scand. 1992;86:60-67.
159 Fujita H, Kuwabara H, Reutens DC, et al. Oxygen consumption of cerebral cortex fails to increase during continued vibrotactile stimulation. J Cereb Blood Flow Metab. 1999;19:266-271.
160 Kuwabara H, Ohta S, Brust P, et al. Density of perfused capillaries in living human brain during functional activation. Prog Brain Res. 1992;91:209-215.
161 Ginsberg MD, Chang JY, Kelley RE, et al. Increases in both cerebral glucose utilization and blood flow during execution of a somatosensory task. Ann Neurol. 1988;23:152-160.
162 Raichle ME, Grubb RLJr, Gado MH, et al. Correlation between regional cerebral blood flow and oxidative metabolism. In vivo studies in man. Arch Neurol. 1976;33:523-526.
163 Marrett S, Gjedde A. Changes of blood flow and oxygen consumption in visual cortex of living humans. Adv Exp Med Biol. 1997;413:205-208.
164 Vafaee MS, Gjedde A. Model of blood-brain transfer of oxygen explains non-linear flow-metabolism coupling during stimulation of visual cortex. J Cereb Blood Flow Metab. 2000;20:747-754.
165 Ohta S, Reutens DC, Gjedde A. Brief vibrotactile stimulation does not increase cortical oxygen consumption when measured by single inhalation of positron emitting oxygen. J Cereb Blood Flow Metab. 1999;19:260-265.
166 Borowsky IW, Collins RC. Metabolic anatomy of brain: a comparison of regional capillary density, glucose metabolism and enzyme activities. J Comp Neurol. 1989;288:401-413.
167 van Eijsden P, Hyder F, Rothman DL, et al. Neurophysiology of functional imaging. Neuroimage. 2009;45:1047-1054.
168 Pette D. Metabolic heterogeneity of muscle fibres. J Exp Biol. 1985;115:179-189.
169 Hevner RF, Liu S, Wong-Riley MT. A metabolic map of cytochrome oxidase in the rat brain: histochemical, densitometric and biochemical studies. Neuroscience. 1995;65:313-342.
170 Lane N. A unifying view of ageing and disease: the double-agent theory. J Theor Biol. 2003;225:531-540.
171 Dienel GA, Cruz NF. Nutrition during brain activation: does cell-to-cell lactate shuttling contribute significantly to sweet and sour food for thought? Neurochem Int. 2004;45:321-351.
172 Ide K, Schmalbruch IK, Quistorff B, et al. Lactate, glucose and O2 uptake in human brain during recovery from maximal exercise. J Physiol. 2000;522:159-164.
173 Kasischke KA, Vishwasrao HD, Fisher PJ, et al. Neural activity triggers neuronal oxidative metabolism followed by astrocytic glycolysis. Science. 2004;305:99-103.
174 Gjedde A. Brain energy metabolism and the physiological basis of the hemodynamic response. In: Jezzard P, Matthews PM, Smith S, editors. Functional Magnetic Resonance Imaging: Methods for Neuroscience. Oxford: Oxford University Press; 2001:37-65.
175 Ohta S, Meyer E, Gjedde A. Cerebral [15O]water clearance in humans determined by PET. I. Theory and normal values. J Cereb Blood Flow Metab. 1996;16:765-780.
176 Gjedde A. PET criteria of cerebral tissue viability in ischemia. Acta Neurol Scand Suppl. 1996;166:3-5.
177 Honig CR, Connett RJ, Gayeski TE. O2 transport and its interaction with metabollism; a systems view of aerobic capacity. Med Sci Sports Exerc. 1992;24:47-53.
178 Gjedde A, Kuwabara H, Hakim A. Reduction of functional capillary density in human brain after stroke. J Cereb Blood Flow Metab. 1990;10:317-326.
179 Ogawa S, Lee TM, Nayak AS, et al. Oxygenation-sensitive contrast in magnetic resonance imaging of rodent brain at high magnetic fields. Magn Reson Med. 1990;14:68-78.
180 Ogawa S, Lee TM, Kay AR, et al. Brain magnetic resonance imaging with contrast dependent on blood oxygenation. Proc Natl Acad Sci U S A. 1990;87:9868-9872.
181 Kwong KK, Belliveau JW, Chesler DA, et al. Dynamic magnetic resonance imaging of human brain activity during primary sensory stimulation. Proc Natl Acad Sci U S A. 1992;89:5675-5679.
182 Ogawa S, Menon RS, Tank DW, et al. Functional brain mapping by blood oxygenation level–dependent contrast magnetic resonance imaging. A comparison of signal characteristics with a biophysical model. Biophys J. 1993;64:803-812.
183 Gjedde A, Poulsen PH, Østergaard L. On the oxygenation of hemoglobin in the human brain. Adv Exp Med Biol. 1999;471:67-81.
184 Ito H, Ibaraki M, Kanno I, et al. Changes in cerebral blood flow and cerebral oxygen metabolism during neural activation measured by positron emission tomography: comparison with blood oxygenation level–dependent contrast measured by functional magnetic resonance imaging. J Cereb Blood Flow Metab. 2005;25:371-377.
185 Newberg AB, Wang J, Rao H, et al. Concurrent CBF and CMRGlc changes during human brain activation by combined fMRI-PET scanning. Neuroimage. 28. 2005:500-506.
186 Himmelbach M, Erb M, Karnath HO. Activation of superior colliculi in humans during visual exploration. BMC Neurosci. 2007;8:66.
187 Luh WM, Wong EC, Bandettini PA, et al. Comparison of simultaneously measured perfusion and BOLD signal increases during brain activation with T(1)-based tissue identification. Magn Reson Med. 2000;44:137-143.
188 Gjedde A. Functional brain imaging celebrates 30th anniversary. Acta Neurol Scand. 2008;117:219-223.
189 Gnaiger E. Homeostatic and microxic regulation of respiration in transitions to anaerobic metabolism. In: Bicudo JEPW, editor. The Vertebrate Gas Transport Cascade: Adaptations to Environment and Mode of Life. Boca Raton, FL: CRC Press; 1993:358-370.
190 Gnaiger E, Lassnig B, Kuznetsov A, et al. Mitochondrial oxygen affinity, respiratory flux control and excess capacity of cytochrome c oxidase. J Exp Biol. 1998;201:1129-1139.
191 Brown GC. Regulation of mitochondrial respiration by nitric oxide inhibition of cytochrome c oxidase. Biochim Biophys Acta. 2001;1504:46-57.
192 Mason MG, Nicholls P, Wilson MT, et al. Nitric oxide inhibition of respiration involves both competitive (heme) and noncompetitive (copper) binding to cytochrome c oxidase. Proc Natl Acad Sci U S A. 2006;103:708-713.
193 Thompson JK, Peterson MR, Freeman RD. Single-neuron activity and tissue oxygenation in the cerebral cortex. Science. 2003;299:1070-1072.
194 Rasmussen P, Dawson EA, Nybo L, et al. Capillary-oxygenation-level–dependent near-infrared spectrometry in frontal lobe of humans. J Cereb Blood Flow Metab. 2007;27:1082-1093.
195 Rasmussen P, Overgaard A, Bjerre AF, et al. The effects of normoxia, hypoxia, and hyperoxia on cerebral haemoglobin saturation using near infrared spectroscopy during maximal exercise. Int J Ind Ergon, online 26 July 2008.
196 Barach AL, Kagan J. Disorders of mental functioning produced by varying the oxygen tension of the atmosphere. I. Effects of low oxygen atmospheres on normal individuals and patients with psychoneurotic disease. Psychosom Med. 1940;2:55-67.
197 Nybo L, Rasmussen P. Inadequate cerebral oxygen delivery and central fatigue during strenuous exercise. Exerc Sport Sci Rev. 2007;35:110-118.
198 Göbel U, Theilen H, Schröck H, et al. Dynamics of capillary perfusion in the brain. Blood Vessels. 1991;28:190-196.
199 Kuschinsky W, Paulson OB. Capillary circulation in the brain. Cerebrovasc Brain Metab Rev. 1992;4:261-286.
200 Kuschinsky W. Capillary perfusion in the brain. Pflugers Arch. 1996;432(3 suppl):R42-R46.
201 Iadecola C. Does nitric oxide mediate the increases in cerebral blood flow elicited by hypercapnia? Proc Natl Acad Sci U S A. 1992;89:3913-3916.
202 Iadecola C, Pelligrino DA, Moskowitz MA, et al. Nitric oxide synthase inhibition and cerebrovascular regulation. J Cereb Blood Flow Metab. 1994;14:175-192.
203 Fabricius M, Lauritzen M. Examination of the role of nitric oxide for the hypercapnic rise of cerebral blood flow in rats. Am J Physiol. 1994;266:H1457-H1464.
204 Villringer A, Dirnagl U. Coupling of brain activity and cerebral blood flow: basis of functional neuroimaging. Cerebrovasc Brain Metab Rev. 1995;7:240-276.
205 Connett RJ, Gayeski TE, Honig CR. Energy sources in fully aerobic rest-work transitions: a new role for glycolysis. Am J Physiol. 1985;248:H922-H929.
206 Laptook AR, Peterson J, Porter AM. Effects of lactic acid infusions and pH on cerebral blood flow and metabolism. J Cereb Blood Flow Metab. 1988;8:193-200.
207 Iadecola C. Neurovascular regulation in the normal brain and in Alzheimer’s disease. Nat Rev Neurosci. 2004;5:347-360.
208 Wang SZ, Zhu SZ, el-Fakahany EE. Efficient coupling of M5 muscarinic acetylcholine receptors to activation of nitric oxide synthase. J Pharmacol Exp Ther. 1994;268:552-557.
209 Elhusseiny A, Cohen Z, Olivier A, et al. Functional acetylcholine muscarinic receptor subtypes in human brain microcirculation: identification and cellular localization. J Cereb Blood Flow Metab. 1999;19:794-802.
210 Elhusseiny A, Hamel E. Muscarinic—but not nicotinic—acetylcholine receptors mediate a nitric oxide–dependent dilation in brain cortical arterioles: a possible role for the M5 receptor subtype. J Cereb Blood Flow Metab. 2000;20:298-305.
211 Buerk DG, Ances BM, Greenberg JH, et al. Temporal dynamics of brain tissue nitric oxide during functional forepaw stimulation in rats. Neuroimage. 2003;18:1-99.
212 Buerk DG. Letter to the Editor [reply]. Neuroimage. 2003;20:613-614.
213 Ogawa M, Magata Y, Ouchi Y, et al. Scopolamine abolishes cerebral blood flow response to somatosensory stimulation in anesthetized cats: PET study. Brain Res. 1994;650:249-252.
214 Ayata C, Ma J, Meng W, et al. L-NA–sensitive rCBF augmentation during vibrissal stimulation in type III nitric oxide synthase mutant mice. J Cereb Blood Flow Metab. 1996;16:539-541.
215 Ma J, Ayata C, Huang PL, et al. Regional cerebral blood flow response to vibrissal stimulation in mice lacking type I NOS gene expression. Am J Physiol. 1996;270:H1085-H1090.
216 Cholet N, Seylaz J, Lacombe P, et al. Local uncoupling of the cerebrovascular and metabolic responses to somatosensory stimulation after neuronal nitric oxide synthase inhibition. J Cereb Blood Flow Metab. 1997;17:1191-1201.
217 Lindauer U, Megow D, Matsuda H, et al. Nitric oxide: a modulator, but not a mediator, of neurovascular coupling in rat somatosensory cortex. Am J Physiol. 1999;277:H799-H811.
218 Reutens DC, McHugh MD, Toussaint PJ, et al. L-Arginine infusion increases basal but not activated cerebral blood flow in humans. J Cereb Blood Flow Metab. 1997;17:309-315.
219 Rasmussen M, Poulsen PH, Treiber A, et al. No influence of the endothelin receptor antagonist bosentan on basal and indomethacin-induced reduction of cerebral blood flow in pigs. Acta Anaesthesiol Scand. 2003;47:200-207.
220 Wang X, Takano T, Nedergaard M. Astrocytic calcium signaling: mechanism and implications for functional brain imaging. Methods Mol Biol. 2009;489:93-109.
221 Iadecola C, Nedergaard M. Glial regulation of the cerebral microvasculature. Nat Neurosci. 2007;10:1369-1376.
222 Gordon GR, Choi HB, Rungta RL, et al. Brain metabolism dictates the polatrity of astrocyte control over arterioles. Nature. 2008;456:745-749.
223 Metea MR, Kofuji P, Newman EA. Neurovascular coupling is not mediated by potassium siphoning from glial cells. J Neurosci. 2007;27:2468-2471.
224 Caesar K, Akgoren N, Mathiesen C, et al. Modification of activity-dependent increases in cerebellar blood flow by extracellular potassium in anaesthetized rats. J Physiol (Lond). 1999;520:281-292.
225 Erecinska M, Silver I. ATP and brain function. J Cereb Blood Flow Metab. 1989;9:2-19.
226 Chesler M, Kraig RP. Intracellular pH of astrocytes increases rapidly with cortical stimulation. Am J Physiol. 1987;253:R666-R670.
227 Chesler M, Kraig RP. Intracellular pH transients of mammalian astrocytes. J Neurosci. 1989;9:2011-2019.
228 Kraig RP. Astrocytic acid-base homeostasis in cerebral ischemia. In: Schurr A, Rigor BM, editors. Cerebral Ischemia and Resuscitation. Boca Raton, FL: CRC Press; 1990:89-99.
229 Connett RJ. Glycolytic regulation during aerobic rest-to-work transition in dog gracilis muscle. J Appl Physiol. 1987;63:2366-2374.
230 Robin ED, Murphy BJ, Theodore J. Coordinate regulation of glycolysis by hypoxia in mammalian cells. J Cell Physiol. 1984;118:287-290.
231 Gjedde A. On the measurement of glucose in brain. Neurochem Res. 1984;9:1667-1671.
232 Mathiesen C, Caesar K, Akgoren N, et al. Modification of activity-dependent increases of cerebral blood flow by excitatory synaptic activity and spikes in rat cerebellar cortex. J Physiol (Lond). 1998;512:555-566.
233 Vafaee MS, Meyer E, Marrett S, et al. Increased oxygen consumption in human visual cortex: response to visual stimulation. Acta Neurol Scand. 1998;98:85-89.
234 Vafaee MS, Meyer E, Marrett S, et al. Frequency-dependent changes in cerebral metabolic rate of oxygen during activation of human visual cortex. J Cereb Blood Flow Metab. 1999;19:272-277.
235 Rose SP. Cellular compartmentation of brain metabolism and its functional significance. J Neurosci Res. 1975;1:19-30.
236 Muir D, Berl S, Clarke DD. Acetate and fluoroacetate as possible markers for glial metabolism in vivo. Brain Res. 1986;380:336-340.
237 Bachelard HS, Brooks KJ, Garofalo O. Studies on the compartmentation of DOG metabolism in the brain. Neurochem Res. 1991;16:1025-1030.
238 Poitry-Yamate CL, Tsacopoulos M. Glucose metabolism in freshly isolated Muller glial cells from a mammalian retina. J Comp Neurol. 1992;320:257-266.
239 Eisenberg HM, Kadekaro M, Freeman S, et al. Metabolism in the globus pallidus after fetal implants in rats with nigral lesions. J Neurosurg. 1993;78:83-89.
240 Sokoloff L, Takahashi S, Gotoh J, et al. Contribution of astroglia to functionally activated energy metabolism. Dev Neurosci. 1996;18:344-352.
241 Ribak CE. The histochemical localization of cytochrome oxidase in the dentate gyrus of the rat hippocampal. Brain Res. 1981;212:169-174.
242 Gonzalez-Lima F, Jones D. Quantitative mapping of cytochrome oxidase activity in the central auditory system of the gerbil: a study with calibrated activity standards and metal-intensified histochemistry. Brain Res. 1994;660:34-49.
243 Snyder CD, Wilson JE. Relative levels of hexokinase in isolated neuronal, astrocytic, and oligodendroglial fractions from rat brain. J Neurochem. 1983;40:1178-1181.
244 Aoki C, Milner TA, Berger SB, et al. Glial glutamate dehydrogenase: ultrastructural localization and regional distribution in relation to the mitochondrial enzyme, cytochrome oxidase. J Neurosci Res. 1987;18:305-318.
245 Joliot M, Ribary U, Llinas R. Human oscillatory brain activity near 40 Hz coexists with cognitive temporal binding. Proc Natl Acad Sci U S A. 1994;91:11748-11751.
246 Pedroarena C, Llinas R. Dendritic calcium conductances generate high-frequency oscillation in thalamocortical neurons. Proc Natl Acad Sci U S A. 1997;94:724-728.
247 Kojima S, Nakamura T, Nidaira T, et al. Optical detection of synaptically induced glutamate transport in hippocampal slices. J Neurosci. 1999;19:2580-2588.
248 Aubert A, Pellerin L, Magistretti PJ, et al. A coherent neurobiological framework for functional neuroimaging provided by a model integrating compartmentalized energy metabolism. Proc Natl Acad Sci U S A. 2007;104:4188-4193.
249 Occhipinti R, Somersalo E, Calvetti D. Astrocytes as the glucose shunt for glutamatergic neurons at high activity: an in silico study. J Neurophysiol. 2009;101:2528-2583.
250 Katayama Y, Fukuchi T, McKee A, Terashi A. Effect of hyperglycemia on pyruvate dehydrogenase activity and energy metabolites during ischemia and reperfusion in gerbil brain. Brain Res. 1998;788:302-304.
251 Diemer NH, Benveniste H, Gjedde A. In vivo cell membrane permeability to deoxyglucose 386 in rat brain. Acta Neurol Scand. 1985;72:87.
252 Salceda R, Vilchis C, Coffe V, et al. Changes in the redox state in the retina 1434 and brain during the onset of diabetes in rats. Neurochem Res. 1998;23:893-897.
253 Desagher S, Glowinski J, Premont JJ. Pyruvate protects neurons against hydrogen peroxide-366 induced toxicity. Neuroscience. 1997;17:9060-9067.
254 Choi IY, Lei H, Gruetter R. Effect of deep pentobarbital anesthesia on neurotransmitter metabolism in vivo: on the correlation of total glucose consumption with glutamatergic action. J Cereb Blood Flow Metab. 2002;22:1343-1351.
255 Henry PG, Lebon V, Vaufrey F, et al. Decreased TCA cycle rate in the rat brain after acute 3-NP treatment measured by in vivo 1H-[13C] NMR spectroscopy. J Neurochem. 2002;82:857-866.
256 de Graaf RA, Mason GF, Patel AB, et al. Regional glucose metabolism and glutamatergic neurotransmission in rat brain in vivo. Proc Natl Acad Sci USA. 2004;101:12700-12705.
257 Patel AB, de Graaf RA, Mason GF, et al. Glutamatergic neurotransmission and neuronal glucose oxidation are coupled during intense neuronal activation. J Cereb Blood Flow Metab. 2004;24:972-985.
258 Oz G, Berkich DA, Henry PG, et al. Neuroglial metabolism in the awake rat brain: CO2 fixation increases with brain activity. J Neurosci. 2004;24:11273-11279.
259 Iida H, Jones T, Miura S. Modeling approach to eliminate the need to separate arterial plasma in oxygen-15 inhalation positron emission tomography. J Nucl Med. 1993;34:1333-1340.
260 Katayama Y, Tsubokawa T, Hirayama T, et al. Response of regional cerebral blood flow and oxygen metabolism to thalamic stimulation in humans as revealed by positron emission tomography. J Cereb Blood Flow Metab. 1986;6:637-641.
261 Ribeiro L, Kuwabara H, Meyer E, et al. Cerebral blood flow and metabolism during nonspecific bilateral visual stimulation in normal subjects. In: Uemura K, Lassen NA, Jones T, Kanno I, editors. Quantification of Brain Function: Tracer Kinetics and Image Analysis in Brain PET. Amsterdam: Elsevier; 1993:229-234.
262 Roland PE, Eriksson L, Widén L, et al. Changes in Regional Cerebral Oxidative Metabolism Induced by Tactile Learning and Recognition in Man. Eur J Neurosci. 1989;1:3-18.
263 Vafaee MS, Gjedde A. Model of blood-brain transfer of oxygen explains nonlinear flow-metabolism coupling during stimulation of visual cortex. J Cereb Blood Flow Metab. 2000;20:747-754.
264 Ances BM, Buerk DG, Greenberg JH, Detre JA. Temporal dynamics of the partial pressure of brain tissue oxygen during functional forepaw stimulation in rats. Neurosci Lett. 2001 Jun 22;306(1-2):106-110.