[level-membership-for-internal-medicine-category]
11 Cardiovascular system
The cardiac history
The history should record details of presenting symptoms, of which the most common are chest pain, fatigue and dyspnoea, palpitations, and presyncope or syncope (see below and Box 11.1). Previous illness should also be recorded, as it may provide important clues about the cardiac diagnosis – thyroid, connective tissue and neoplastic disorders, for example, can all affect the heart. Rheumatic fever in childhood is important because of its association with valvular heart disease; and diabetes and dyslipidaemias because of their association with coronary artery disease. Smoking is a major risk factor for coronary artery disease. Alcohol abuse predisposes to cardiac arrhythmias and cardiomyopathy. The cardiac history should quantify both habits in terms of pack-years smoked and units of alcohol consumed. The family history should always be documented because coronary artery disease and hypertension often run in families, as do some of the less common cardiovascular disorders, such as hypertrophic cardiomyopathy. Indeed, in patients with hypertrophic cardiomyopathy, a family history of sudden death is probably the single most important indicator of risk. Finally, the drug history should be recorded, as many commonly prescribed drugs are potentially cardiotoxic. β-Blockers and some calcium channel blockers (diltiazem, verapamil), for example, can cause symptomatic bradycardias, and tricyclic antidepressants and β agonists can cause tachyarrhythmias. Vasodilators cause variable reductions in blood pressure which can lead to syncopal attacks, particularly in patients with aortic stenosis. The myocardial toxicity of certain cytotoxic drugs (notably doxorubicin and related compounds) is an important cause of cardiomyopathy.
Box 11.1 Structure for the cardiac history

History of presenting complaint (HPC)
 This should define the nature of the symptoms, initially through open questioning. Closed questions are used to elicit the presence or absence of features which help to differentiate between diagnoses:


Chest pain
Myocardial ischaemia
Ischaemia of the heart results from an imbalance between myocardial oxygen supply and demand, producing pain called angina (Boxes 11.2 and 11.3). Angina is usually a symptom of atherosclerotic coronary artery disease, which impedes myocardial oxygen supply. Other causes of coronary artery disease (Box 11.4) are rare. However, it is important to be vigilant for causes of angina due to increased myocardial oxygen demand, such as aortic stenosis. The history is diagnostic for angina if the location of the pain, its character, its relation to exertion and its duration are typical. The patient describes retrosternal pain which may radiate into the arms, the throat or the jaw. It has a constricting character, is provoked by exertion and relieved within minutes by rest. The patient’s threshold for angina is typically reduced after eating or in cold weather due to the diversion of blood to the gut and the increased myocardial work consequent upon peripheral vasoconstriction, respectively. Occasionally angina is provoked only by the first significant activity of the day, a phenomenon known as the ‘warm-up effect’ and due to myocardial preconditioning. Less commonly, myocardial ischaemia may manifest as breathlessness, fatigue or symptoms that the patient finds difficult to describe – ‘I just have to stop’ – in which case the clues to the diagnosis are the relation of symptoms to exertion, the presence of risk factors for coronary artery disease and the absence of an alternative explanation for the symptoms, such as heart failure.
Box 11.2 Angina


Acute coronary syndromes
In these life-threatening cardiac emergencies, the pain is similar in location and character to angina but is usually more severe, more prolonged and unrelieved by rest (Box 11.5).


Pericarditis
This causes central chest pain, which is sharp in character and aggravated by deep inspiration, cough or postural changes. Characteristically, the pain is exacerbated by lying recumbent and reduced by sitting forward. Pericarditis is usually idiopathic or caused by Coxsackie B infection. It may also occur as a complication of myocardial infarction, but other causes are seen less commonly (Box 11.6).


Aortic dissection
This produces severe tearing pain in either the front or the back of the chest. The onset is abrupt, unlike the crescendo quality of ischaemic cardiac pain (Box 11.7).


Pulmonary embolism
Peripheral pulmonary embolism causes sudden-onset sharp, pleuritic chest pain, breathlessness and haemoptysis. Major, central pulmonary embolism presents with breathlessness, chest pain that can be indistinguishable from ischaemic chest pains and syncope. Risk factors for pulmonary embolism should be sought in the history (Box 11.8).
Box 11.8 Pulmonary embolism


Diagnosis
 d-Dimer: a negative d-dimer in a low-risk patient makes pulmonary embolism very unlikely
 ECG: sinus tachycardia; right bundle branch block (RBBB); classical ‘S1, Q3, T3’ pattern uncommon
 Chest X-ray: normal; wedge-shaped peripheral opacification; absent pulmonary vascular markings
 Echocardiogram: dilated right heart in some cases of large central pulmonary embolism
 CT pulmonary angiogram: has superseded V/Q scanning as the diagnostic test of choice
Comments
 Suspect pulmonary embolism in patients with unexplained hypoxia. Thrombolyic therapy should be considered for patients with pulmonary embolism associated with shock and/or a dilated right heart on echo. Patients with no risk factors for pulmonary embolism should be investigated for prothrombotic states.
Dyspnoea
Dyspnoea is an abnormal awareness of breathing occurring either at rest or at an unexpectedly low level of exertion. It is a major symptom of many cardiac disorders, particularly left heart failure (Table 11.1), but its mechanisms are complex. In acute pulmonary oedema and orthopnoea, dyspnoea is due mainly to the elevated left atrial pressure that characterizes left heart failure (Box 11.9). This produces a corresponding elevation of the pulmonary capillary pressure and increases transudation into the lungs, which become oedematous and stiff. Oxygenation of blood in the pulmonary arterioles is reduced causing hypoxaemia, and this, together with the extra effort required to ventilate the stiff lungs, causes dyspnoea. In exertional dyspnoea, other mechanisms are also important.
| Ventricular pathophysiology | Clinical examples |
|---|---|
| Restricted filling |


Exertional dyspnoea
This is the most troublesome symptom in heart failure (Box 11.10). Exercise causes a sharp increase in left atrial pressure and this contributes to the pathogenesis of dyspnoea by causing pulmonary congestion (see above). However, the severity of dyspnoea does not correlate closely with exertional left atrial pressure, and other factors must therefore be important. These include respiratory muscle fatigue and the effects of exertional acidosis on peripheral chemoreceptors. As left heart failure worsens, exercise tolerance deteriorates. In advanced disease, the patient is dyspnoeic at rest.
Box 11.10 Congestive heart failure


Diagnosis


Dizziness and syncope
Valvular obstruction
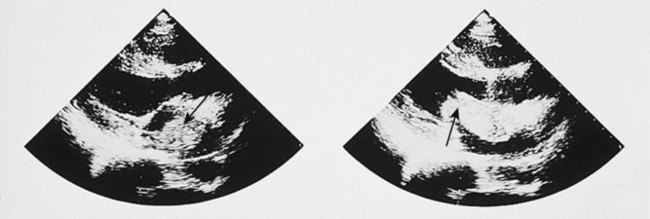
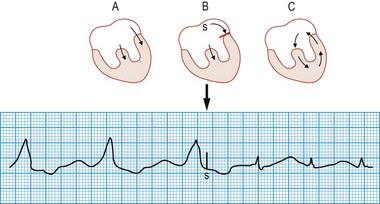
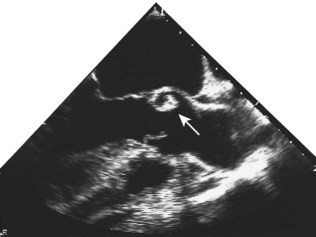
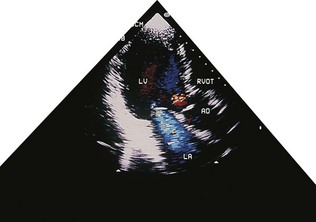
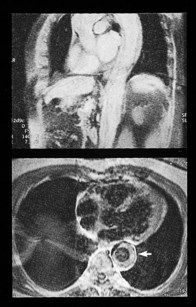
Fixed valvular obstruction in aortic stenosis may prevent a normal rise in cardiac output during exertion, such that the physiological vasodilatation that occurs in exercising muscle produces an abrupt reduction in blood pressure and cerebral perfusion, resulting in syncope. Vasodilator therapy may cause syncope by a similar mechanism. Intermittent obstruction of the mitral valve by left atrial tumours (usually myxoma) may also cause syncopal episodes (Fig. 11.1).
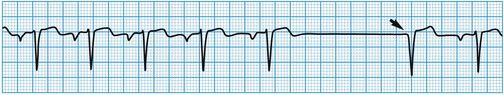
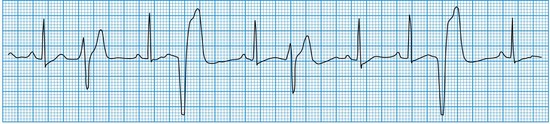
Stokes-Adams attacks
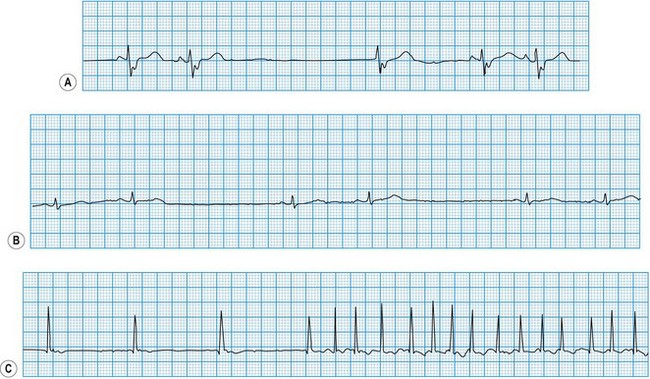
These are caused by self-limiting episodes of asystole (Fig. 11.2) or rapid tachyarrhythmias (including ventricular fibrillation). The loss of cardiac output causes syncope and striking pallor. Following restoration of normal rhythm, recovery is rapid and associated with flushing of the skin as flow through the dilated cutaneous bed is re-established.
The cardiac examination
A methodical approach is recommended, starting with inspection of the patient and proceeding to examination of the radial pulse, measurement of heart rate and blood pressure, examination of the neck (carotid pulse, jugular venous pulse), palpation of the anterior chest wall, auscultation of the heart, percussion and auscultation of the lung bases and, finally, examination of the peripheral pulses and auscultation for carotid and femoral arterial bruits (Box 11.11).
Box 11.11 Routine for the cardiovascular system examination


 Observe general appearance – comfortable, breathless, pale?
 Inspect the hands for clubbing, splinter haemorrhages, nicotine staining
 Examine the radial pulse(s) for symmetry, rate, rhythm, character (collapsing?)

 Assess the height and waveform of the JVP
 Examine the carotid pulse character (slow rising?) and volume (Corrigan’s sign?)

 Inspect the chest for scars and pulsations
 Assess the position and character of the apex beat
 Palpate the praecordium for heaves and thrills


Inspection of the patient
Oedema
1 Reduced sodium delivery to the nephron. This is caused by reduced glomerular filtration due to constriction of the preglomerular arterioles in response to sympathetic activation and angiotensin II production.
2 Increased sodium reabsorption from the nephron. This is the more important mechanism. It occurs particularly in the proximal tubule early in heart failure but, as failure worsens, renin-angiotensin activation stimulates aldosterone release, which increases sodium reabsorption in the distal nephron.
Arterial pulse
The arterial pulses should be palpated for evaluation of rate, rhythm, character and symmetry.
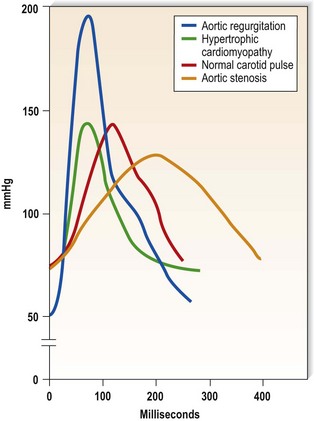
Character
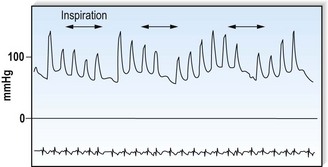
This is defined by the volume and waveform of the pulse and should be evaluated at the right carotid artery (i.e. the pulse closest to the heart and least subject to damping and distortion in the arterial tree). Pulse volume provides a crude indication of stroke volume, being small in heart failure and large in aortic regurgitation. The waveform of the pulse is of greater diagnostic importance (Fig. 11.3). Severe aortic stenosis produces a slow-rising carotid pulse; the fixed obstruction restricts the rate at which blood can be ejected from the left ventricle. In aortic regurgitation, in diastole, the left ventricle receives not only its normal pulmonary venous return but also a proportion of the blood ejected into the aorta during the previous systole as it flows back through an incompetent valve. The resultant large stroke volume, vigorously ejected, produces a rapidly rising carotid pulse, which collapses in early diastole owing to backflow through the aortic valve. This collapsing pulse can be exaggerated at the radial artery by lifting the arm. In mixed aortic valve disease, a biphasic pulse with two systolic peaks is occasionally found. Alternating pulse – alternating high and low systolic peaks – occurs in severe left ventricular failure but the mechanism for this is unknown. Paradoxical pulse refers to an inspiratory decline in systolic pressure greater than 10 mmHg (Fig. 11.4). In normal circumstances, inspiration results in an increase in venous return as blood is ‘sucked into’ the thorax by the decline in intrathoracic pressure. This increases right ventricular stroke volume, but left ventricular stroke volume falls slightly (ventricular interdependence). When the heart is constrained in a ‘fixed box’ by a pericardial effusion (cardiac tamponade) or by thickened pericardium (pericardial constriction), the increased inspiratory right ventricular blood volume reduces left ventricular compliance resulting in a more pronounced reduction in left ventricular filling, stroke volume and systolic blood pressure during inspiration. ‘Pulsus paradoxus’ therefore represents an exaggeration of the normal inspiratory decline in systolic pressure and is not truly paradoxical. Pulsus paradoxus in acute severe asthma is thought to be due to negative pleural pressure increasing afterload and thereby impedence to left ventricular emptying.
Jugular venous pulse
Jugular venous pressure
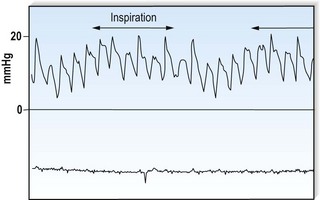
The jugular venous pressure (JVP) should be assessed from the waveform of the internal jugular vein which lies adjacent to the medial border of the sternocleidomastoid muscle. Distention of the external jugular vein is a useful clue to an elevated JVP but, strictly speaking, it should not be used because it can be compressed as it passes under the clavicle. The JVP is measured in centimetres vertically from the sternal angle to the top of the venous waveform. The normal upper limit is 4 cm. This is about 9 cm above the right atrium and corresponds to a pressure of 6 mmHg. Elevation of the JVP indicates a raised right atrial pressure unless the superior vena cava is obstructed, producing engorgement of the neck veins (Box 11.12). During inspiration, the pressure within the chest decreases and there is a fall in the JVP. In constrictive pericarditis, and less commonly in tamponade, inspiration produces a paradoxical rise in the JVP (Kussmaul’s sign) because the increased venous return that occurs during inspiration cannot be accommodated within the constrained right side of the heart (Fig. 11.5).


Waveform of jugular venous pulses
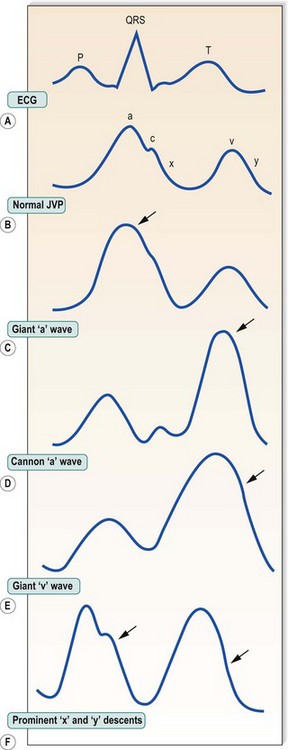
In sinus rhythm, the jugular venous pulse has a double waveform attributable to the ‘a’ and ‘v’ waves separated by the ‘x’ and ‘y’ descents. The ‘a’ wave is produced by atrial systole. It is followed by the ‘x’ descent (marking descent of the tricuspid valve ring), which is interrupted by the diminutive ‘c’ wave caused by tricuspid valve closure. Atrial pressure then rises again, producing the ‘v’ wave as the atrium fills passively during ventricular systole. The decline in atrial pressure as the tricuspid valve opens to allow ventricular filling produces the ‘y’ descent. Important abnormalities of the pattern of deflections are shown in Figure 11.6.
In atrial fibrillation, there is no atrial contraction. Consequently, there is no ‘a’ wave and the jugular venous pulse loses its double waveform. It is not always easy to differentiate venous from arterial pulsations in the neck, but several features help to distinguish the jugular venous pulse from the carotid arterial pulse (Box 11.13).


Auscultation of the heart
The diaphragm and bell of the stethoscope permit appreciation of high- and low-pitched auscultatory events, respectively. The apex, lower left sternal edge, upper left sternal edge and upper right sternal edge should be auscultated in turn. These locations correspond respectively to the mitral, tricuspid, pulmonary and aortic areas, and loosely identify sites at which sounds and murmurs arising from the four valves are best heard (Box 11.14).
Box 11.14 Routine for auscultation of the heart
 Auscultate at apex with diaphragm
 Reposition patient on left side – ‘Please turn onto your left side’
 Listen with diaphragm (mitral regurgitation) and then bell (mitral stenosis)
 Return patient to original position, reclining at 45°


 Auscultate with diaphragm at upper right sternal edge (aortic stenosis, hypertrophic cardiomyopathy)

 Auscultate over the carotid arteries (radiation of murmur of aortic stenosis, carotid artery bruits)
Second sound (S2)
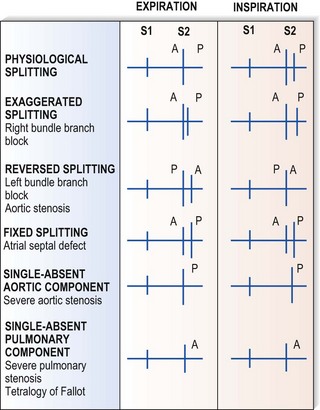
This corresponds to aortic and pulmonary valve closure following ventricular ejection. S2 is single during expiration. Inspiration, however, causes physiological splitting into aortic followed by pulmonary components because increased venous return to the right side of the heart delays pulmonary valve closure. Important abnormalities of S2 are illustrated in Figure 11.7.
Heart murmurs
These are caused by turbulent flow within the heart and great vessels (Fig. 11.8). Occasionally the turbulence is caused by increased flow through a normal valve – usually aortic or pulmonary – producing an ‘innocent’ murmur. However, murmurs may also indicate valve disease or abnormal communications between the left and right sides of the heart (e.g. septal defects).
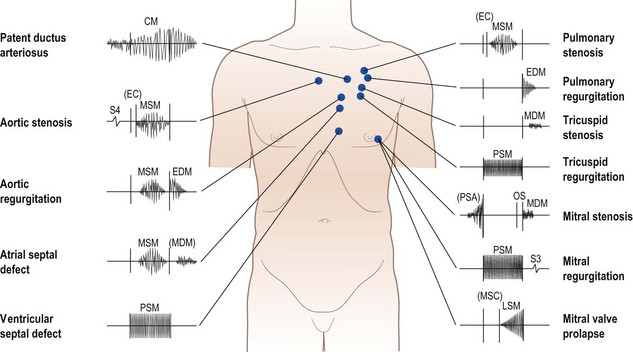
Rheumatic heart disease has become much less common in developed countries, although it remains common elsewhere, and is the cause of many of the classic heart murmurs (Box 11.15). Degenerative valve disease (calcific aortic stenosis, mitral regurgitation due to chordal rupture) is increasingly common. Heart murmurs are defined by four characteristics: loudness, quality, location and timing.
Box 11.15 Rheumatic heart disease
Typical patient
 Middle-aged woman, less commonly man, with a history of childhood rheumatic fever (often not recognized or dismissed as trivial feverish illness). The mitral valve is almost invariably affected, commonly with associated aortic valve involvement. Right-sided valves less commonly affected. Presentation is usually with exertional dyspnoea, less commonly with unexplained atrial fibrillation or unheralded stroke
 Pregnant woman presenting abruptly with atrial fibrillation and pulmonary oedema


Major signs
 Mitral stenosis: atrial fibrillation, signs of fluid retention (raised JVP ± peripheral oedema and basal crackles in lung fields), loud S1, opening snap in early diastole followed by low-pitched mid-diastolic murmur best heard at cardiac apex. With increasing calcification, the valve gets more rigid and the loud S1 and opening snap disappear

 Aortic stenosis: slow-rising carotid pulse, ejection systolic murmur best heard at base of heart


Treatment
 Diuretics for fluid retention and vasodilators to increase forward flow through regurgitant left-sided valves. Digoxin or β-blockers for rate control in atrial fibrillation plus warfarin to protect against embolism. Symptomatic mitral valve disease that fails to respond to treatment requires valve surgery (repair or replacement) or, in selected cases of mitral stenosis, percutaneous valvuloplasty. Symptomatic aortic valve disease always requires consideration for valve replacement
The electrocardiogram
Electrophysiology
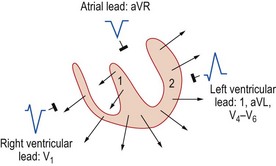
Inscription of the QRS complex
The ventricular depolarization vector can be resolved into two components:
1 Septal depolarization – spreads from left to right across the septum.
2 Ventricular free wall depolarization – spreads from endocardium to epicardium.
Left ventricular depolarization dominates the second vector component, the resultant direction of which is from right to left. Thus electrodes orientated to the left ventricle record a small negative deflection (Q wave) as the septal depolarization vector moves away, followed by a large positive deflection (R wave) as the ventricular depolarization vector approaches. The sequence of deflections for electrodes orientated towards the right ventricle is in the opposite direction (Fig. 11.9).
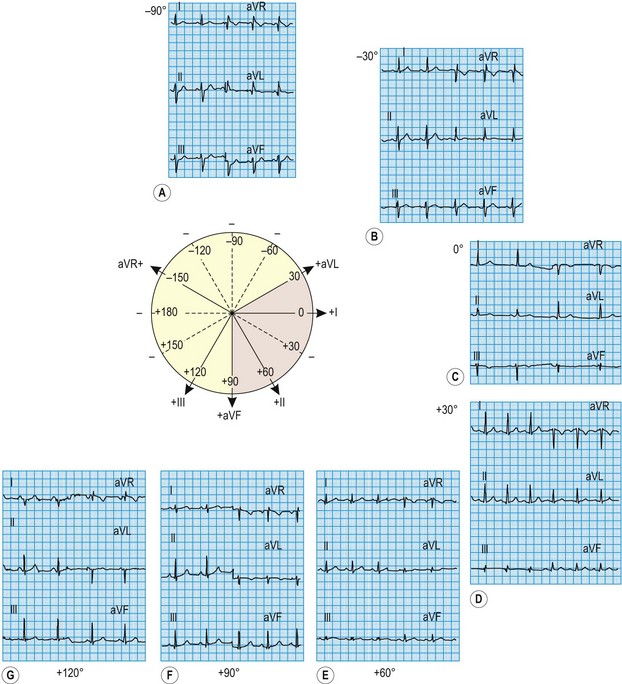
Electrical axis
Because the mean direction of the ventricular depolarization vector (the electrical axis) shows a wide range of normality, there is corresponding variation in QRS patterns consistent with a normal ECG. Thus correct interpretation of the ECG must take account of the electrical axis. The frontal plane axis is determined by identifying the limb lead in which the net QRS deflection (positive and negative) is least pronounced. This lead must be at right angles to the frontal plane electrical axis, which is defined using an arbitrary hexaxial reference system (Fig. 11.10).
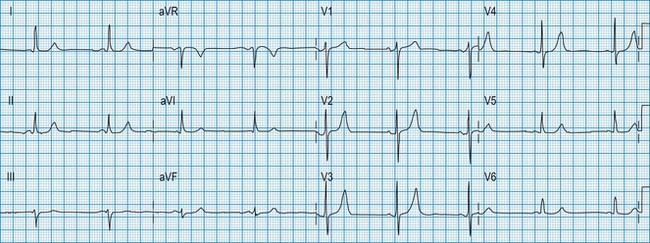
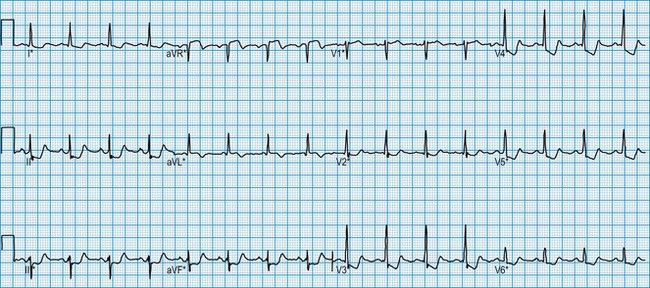
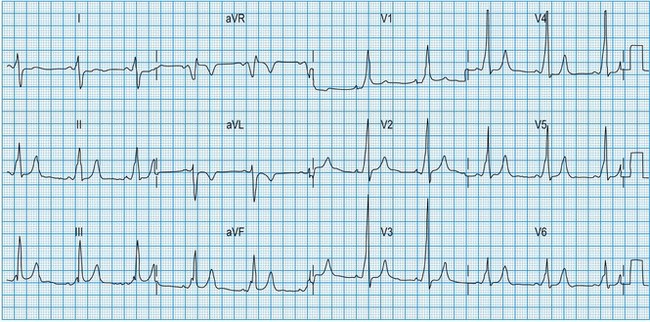
Normal 12-lead ECG
This is illustrated in Figure 11.11. Leads I–III are the standard bipolar leads, which each measure the potential difference between two limbs:


Analysis of the ECG
QRS morphology
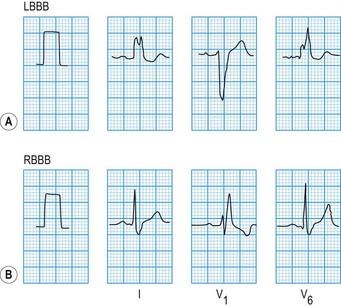
The QRS duration should not exceed 0.12 s. Prolongation indicates slow ventricular depolarization due to bundle branch block (Fig. 11.12), pre-excitation (WPW syndrome), ventricular tachycardia or hypokalaemia.
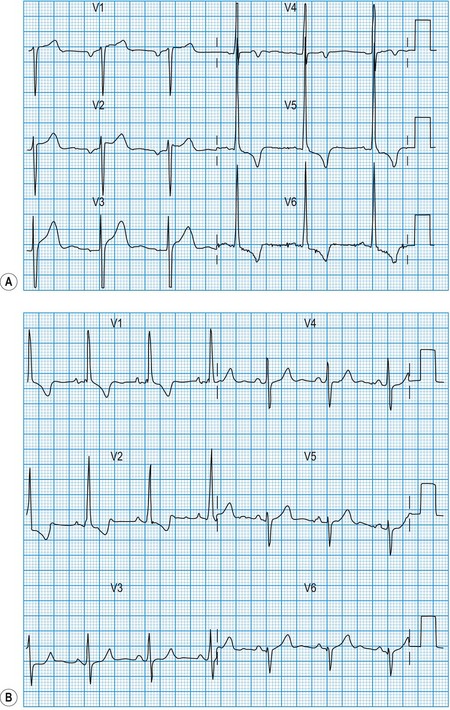
Exaggerated QRS deflections indicate ventricular hypertrophy (Fig. 11.13). The voltage criteria for left ventricular hypertrophy are fulfilled when the sum of the S and R wave deflections in leads V1 and V6 exceeds 35 mm (3.5 mV). Right ventricular hypertrophy causes tall R waves in the right ventricular leads (V1 and V2). A dominant R wave in lead V1 can also be caused by right bundle branch block, posterior myocardial infarction, WPW syndrome and dextrocardia. Diminished QRS deflections occur in myxoedema and also when pericardial effusion or obesity electrically insulates the heart. The presence of pathological Q waves (duration >0.04 s) usually indicates previous myocardial infarction.
ST segment morphology
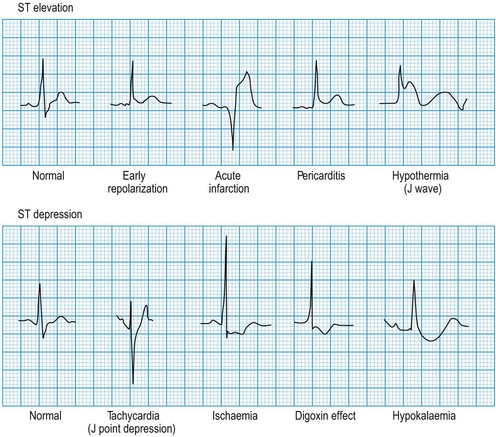
Minor ST elevation reflecting early repolarization may occur as a normal variant (Fig. 11.14), particularly in subjects of African or West Indian origin. Pathological elevation (>2.0 mm above the isoelectric line) occurs in acute myocardial infarction, variant angina and pericarditis. Horizontal ST depression indicates myocardial ischaemia. Other important causes of ST depression are digoxin therapy and hypokalaemia.
Clinical applications of ECG
Diagnosis of coronary heart disease
Exercise stress testing
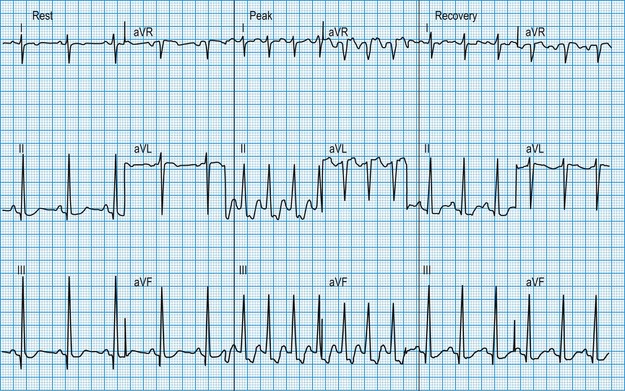
The patient is usually exercised on a treadmill, the speed and slope of which can be adjusted to increase the workload gradually. In patients with coronary artery disease, exercise-induced increases in myocardial oxygen demand may outstrip oxygen delivery through the atheromatous arteries, resulting in regional ischaemia. This causes planar or downsloping ST segment depression, with reversal during recovery (Fig. 11.15). The ready availability of the exercise test means that it is one of the most widely used tests for evaluating the patient with chest pain but its diagnostic accuracy is limited to about 70%, false positive or false negative results being common when the pretest probability of coronary disease is very low (as in young women) or very high (as in elderly patients with typical symptoms), respectively. Non-invasive imaging modalities (see later: magnetic resonance perfusion imaging, stress echocardiography, CT coronary angiography) have higher rates of diagnostic accuracy and are now preferred in the assessment of patients with suspected coronary artery disease, where available. The exercise ECG also provides prognostic information in patients who are known to have coronary artery disease: an increased risk of myocardial infarction or sudden death is indicated by ST depression very early during exercise, by an exertional fall in blood pressure or by exercise-induced ventricular arrhythmias. In these cases, urgent coronary angiography is required.
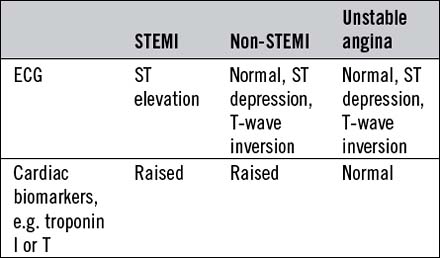
Acute coronary syndromes
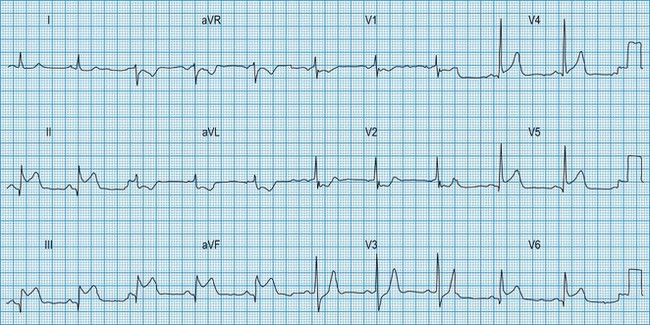
Acute myocardial infarction and unstable angina present similarly with unprovoked – often severe – ischaemic cardiac pain. Reliable differentiation between the acute coronary syndromes on clinical grounds cannot be made and requires measurement of cardiac biomarkers, in particular troponin I or T (see below), 12 hours after the onset of symptoms, and observation of the 12-lead ECG. The combination of typical symptoms plus raised troponins is diagnostic of myocardial infarction, which is categorized as ST elevation myocardial infarction (STEMI) or non-ST elevation myocardial infarction (non-STEMI) by the ECG findings. Typical symptoms unassociated with either troponin release or ST elevation are diagnosed as troponin-negative acute coronary syndrome or unstable angina. It therefore follows that acute myocardial infarction and unstable angina may be associated with a completely normal ECG or with ST depression (Fig. 11.16) or T-wave changes, the diagnosis depending on the presence or absence of raised troponins.
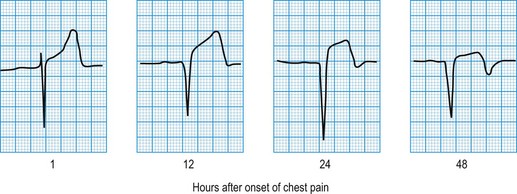
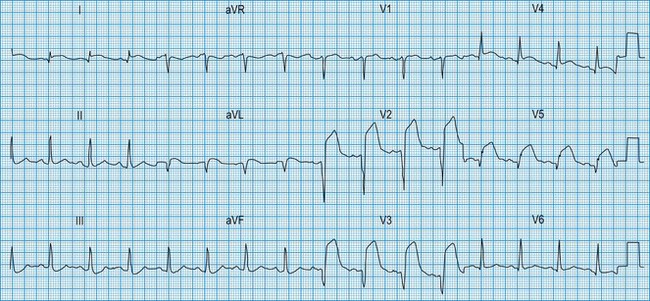
In STEMI, the evolution of ECG changes is characteristic, although it may be aborted by timely reperfusion therapy (thrombolysis or primary stenting). Peaking of the T wave followed by ST segment elevation occurs during the first hour of pain (Fig. 11.17). The changes are regional, and reciprocal ST depression may be seen in the opposite ECG leads. Usually a pathological Q wave develops during the following 24 hours and persists indefinitely. The ST segment returns to the isoelectric line within 2-3 days, and T-wave inversion may occur. The ECG is a useful indicator of infarct location. Changes in leads II, III and aVF indicate inferior infarction (Fig. 11.18), whereas changes in leads V1–V6 indicate anteroseptal (V1–V3) or anterolateral (V1–V6) infarction (Fig. 11.19). When the infarct is located posteriorly, ECG changes may be difficult to detect, but dominant R waves in leads V1 and V2 often develop (see Fig. 11.18).
Detection of cardiac arrhythmias
Ambulatory (Holter) ECG monitoring
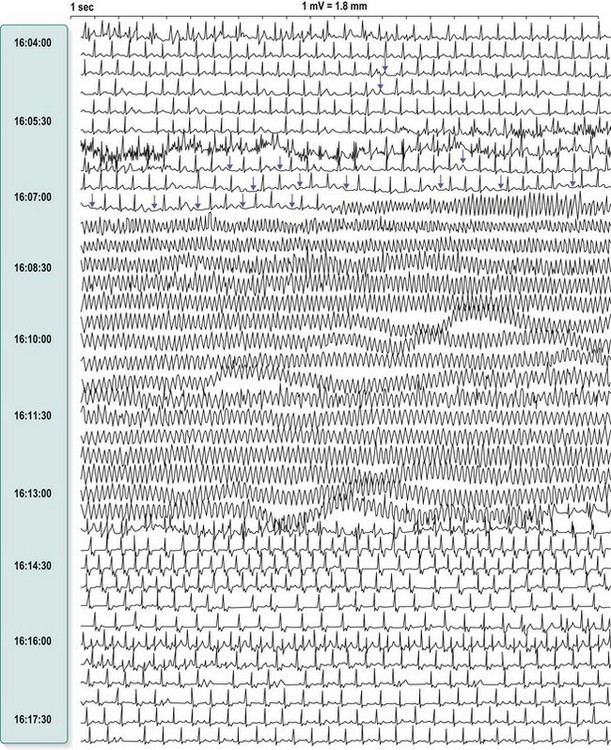
Patients with frequent palpitation or dizzy attacks are commonly investigated by means of an ambulatory 24-hour ECG. The availability of portable cassette recorders allows this to be performed as an outpatient. Analysis of the tape identifies any cardiac arrhythmias that occurred during the monitoring period (Fig. 11.20). A patient diary allows correlation between symptoms and heart rhythm.
Diagnosis of atrial arrhythmias
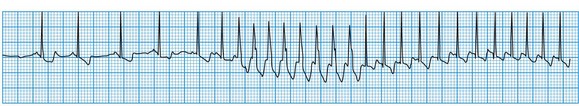
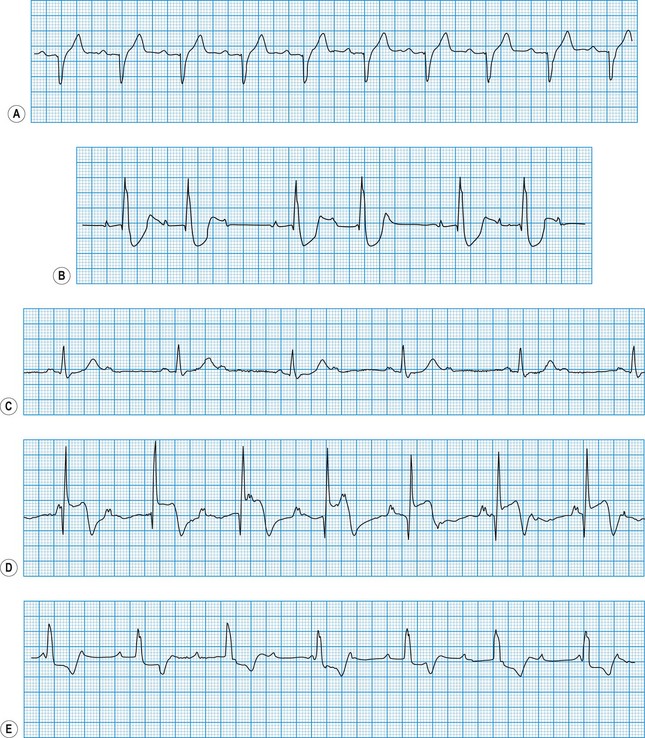
The ECG in atrial arrhythmias (Fig. 11.21) shows a narrow and morphologically normal QRS complex when ventricular depolarization occurs by normal His-Purkinje pathways. Rate-related or pre-existing bundle branch block, however, results in broad ventricular complexes that are difficult to distinguish from ventricular tachycardia.
Diagnosis of nodal arrhythmias
Atrioventricular nodal re-entry tachycardia (AVNRT)
The abnormal atrionodal pathway provides the basis for a small re-entry circuit. In sinus rhythm, the electrocardiogram is usually normal, although occasionally the PR interval is short (Lown-Ganong-Levine syndrome). During tachycardia, the rate is 150-250 bpm (see Fig. 11.21). The arrhythmia is usually self-limiting. Sustained AVNRT will sometimes respond to carotid sinus pressure. If this fails, intravenous adenosine or verapamil are usually effective by blocking the re-entry circuit within the atrioventricular node. Antitachycardia pacing or direct current cardioversion may also be used. Many patients are now being treated by catheter ablation to destroy the abnormal atrionodal pathway and avoid the need for long-term drug therapy (see below).
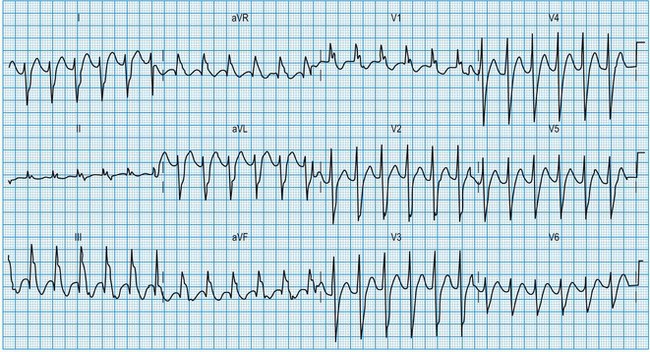
Wolff-Parkinson-White syndrome
This congenital disorder, which affects 0.12% of the population, is caused by an accessory pathway (bundle of Kent) between the atria and the ventricles. During sinus rhythm, atrial impulses conduct more rapidly through the accessory pathway than the atrioventricular node, such that the initial phase of ventricular depolarization occurs early (pre-excitation) and spreads slowly through the ventricles by abnormal pathways. This produces a short PR interval and slurring of the initial QRS deflection (δ wave). The remainder of ventricular depolarization, however, is rapid because the delayed arrival of the impulse conducted through the atrioventricular node rapidly completes ventricular depolarization by normal His-Purkinje pathways (Fig. 11.22). Cardiac arrhythmias affect about 60% of patients with WPW syndrome and are usually re-entrant (rate 150-250 bpm) triggered by an atrial premature beat. In most patients, the re-entry arrhythmia is ‘orthodromic’, with anterograde conduction through the atrioventricular node and retrograde conduction through the accessory pathway (atrioventricular re-entry tachycardia (AVRT), Fig 11.23). This results in a narrow complex tachycardia (without pre-excitation) that is indistinguishable from AVNRT. Occasionally, the re-entry circuit is in the opposite direction (‘antidromic’), producing a very broad, pre-excited tachycardia.
Diagnosis of ventricular arrhythmias
Ventricular premature beats
These may occur in normal individuals, either spontaneously or in response to toxic stimuli such as caffeine or sympathomimetic drugs. They are caused by the premature discharge of a ventricular ectopic focus that produces an early and broad QRS complex (Fig. 11.24). The premature impulse may be conducted backwards into the atria, producing a retrograde P wave, but penetration of the sinus node is rare. Thus, resetting of the sinus node does not usually occur and there is a fully compensatory pause before the next sinus beat.
Ventricular tachycardia
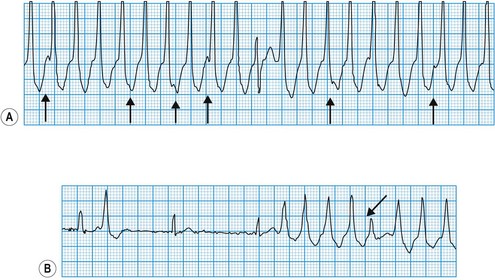
This is always pathological. It is defined as three or more consecutive ventricular beats at a rate above 120 per minute. Ventricular depolarization inevitably occurs slowly by abnormal pathways, producing a broad QRS complex. This distinguishes it from most atrial and junctional tachycardias which have a narrow QRS complex, although differential diagnosis may be more difficult for atrial or junctional tachycardias with a broad QRS complex caused by rate-related or pre-existing bundle branch block (Fig. 11.25). Nevertheless, ventricular tachycardia can usually be identified by careful scrutiny of the 12-lead ECG (Fig. 11.26). Support for the diagnosis is provided by a very broad QRS complex (>140 ms), extreme left or right axis deviation, concordance of the QRS deflections in V1–V6 (either all positive or all negative) and configurational features of the QRS complex, including an ‘rSR’ complex in V1 and a QS complex in V6. Confirmation of the diagnosis is provided by any evidence of AV dissociation: either P waves, at a slower rate than the QRS complexes, ‘marching through’ the tachycardia (Fig. 11.27A), or ventricular capture and/or fusion beats, in which the dissociated atrial rhythm penetrates the ventricle by conduction through the AV node and interrupts the tachycardia, producing a normal ventricular complex (capture, Fig. 11.27A) or, more commonly, a broad hybrid complex (fusion) that is part sinus and part ventricular in origin (Fig. 11.27B). Torsades de pointes, a broad complex tachycardia with changing wavefronts, also provides unequivocal evidence of ventricular tachycardia and is particularly characteristic of the arrhythmia that complicates long QT syndrome, often resulting in sudden death. The syndrome may be inherited as an autosomal dominant (Romano-Ward syndrome) or as an autosomal recessive (Lange-Nielsen syndrome) trait, when it is associated with congenital deafness.
Diagnosis of sinoatrial disease
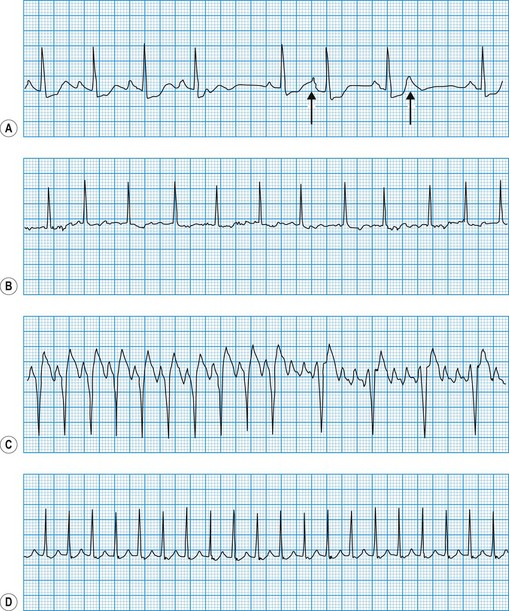
Sinus node discharge is not itself visible on the surface ECG, but the atrial depolarization it triggers produces the P wave. The spontaneous discharge of the normal sinus node is influenced by a variety of neurohumoral factors, particularly vagal and sympathetic activity, which respectively slow and quicken the heart rate. In sinoatrial disease (Fig. 11.28 and Box 11.16), sinus node discharge may be abnormally slow, blocked (with failure to activate atrial depolarization) or absent altogether. Under these circumstances, the sinus rate may be very slow, the atrium may fibrillate, or pacemaker function may be assumed by foci lower in the atrium, the atrioventricular node or the His-Purkinje conducting tissue in the ventricles. The intrinsic rate of these ‘escape’ pacemaker foci is slower than the normal sinus rate.


Diagnosis of atrioventricular block
In atrioventricular block (Fig. 11.29), conduction is delayed or completely interrupted, either in the atrioventricular node or in the bundle branches (Box 11.17). When conduction is merely delayed (e.g. first-degree atrioventricular block, bundle branch block), the heart rate is unaffected. When conduction is completely interrupted, however, the heart rate may slow sufficiently to produce symptoms. In second-degree atrioventricular block, failure of conduction is, by definition, intermittent, and if sufficient sinus impulses are conducted to maintain an adequate ventricular rate, symptoms may be avoided. In third-degree atrioventricular block there is complete failure of conduction and continuing ventricular activity depends on the emergence of an escape rhythm. If the block is within the atrioventricular node, the escape rhythm usually arises from a focus just below the node in the bundle of His (junctional escape), and is often fast enough to prevent symptoms. If both bundle branches are blocked, however, the escape rhythm must arise from a focus lower in the ventricles. Ventricular escape rhythms of this type are nearly always associated with symptoms because they are not only very slow but also unreliable, and may stop altogether, producing prolonged asystole.


Third-degree (complete) atrioventricular block
The atrial and ventricular rhythms are ‘dissociated’ because none of the atrial impulses are conducted. Thus the ECG shows regular P waves (unless the atrium is fibrillating) and regular but slower QRS complexes occurring independently of each other. When block is within the atrioventricular node (e.g. inferior myocardial infarction, congenital atrioventricular block), a junctional escape rhythm with a reliable rate (40-60 bpm) takes over (see Fig. 11.29). Ventricular depolarization occurs rapidly by normal pathways, producing a narrow QRS complex. However, when block is within the bundle branches (e.g. idiopathic fibrosis), there is always extensive conducting tissue disease. The ventricular escape rhythm is slow and unreliable, with a broad QRS complex (see Fig. 11.29).
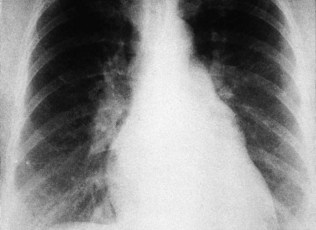
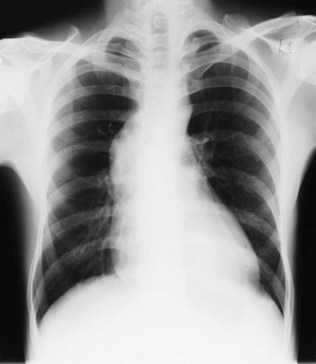
The chest X-ray
Good-quality posteroanterior (PA) and lateral chest X-rays are always helpful in the assessment of the cardiac patient (Fig. 11.30).
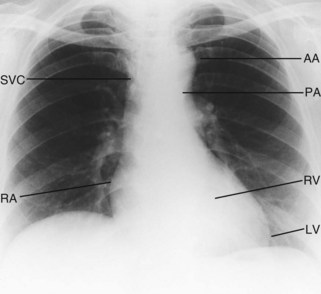
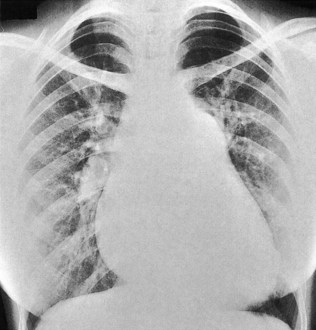
Cardiac silhouette
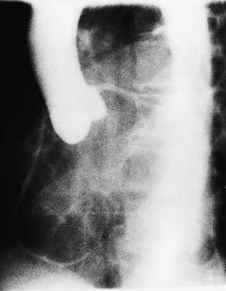
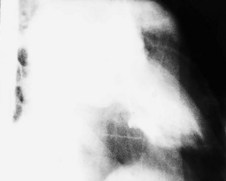
Although the PA chest X-ray exhibits a wide range of normality, the maximum diameter of the heart should not be more than 50% of the widest diameter of the thorax. Cardiac enlargement is caused either by dilatation of the cardiac chambers or by pericardial effusion (Fig. 11.31). Myocardial hypertrophy only affects heart size if very severe.
Atrial dilatation
Left atrial dilatation occurs in left ventricular failure and mitral valve disease (Fig. 11.32). Radiographic signs are:


Vascular dilatation
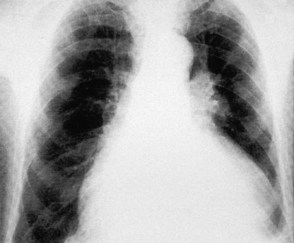
Aortic dilatation caused by aneurysm or dissection may produce widening of the entire upper mediastinum. Localized dilatation of the proximal aorta occurs in aortic valve disease and produces a prominence in the right upper mediastinum (Fig. 11.33). Dilatation of the main pulmonary artery occurs in pulmonary hypertension and pulmonary stenosis and produces a prominence below the aortic knuckle (Fig. 11.34).
Lung fields
Altered pulmonary flow
Increments in pulmonary flow sufficient to cause radiographic abnormalities are caused by left-to-right intracardiac shunts (e.g. atrial septal defect; see Fig 11.34, ventricular septal defect, patent ductus arteriosus). Prominence of the vascular markings gives the lung fields a plethoric appearance. Reductions in pulmonary flow, on the other hand, cause reduced vascular markings. This may be regional (e.g. pulmonary embolism) or global (e.g. severe pulmonary hypertension).
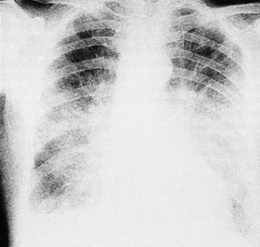
Increased left atrial pressure
This occurs in mitral stenosis and left ventricular failure and produces corresponding rises in pulmonary venous and pulmonary capillary pressures. Prominence of the upper lobe veins is an early radiographic finding. As the left atrial and pulmonary capillary pressures rise above 18 mmHg, transudation into the lung produces interstitial pulmonary oedema, characterized by prominence of the interlobular septa, particularly at the lung bases (Kerley B lines). Further elevation of pressure leads to alveolar pulmonary oedema, characterized by perihilar ‘bat’s-wing’ shadowing (Fig. 11.35).
Echocardiography
Principles
Physics
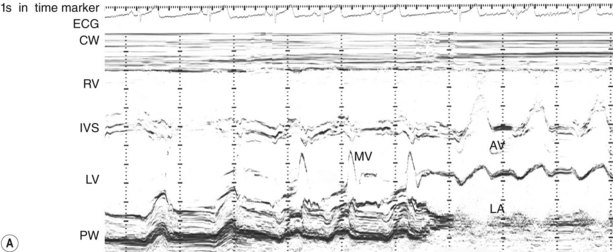
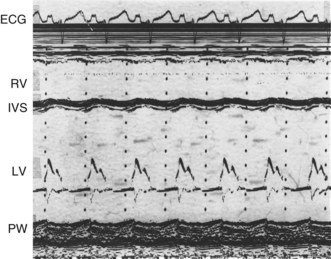
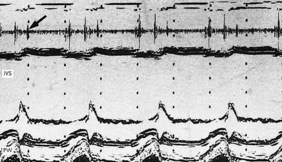
M-mode echocardiogram
This provides a unidimensional ‘ice-pick’ view through the heart. Continuous recording on photographic paper provides an additional time dimension, thereby permitting appreciation of the dynamic component of the cardiac image. By convention, cardiac structures closest to the transducer are displayed at the top of the record and more distant structures are displayed below. Thus, on the transthoracic M-mode echocardiogram, anteriorly located (‘right-sided’) structures lie above the posteriorly located (‘left-sided’) structures, but on the transoesophageal echocardiogram, the display is reversed. M-mode is particularly useful for measuring chamber dimensions and left ventricular wall thickness, and for timing events within the cardiac cycle (Fig. 11.36A).
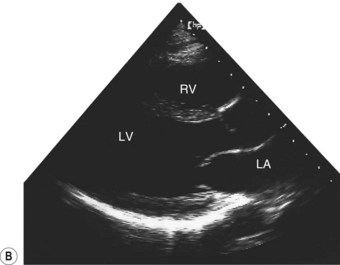
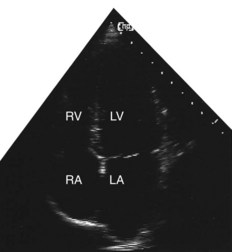
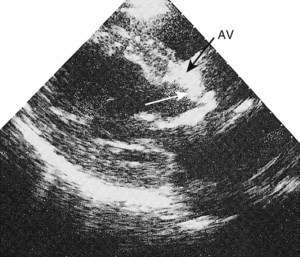
Two-dimensional echocardiogram
This provides more detailed information about morphology than the M-mode recording. By projecting a fan of echoes in an arc of up to 80°, a 2D ‘slice’ through the heart can be obtained, the precise view depending on the location and angulation of the transducer (Fig. 11.36B).
Clinical applications
Congenital heart disease
Echocardiography, particularly the 2D technique, has revolutionized the diagnosis of congenital heart disease, in the majority of cases obviating the need for invasive investigation by cardiac catheterization (Fig. 11.37). The relationships of the cardiac chambers and their connections with the great vessels are readily determined. Valvular abnormalities and septal defects can also be recognized. Recent technology has permitted in utero fetal imaging for the antenatal diagnosis of cardiac defects.
Myocardial disease
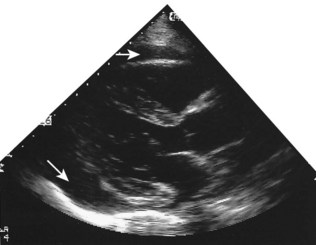
Echocardiography permits accurate assessment of cardiac dilatation, hypertrophy and contractile function. Dilated cardiomyopathy produces ventricular dilatation with global contractile impairment (Fig. 11.38). This must be distinguished from the regional contractile impairment that follows myocardial infarction in patients with coronary artery disease (Fig. 11.39). Hypertrophic cardiomyopathy is characterized by thickening (hypertrophy) of the left ventricular myocardium, usually with disproportionate involvement of the interventricular septum (asymmetric septal hypertrophy). In aortic and hypertensive heart disease, on the other hand, left ventricular hypertrophy is usually symmetrical (Fig. 11.40).
Valvular disease
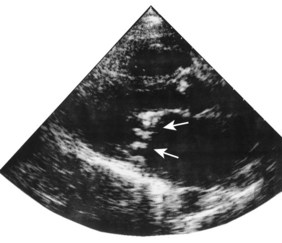
Echocardiography is of particular value for identifying both structural and dynamic valvular abnormalities and any associated chamber dilatation or hypertrophy (Boxes 11.18–11.21). The severity of valvular involvement in congenital, rheumatic, degenerative and infective disease may thus be defined; the technique is diagnostic for bicuspid aortic valve and mitral valve prolapse, and readily identifies valve thickening and calcification in rheumatic and calcific disease (Figs 11.40 and 11.41). Vegetations in infective endocarditis can usually be visualized if they are large enough (>3 mm, Fig. 11.42). The transoesophageal approach is usually necessary for endocarditis involving prosthetic heart valves.
Box 11.18 Aortic stenosis


Box 11.19 Aortic regurgitation


Major signs


Box 11.20 Mitral stenosis


Box 11.21 Mitral regurgitation


Pericardial disease
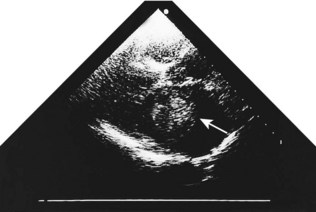
Although the echocardiogram is of little value in constrictive pericarditis, it is the most sensitive technique available for the diagnosis of pericardial effusion (Fig. 11.43). The effusion appears as an echo-free space distributed around the ventricles but usually avoiding the potential space behind the left atrium.
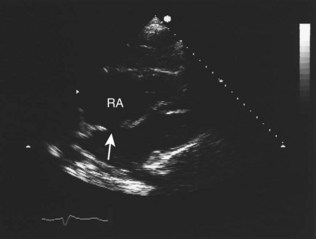
Other clinical applications
Intracardiac tumours, particularly myxomas (see Fig. 11.1) and thrombi (Fig. 11.44), are readily visualized by echocardiography. The transoesophageal technique is more sensitive for identifying thrombus in the left atrial appendage and is also helpful for diagnosing aortic disease, such as aneurysm and dissection, as it provides better views of the thoracic aorta than is possible with conventional 2D echocardiography (Fig. 11.45).
Doppler echocardiography
Clinical applications
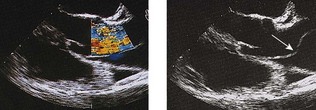
In paediatric cardiology, the combination of 2D echocardiography and colour-flow Doppler mapping has made possible the ‘non-invasive’ diagnosis of a large majority of congenital defects, often without the need for cardiac catheterization. These techniques have also revolutionized the diagnosis of valvular disease in all age groups. In valvular regurgitation, the retrograde flow that occurs after valve closure is readily detected by Doppler echocardiography, although only an approximate estimate of its severity is possible (Fig. 11.46). In valvular stenosis, the peak velocity (as opposed to the volume) of flow across the valve is directly related to the degree of stenosis. Thus, measurement of Doppler flow velocity (ideally by continuous wave) permits quantification of the stenosis by the application of the Bernoulli equation:

Cardiovascular radionuclide imaging
Clinical applications
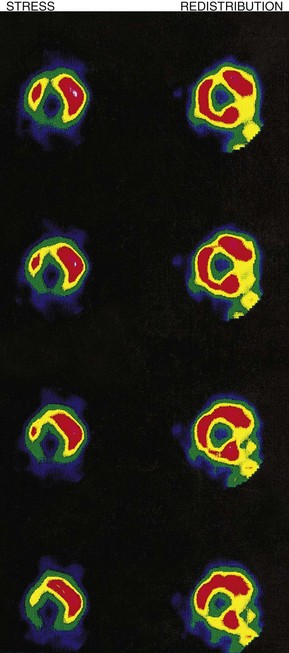
Myocardial perfusion scintigraphy
This method is used for the diagnosis of coronary artery disease (Fig. 11.47). The patient is ‘stressed’ in an attempt to provoke myocardial ischaemia either by a standardized exercise test, an intravenous dobutamine infusion or an intravenous adenosine infusion. Isotope is injected intravenously at peak stress and the heart is imaged under a gamma camera. Thallium-201 (201Tl) has now given way to 99mTc-labelled methoxy-isobutyl-isonitrile (MIBI) which provides better image quality. Isotope is distributed homogeneously in normally perfused myocardium, ischaemic or infarcted areas appearing as scintigraphic defects. If 201Tl is used, repeat imaging after 2-4 hours’ rest permits the reassessment of scintigraphic defects; those that disappear (reversible defects) indicate areas of stress-induced ischaemia, while those that persist (fixed defects) indicate infarcted myocardium. If 99mTc-labelled MIBI is used, resting images for assessment of reversibility require a separate injection of isotope 24 hours after (or before) the stress images.
Positron emission tomography
Positron emission tomography (PET) scanning is used to determine myocardial ‘viability’ in patients with heart failure (see stress echocardiography, above). Simultaneous assessment of myocardial perfusion using 13N ammonia and glucose uptake using a glucose analogue permits the identification of viable but dysfunctional myocardium, in which perfusion is impaired but metabolic activity in terms of glucose uptake remains normal. This perfusion-metabolic ‘mismatch’ indicates viable muscle likely to respond favourably to revascularization by angioplasty or bypass surgery.
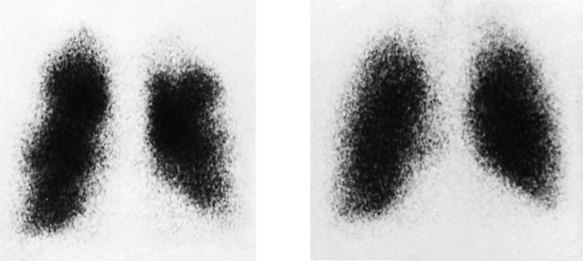
Pulmonary scintigraphy (radioisotope imaging)
This method is used for the diagnosis of pulmonary embolism (Fig. 11.48). 99mTc-labelled microspheres injected intravenously become trapped within the pulmonary capillaries. The normal pulmonary perfusion scintigram shows a homogeneous distribution of radioactivity throughout both lung fields. Pulmonary embolism causes regional impairment of pulmonary flow, which results in a perfusion defect on the scintigram; however, the appearance is non-specific and occurs in many other pulmonary disorders, particularly chronic obstructive pulmonary disease. Specificity is enhanced by simultaneous ventilation scintigraphy (a ventilation/perfusion or V/Q scan). Inhaled xenon-133 (133Xe) is distributed homogeneously throughout the normal lung, and in pulmonary embolism (unlike other pulmonary disorders), distribution remains homogeneous. Thus, a scintigraphic perfusion defect not ‘matched’ by a ventilation defect is highly specific for pulmonary embolism. CT pulmonary angiography is now the diagnostic test of choice for pulmonary embolism, but V/Q scanning is still valuable in patients with suspected pulmonary embolism who have severe renal impairment in whom X-ray contrast is contraindicated.
Computed tomography
Clinical applications
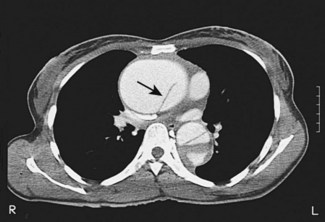
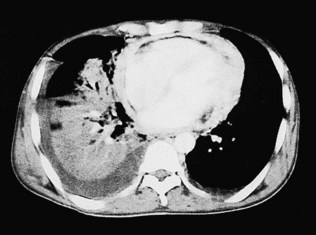
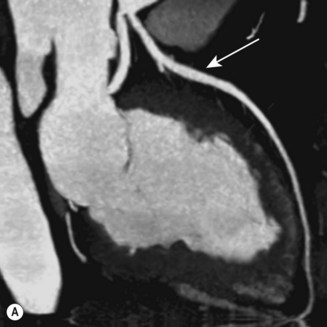
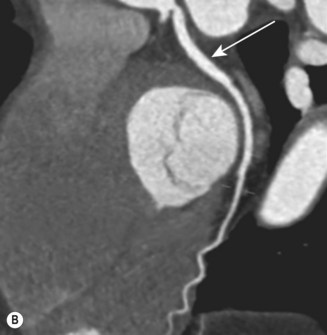
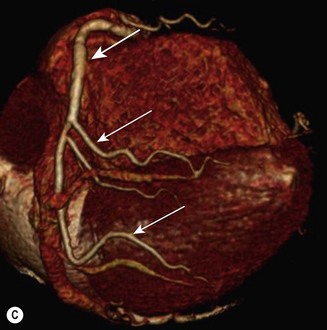
CT (with contrast enhancement) diagnoses pulmonary embolism and aortic dissection (Fig 11.49) with a sensitivity of about 95%. It is also used for accurate assessment of pericardial thickness in constrictive disease (Fig. 11.50) and in the diagnosis of cardiac tumours. Recently, multislice CT has emerged as a useful investigation for the diagnosis of coronary artery disease. The quantification of coronary calcification has found widespread application as a marker of coronary risk in asymptomatic or low-risk individuals; a zero calcium score has a high accuracy rate for the exclusion of coronary artery disease. CT coronary angiography is able to diagnose normal coronary arteries or mild plaque disease extremely accurately (Fig 11.51) but it cannot distinguish reliably between moderate and severe stenoses or determine the degree of stenosis in heavily calcified coronary segments. CT coronary angiography is therefore best used in the assessment of low- to medium-risk patients to ‘rule out’ significant obstructive coronary artery disease. Additional applications of CT include the evaluation of graft patency following coronary bypass surgery, analysis of ventricular wall motion and blood flow quantification in congenital heart disease, permitting dynamic assessment of shunts and other defects.
Magnetic resonance imaging
Clinical applications
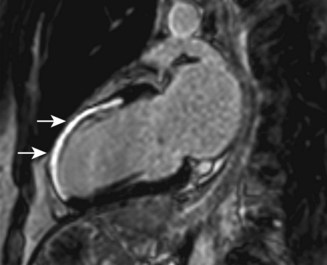
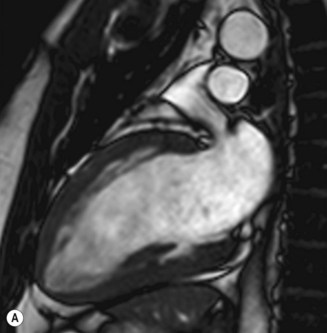
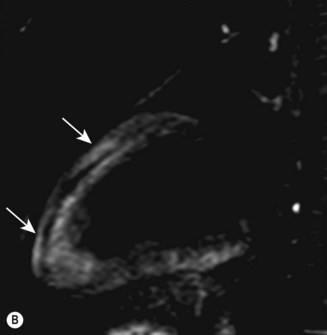
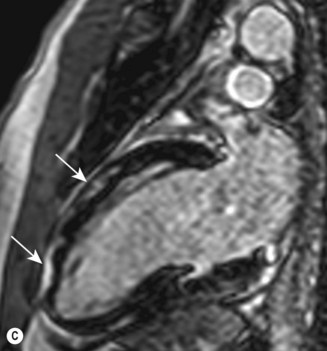
Cardiac MRI is now widely used for the assessment of cardiac structure and ventricular function. It can differentiate between myocardial infarction (Fig 11.52), oedema, fibrosis and fat. MRI is well validated for the assessment of myocardial viability and ischaemia. It is therefore used in the diagnosis of coronary artery disease, myocarditis (Fig. 11.53) and cardiomyopathies. It is also used to guide therapy in patients with documented coronary artery disease, particularly those with chronic coronary occlusions or multivessel disease, the presence of viability or ischaemia, respectively, providing justification for revascularization. Cardiac MRI does not involve the use of ionizing radiation so it can be used safely for repeated follow-up assessments and it is unique among cardiac imaging modalities in being able to assess myocardial function, viability and ischaemia in a single study. MRI provides an accurate assessment of valve regurgitant fraction and it is also highly sensitive for the diagnosis of aortic dissection (Fig. 11.54), intracardiac tumours and thrombi.
Cardiac catheterization
Cardiac angiography
Aortic root angiography
Injection of contrast into the aortic root demonstrates the vascular anatomy in suspected aneurysm or dissection, and also permits evaluation of aortic valve function (Fig. 11.55). The normal aortic valve prevents diastolic backflow of contrast, but in aortic regurgitation, variable opacification of the left ventricle occurs, depending on the severity of the valve lesion.
Left ventricular angiography
Contrast injection into the left ventricle defines ventricular anatomy and wall motion, and also permits evaluation of mitral valve function. Dilatation of the ventricle and contractile dysfunction occurs in left ventricular failure. An akinetic segment denotes previous myocardial infarction. Exaggerated contractile function with systolic obliteration of the cavity occurs in hypertrophic cardiomyopathy. Filling defects within the ventricular lumen may indicate thrombus or neoplasm. The normal mitral valve prevents systolic backflow of contrast into the left atrium, but in mitral regurgitation, variable atrial opacification occurs, depending on the severity of the valve lesion (Fig. 11.56).
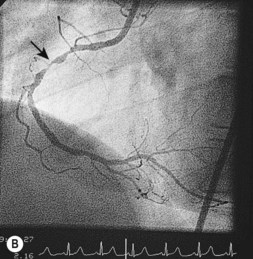
Coronary angiography
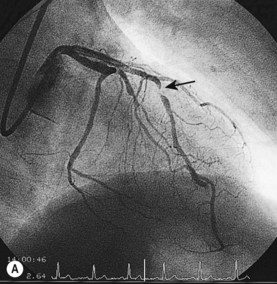
This is the most reliable technique for diagnostic imaging of the coronary arteries and assessment of lesion severity. Indications are summarized in Box 11.22. The technique requires selective injection of contrast into the left and right coronary arteries to opacify the lumen (Fig. 11.57), and multiple views in different projections are necessary for a complete study. Intraluminal filling defects or occlusions indicate coronary artery disease, which is nearly always caused by atherosclerosis. In stable patients, coronary angiography often reveals a stenosis or stenoses of intermediate severity. Additional information regarding the functional significance and anatomic severity of the disease is required before treatment decisions can be made. This can be obtained either from non-invasive myocardial perfusion imaging that looks for ischaemia in the territory of the affected artery (see MRI perfusion imaging) or from catheter laboratory-based techniques.
Box 11.22 Indications for coronary angiography


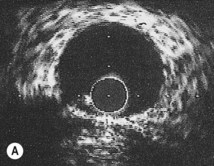
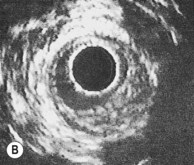
Intravascular ultrasound
An ultrasound transducer mounted at the tip of a coronary catheter is used to provide cross-sectional images of the artery. The technique permits accurate measurement of the luminal area and provides information about plaque composition and structure that cannot be obtained from angiographic images (Fig. 11.58). Intravascular ultrasound has a clinical role in quantifying the severity of intermediate stenoses identified on coronary angiography, optimizing stent deployment, assessing instent restenosis and stent thrombosis, and in clarifying the cause of equivocal angiographic appearances due to possible thrombus, dissection, calcium or plaque.
Intracardiac pressure measurement
Haemodynamic evaluation of valvular stenosis
In the normal heart, there is no pressure gradient across an open valve. Such a gradient usually indicates valvular stenosis (Fig. 11.59) and, as stenosis worsens, the pressure gradient increases. This therefore provides a useful index of the severity of stenosis. However, it must be recognized that the pressure gradient is influenced by the flow through the valve. For example, if cardiac output is very low, the gradient may be small despite the presence of severe stenosis. This applies particularly to the aortic valve because flow velocity is normally high. In patients with poor left ventricular function, the 2D appearances of the valve on echocardiography and estimates of valve area should be considered before concluding that significant aortic stenosis is not present.
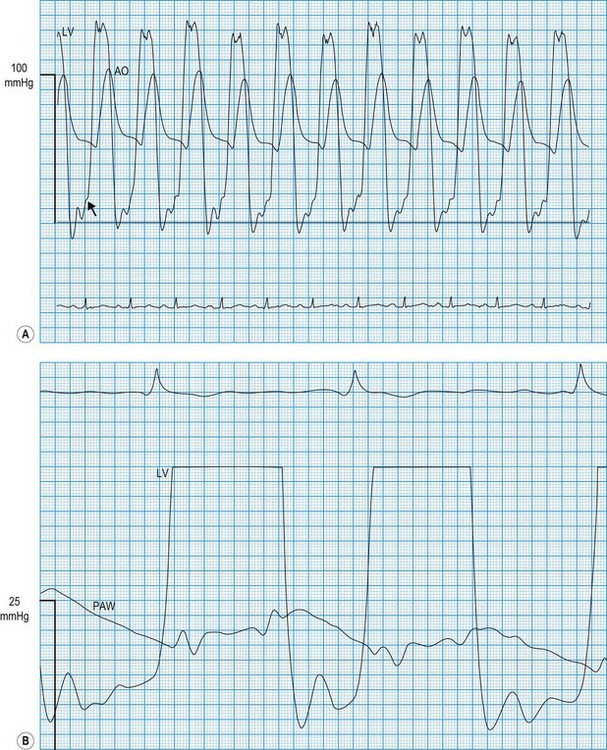
Haemodynamic evaluation of constriction and tamponade
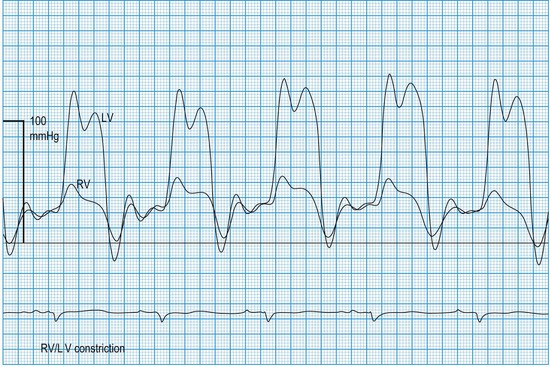
In constrictive pericarditis and tamponade (Boxes 11.23 and 11.24), diastolic relaxation of the ventricles is impeded, preventing adequate filling. Compensatory increments in atrial pressures occur to help maintain ventricular filling, and because these disorders usually affect both ventricles equally, the filling pressures also equilibrate. Thus, simultaneous left- and right-sided recordings in constrictive pericarditis and tamponade show characteristic elevation and equalization of the filling pressures (atrial or ventricular end-diastolic), with loss of the normal differential (Fig. 11.60). Similar physiology characterizes restrictive cardiomyopathy, in which infiltrative disease (usually amyloid in the UK) impedes relaxation of the ventricles.


Pathology laboratory support
Biochemistry laboratory
Bacteriology laboratory
Blood culture
In suspected infective endocarditis (Box 11.25), treatment must not be delayed beyond the time necessary to obtain three to four blood samples for culture (Table 11.2). Aerobic, anaerobic and fungal cultures should be performed. Occasionally, bone marrow cultures are helpful for detection of Candida and Brucella endocarditis. Coxiella and Chlamydia can never be cultured from the blood and must be diagnosed by serological tests. Failure to detect bacteraemia may be due to pretreatment with antibiotics, inadequate sampling (up to six blood samples should be taken over 24 hours) or infection with unusual microorganisms.


| Organism | Typical source of infection | First choice of antibiotics (pending sensitivity studies) |
|---|---|---|
| Streptococcus viridans | Upper respiratory tract | Benzylpenicillin: gentamicin |
| Streptococcus faecalis | Bowel and urogenital tract | Ampicillin: gentamicin |
| Anaerobic streptococcus | Bowel | Ampicillin: gentamicin |
| Staphylococcus epidermidis | Skin | Flucloxacillin: gentamicin |
| Fungi: Candida, histoplasmosis | Skin and mucous membranes | Amphotericin B*: 5-fluorocytosine* |
| Coxiella burnettii | Complication of Q fever | Chloramphenicol*: tetracycline* |
| Chlamydia psittaci | Contact with infected birds | Tetracycline* and erythromycin |
| Acute disease | ||
| Staphylococcus aureus | Skin | Flucloxacillin: gentamicin |
| Streptococcus pneumoniae | Complication of pneumonia | Benzylpenicillin: gentamicin |
| Neisseria gonorrhoeae | Venereal | Benzylpenicillin: gentamicin |
* These drugs are not bactericidal, and valve replacement is nearly always necessary to eradicate infection.
Serology
If a recent streptococcal throat infection can be confirmed by demonstrating an elevated serum antistreptolysin O titre, Jones’s criteria may be used for the diagnosis of rheumatic fever (Box 11.26). The presence of two major criteria, or one major and two minor criteria, indicates a high probability of rheumatic fever. In suspected viral pericarditis or myocarditis, the aetiological diagnosis depends on the demonstration of elevated viral antibody titres in acute serum samples, which decline during convalescence. Virus may sometimes be cultured from throat swabs and stools.


[/level-membership-for-internal-medicine-category][not-level-membership-for-internal-medicine-category]
11 Cardiovascular system
The cardiac history
The history should record details of presenting symptoms, of which the most common are chest pain, fatigue and dyspnoea, palpitations, and presyncope or syncope (see below and Box 11.1). Previous illness should also be recorded, as it may provide important clues about the cardiac diagnosis – thyroid, connective tissue and neoplastic disorders, for example, can all affect the heart. Rheumatic fever in childhood is important because of its association with valvular heart disease; and diabetes and dyslipidaemias because of their association with coronary artery disease. Smoking is a major risk factor for coronary artery disease. Alcohol abuse predisposes to cardiac arrhythmias and cardiomyopathy. The cardiac history should quantify both habits in terms of pack-years smoked and units of alcohol consumed. The family history should always be documented because coronary artery disease and hypertension often run in families, as do some of the less common cardiovascular disorders, such as hypertrophic cardiomyopathy. Indeed, in patients with hypertrophic cardiomyopathy, a family history of sudden death is probably the single most important indicator of risk. Finally, the drug history should be recorded, as many commonly prescribed drugs are potentially cardiotoxic. β-Blockers and some calcium channel blockers (diltiazem, verapamil), for example, can cause symptomatic bradycardias, and tricyclic antidepressants and β agonists can cause tachyarrhythmias. Vasodilators cause variable reductions in blood pressure which can lead to syncopal attacks, particularly in patients with aortic stenosis. The myocardial toxicity of certain cytotoxic drugs (notably doxorubicin and related compounds) is an important cause of cardiomyopathy.
Box 11.1 Structure for the cardiac history
History of presenting complaint (HPC)
This should define the nature of the symptoms, initially through open questioning. Closed questions are used to elicit the presence or absence of features which help to differentiate between diagnoses:
Chest pain
Myocardial ischaemia
Ischaemia of the heart results from an imbalance between myocardial oxygen supply and demand, producing pain called angina (Boxes 11.2 and 11.3). Angina is usually a symptom of atherosclerotic coronary artery disease, which impedes myocardial oxygen supply. Other causes of coronary artery disease (Box 11.4) are rare. However, it is important to be vigilant for causes of angina due to increased myocardial oxygen demand, such as aortic stenosis. The history is diagnostic for angina if the location of the pain, its character, its relation to exertion and its duration are typical. The patient describes retrosternal pain which may radiate into the arms, the throat or the jaw. It has a constricting character, is provoked by exertion and relieved within minutes by rest. The patient’s threshold for angina is typically reduced after eating or in cold weather due to the diversion of blood to the gut and the increased myocardial work consequent upon peripheral vasoconstriction, respectively. Occasionally angina is provoked only by the first significant activity of the day, a phenomenon known as the ‘warm-up effect’ and due to myocardial preconditioning. Less commonly, myocardial ischaemia may manifest as breathlessness, fatigue or symptoms that the patient finds difficult to describe – ‘I just have to stop’ – in which case the clues to the diagnosis are the relation of symptoms to exertion, the presence of risk factors for coronary artery disease and the absence of an alternative explanation for the symptoms, such as heart failure.
Box 11.2 Angina
Acute coronary syndromes
In these life-threatening cardiac emergencies, the pain is similar in location and character to angina but is usually more severe, more prolonged and unrelieved by rest (Box 11.5).
Pericarditis
This causes central chest pain, which is sharp in character and aggravated by deep inspiration, cough or postural changes. Characteristically, the pain is exacerbated by lying recumbent and reduced by sitting forward. Pericarditis is usually idiopathic or caused by Coxsackie B infection. It may also occur as a complication of myocardial infarction, but other causes are seen less commonly (Box 11.6).
Aortic dissection
This produces severe tearing pain in either the front or the back of the chest. The onset is abrupt, unlike the crescendo quality of ischaemic cardiac pain (Box 11.7).
Pulmonary embolism
Peripheral pulmonary embolism causes sudden-onset sharp, pleuritic chest pain, breathlessness and haemoptysis. Major, central pulmonary embolism presents with breathlessness, chest pain that can be indistinguishable from ischaemic chest pains and syncope. Risk factors for pulmonary embolism should be sought in the history (Box 11.8).
Box 11.8 Pulmonary embolism
Diagnosis
d-Dimer: a negative d-dimer in a low-risk patient makes pulmonary embolism very unlikely
ECG: sinus tachycardia; right bundle branch block (RBBB); classical ‘S1, Q3, T3’ pattern uncommon
Chest X-ray: normal; wedge-shaped peripheral opacification; absent pulmonary vascular markings
Echocardiogram: dilated right heart in some cases of large central pulmonary embolism
CT pulmonary angiogram: has superseded V/Q scanning as the diagnostic test of choice
Comments
Suspect pulmonary embolism in patients with unexplained hypoxia. Thrombolyic therapy should be considered for patients with pulmonary embolism associated with shock and/or a dilated right heart on echo. Patients with no risk factors for pulmonary embolism should be investigated for prothrombotic states.
Dyspnoea
Dyspnoea is an abnormal awareness of breathing occurring either at rest or at an unexpectedly low level of exertion. It is a major symptom of many cardiac disorders, particularly left heart failure (Table 11.1), but its mechanisms are complex. In acute pulmonary oedema and orthopnoea, dyspnoea is due mainly to the elevated left atrial pressure that characterizes left heart failure (Box 11.9). This produces a corresponding elevation of the pulmonary capillary pressure and increases transudation into the lungs, which become oedematous and stiff. Oxygenation of blood in the pulmonary arterioles is reduced causing hypoxaemia, and this, together with the extra effort required to ventilate the stiff lungs, causes dyspnoea. In exertional dyspnoea, other mechanisms are also important.
| Ventricular pathophysiology | Clinical examples |
|---|---|
| Restricted filling |
Exertional dyspnoea
This is the most troublesome symptom in heart failure (Box 11.10). Exercise causes a sharp increase in left atrial pressure and this contributes to the pathogenesis of dyspnoea by causing pulmonary congestion (see above). However, the severity of dyspnoea does not correlate closely with exertional left atrial pressure, and other factors must therefore be important. These include respiratory muscle fatigue and the effects of exertional acidosis on peripheral chemoreceptors. As left heart failure worsens, exercise tolerance deteriorates. In advanced disease, the patient is dyspnoeic at rest.
Box 11.10 Congestive heart failure
Diagnosis
Dizziness and syncope
Valvular obstruction
Fixed valvular obstruction in aortic stenosis may prevent a normal rise in cardiac output during exertion, such that the physiological vasodilatation that occurs in exercising muscle produces an abrupt reduction in blood pressure and cerebral perfusion, resulting in syncope. Vasodilator therapy may cause syncope by a similar mechanism. Intermittent obstruction of the mitral valve by left atrial tumours (usually myxoma) may also cause syncopal episodes (Fig. 11.1).
Stokes-Adams attacks
These are caused by self-limiting episodes of asystole (Fig. 11.2) or rapid tachyarrhythmias (including ventricular fibrillation). The loss of cardiac output causes syncope and striking pallor. Following restoration of normal rhythm, recovery is rapid and associated with flushing of the skin as flow through the dilated cutaneous bed is re-established.
The cardiac examination
A methodical approach is recommended, starting with inspection of the patient and proceeding to examination of the radial pulse, measurement of heart rate and blood pressure, examination of the neck (carotid pulse, jugular venous pulse), palpation of the anterior chest wall, auscultation of the heart, percussion and auscultation of the lung bases and, finally, examination of the peripheral pulses and auscultation for carotid and femoral arterial bruits (Box 11.11).
Box 11.11 Routine for the cardiovascular system examination
Observe general appearance – comfortable, breathless, pale?
Inspect the hands for clubbing, splinter haemorrhages, nicotine staining
Examine the radial pulse(s) for symmetry, rate, rhythm, character (collapsing?)
Assess the height and waveform of the JVP
Examine the carotid pulse character (slow rising?) and volume (Corrigan’s sign?)
Inspect the chest for scars and pulsations
Assess the position and character of the apex beat
Palpate the praecordium for heaves and thrills
Inspection of the patient
Oedema
1 Reduced sodium delivery to the nephron. This is caused by reduced glomerular filtration due to constriction of the preglomerular arterioles in response to sympathetic activation and angiotensin II production.
2 Increased sodium reabsorption from the nephron. This is the more important mechanism. It occurs particularly in the proximal tubule early in heart failure but, as failure worsens, renin-angiotensin activation stimulates aldosterone release, which increases sodium reabsorption in the distal nephron.
Arterial pulse
The arterial pulses should be palpated for evaluation of rate, rhythm, character and symmetry.
Character
This is defined by the volume and waveform of the pulse and should be evaluated at the right carotid artery (i.e. the pulse closest to the heart and least subject to damping and distortion in the arterial tree). Pulse volume provides a crude indication of stroke volume, being small in heart failure and large in aortic regurgitation. The waveform of the pulse is of greater diagnostic importance (Fig. 11.3). Severe aortic stenosis produces a slow-rising carotid pulse; the fixed obstruction restricts the rate at which blood can be ejected from the left ventricle. In aortic regurgitation, in diastole, the left ventricle receives not only its normal pulmonary venous return but also a proportion of the blood ejected into the aorta during the previous systole as it flows back through an incompetent valve. The resultant large stroke volume, vigorously ejected, produces a rapidly rising carotid pulse, which collapses in early diastole owing to backflow through the aortic valve. This collapsing pulse can be exaggerated at the radial artery by lifting the arm. In mixed aortic valve disease, a biphasic pulse with two systolic peaks is occasionally found. Alternating pulse – alternating high and low systolic peaks – occurs in severe left ventricular failure but the mechanism for this is unknown. Paradoxical pulse refers to an inspiratory decline in systolic pressure greater than 10 mmHg (Fig. 11.4). In normal circumstances, inspiration results in an increase in venous return as blood is ‘sucked into’ the thorax by the decline in intrathoracic pressure. This increases right ventricular stroke volume, but left ventricular stroke volume falls slightly (ventricular interdependence). When the heart is constrained in a ‘fixed box’ by a pericardial effusion (cardiac tamponade) or by thickened pericardium (pericardial constriction), the increased inspiratory right ventricular blood volume reduces left ventricular compliance resulting in a more pronounced reduction in left ventricular filling, stroke volume and systolic blood pressure during inspiration. ‘Pulsus paradoxus’ therefore represents an exaggeration of the normal inspiratory decline in systolic pressure and is not truly paradoxical. Pulsus paradoxus in acute severe asthma is thought to be due to negative pleural pressure increasing afterload and thereby impedence to left ventricular emptying.
Jugular venous pulse
Jugular venous pressure
The jugular venous pressure (JVP) should be assessed from the waveform of the internal jugular vein which lies adjacent to the medial border of the sternocleidomastoid muscle. Distention of the external jugular vein is a useful clue to an elevated JVP but, strictly speaking, it should not be used because it can be compressed as it passes under the clavicle. The JVP is measured in centimetres vertically from the sternal angle to the top of the venous waveform. The normal upper limit is 4 cm. This is about 9 cm above the right atrium and corresponds to a pressure of 6 mmHg. Elevation of the JVP indicates a raised right atrial pressure unless the superior vena cava is obstructed, producing engorgement of the neck veins (Box 11.12). During inspiration, the pressure within the chest decreases and there is a fall in the JVP. In constrictive pericarditis, and less commonly in tamponade, inspiration produces a paradoxical rise in the JVP (Kussmaul’s sign) because the increased venous return that occurs during inspiration cannot be accommodated within the constrained right side of the heart (Fig. 11.5).
Waveform of jugular venous pulses
In sinus rhythm, the jugular venous pulse has a double waveform attributable to the ‘a’ and ‘v’ waves separated by the ‘x’ and ‘y’ descents. The ‘a’ wave is produced by atrial systole. It is followed by the ‘x’ descent (marking descent of the tricuspid valve ring), which is interrupted by the diminutive ‘c’ wave caused by tricuspid valve closure. Atrial pressure then rises again, producing the ‘v’ wave as the atrium fills passively during ventricular systole. The decline in atrial pressure as the tricuspid valve opens to allow ventricular filling produces the ‘y’ descent. Important abnormalities of the pattern of deflections are shown in Figure 11.6.
In atrial fibrillation, there is no atrial contraction. Consequently, there is no ‘a’ wave and the jugular venous pulse loses its double waveform. It is not always easy to differentiate venous from arterial pulsations in the neck, but several features help to distinguish the jugular venous pulse from the carotid arterial pulse (Box 11.13).
Auscultation of the heart
The diaphragm and bell of the stethoscope permit appreciation of high- and low-pitched auscultatory events, respectively. The apex, lower left sternal edge, upper left sternal edge and upper right sternal edge should be auscultated in turn. These locations correspond respectively to the mitral, tricuspid, pulmonary and aortic areas, and loosely identify sites at which sounds and murmurs arising from the four valves are best heard (Box 11.14).
Box 11.14 Routine for auscultation of the heart
Auscultate at apex with diaphragm
Reposition patient on left side – ‘Please turn onto your left side’
Listen with diaphragm (mitral regurgitation) and then bell (mitral stenosis)
Return patient to original position, reclining at 45°
Auscultate with diaphragm at upper right sternal edge (aortic stenosis, hypertrophic cardiomyopathy)
Auscultate over the carotid arteries (radiation of murmur of aortic stenosis, carotid artery bruits)
Second sound (S2)
This corresponds to aortic and pulmonary valve closure following ventricular ejection. S2 is single during expiration. Inspiration, however, causes physiological splitting into aortic followed by pulmonary components because increased venous return to the right side of the heart delays pulmonary valve closure. Important abnormalities of S2 are illustrated in Figure 11.7.
Heart murmurs
These are caused by turbulent flow within the heart and great vessels (Fig. 11.8). Occasionally the turbulence is caused by increased flow through a normal valve – usually aortic or pulmonary – producing an ‘innocent’ murmur. However, murmurs may also indicate valve disease or abnormal communications between the left and right sides of the heart (e.g. septal defects).
