[level-membership-for-anesthesiology-category]
Chapter 3 Cardiac Physiology
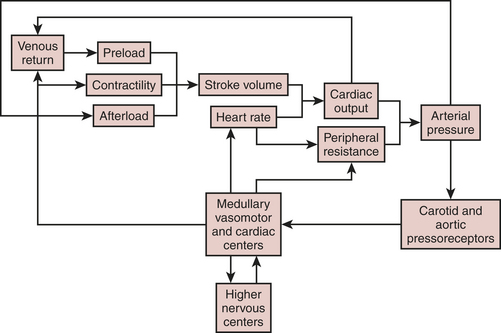
Heart rate, preload, afterload, and contractility determine CO, which, in turn, when combined with peripheral arterial resistance, determines arterial pressure for organ perfusion. Similarly, the arterial system contributes to ventricular afterload, and these interactions influence mechanoreceptors in the carotid artery and aortic arch, providing feedback signals to higher levels in the central nervous system (medullary and vasomotor center). These centers then modulate venous return, HR, contractility, and arterial resistance (Fig. 3-1).
CARDIAC CYCLE
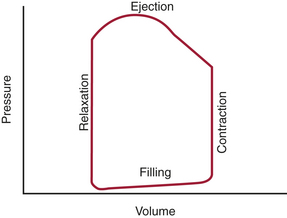
The cardiac cycle of the left ventricle (LV) begins as excitation of the myocardium, which results in a sequence of mechanical events that lead to a pressure gradient being developed, ejection of the stroke volume (SV), and forward flow of blood through the body. These phases can be discussed based on the electrical activity, intracardiac pressures, intracardiac volumes, opening and closing of the cardiac valves, or the flow of blood into the peripheral circulation. Most practical of these is the relationship of pressure to volume over the course of the cycle. In this regard, systole represents the rapid increase in intracardiac pressure followed by the rapid decrease in volume. Diastole, on the other hand, represents first a rapid decrease in pressure followed by an increase in volume. An alternative to this approach is to exclude any temporal element and to study the relation of pressure to volume in the framework of a pressure-volume diagram (Fig. 3-2). In this diagram, the pressure is typically displayed on the vertical axis and the volume on the horizontal axis. This yields a pressure-volume loop of four distinct phases over the course of one contraction: isovolumic contraction, ventricular ejection (rapid and slow), isovolumic relaxation, and filling (rapid and diastasis).
Phases of the Cardiac Cycle
Isovolumic Contraction Phase
This phase represents the first portion of systolic activity of the myocardial muscle. It occurs just after the QRS complex on the ECG, when individual myocardial fibers begin to shorten. As the contraction continues, the ventricular pressure increasesrapidly, exceeding atrial pressure and forcing the atrioventricular (AV) valve to close due to the reversed pressure gradient. While the AV valve closes, it also balloons up into the atrium and causes the chordal apparatus to tense, holding the coaptation point at its optimal position, thus preventing regurgitation. This now forms a sealed chamber (ventricle) because the AV valve has closed and the semilunar valves have yet to open. The ventricle continues to alter shape without changing its volume, thereby resulting in increased pressure. In awake canine hearts, the ventricle has been shown to change into an ellipse. This shape seems to be volume dependent, and at lower volumes the shape during contraction is spherical.1
Ejection Phase

In addition, by using the SV equation divided by the EDV, ejection fraction (EF) can be obtained:
EF is a well-known estimation of global cardiac function that is used worldwide. It allows application of the Starling principle in the study of cardiac function based on changes in EDV as they relate to SV. The use of transesophageal echocardiography (TEE) has greatly enhanced the clinician’s ability to directly visualize EDV and ESV using biplane apical and single-plane ellipsoidal methods.2
DIASTOLIC FUNCTION
Diastology, or the study of diastolic function, has become the most important focus of cardiac physiology in the past few years. Diastolic dysfunction has been seen in 40% to 50% of patients with congestive heart failure (CHF) despite normal systolic function.3 This led to a shift in thinking about cardiac function not only as the typical systolic factors of contractile force, ejection of SV, and generation of CO but also as diastolic factors. The use of transthoracic echocardiography (TTE) and TEE has greatly improved this knowledge of diastole by showing the actual real-time activities in the heart, as related to filling pressures, shape, and relaxation. It is now possible to relate diastolic dysfunction, which is increased impedance to ventricular filling, to structural and pathologic causes of CHF (Table 3-1).
| Conditions | Mechanisms of Diastolic Dysfunction |
|---|---|
| Mitral or tricuspid stenosis | Increased resistance to atrial emptying |
| Constrictive pericarditis | Increased resistance to ventricular inflow, with decreased ventricular diastolic capacity |
| Restrictive cardiomyopathies (amyloidosis, hemochromatosis, diffuse fibrosis) | Increased resistance to ventricular inflow |
| Obliterative cardiomyopathy (endocardial fibroelastosis, Loeffler’s syndrome) | Increased resistance to ventricular inflow |
| Ischemic heart disease | Postinfarction scarring and hypertrophy (remodeling) |
| Flash pulmonary edema, dyspnea during angina | Diastolic calcium overload |
| Impaired myocardial relaxation | Increased resistance to ventricular inflow |
| Hypertrophic heart disease (hypertrophic cardiomyopathy, chronic hypertension, aortic stenosis) |
* Diastolic heart failure is increased resistance to filling of one or both cardiac ventricles.
From Grossmvan W: Diastolic dysfunction in congestive heart failure. N Engl J Med 325:1557, 1991.
Determinants of Diastolic Function
Myocardial Relaxation
passive ventricular filling
The first phase of filling starts with the opening of the mitral valve and the flow of blood down the newly generated pressure gradient from the LA into the LV. The rate of flow has both a rapid rate and slow rate as the pressure gradient approaches equilibration. Diastasis is the period of no flow across the mitral valve after the conclusion of passive filling and immediately before atrial systole. The main determinants of transmitral flow are the LV compliance (stiffness) and the rate of rise of the transmitral gradient. Many disease states can contribute to increasing stiffness of the ventricle and thus affect the amount of passive filling that can occur during the early phase of diastole. In aging, angina, coronary artery disease, and hypertrophic obstructive cardiomyopathy, myocardial stiffness is greatly increased, thus impairing inflow into the ventricle.4 Numerous drugs and cardiac revascularization can all improve dysfunction or reduce exercise-induced stiffness.
Relating Echocardiography to Diastolic Function
The relationship between the stages of diastolic function and findings on both TEE and TTE has greatly enhanced the study and importance of diastolic function (Box 3-1). Using TTE and TEE in combination with Doppler techniques has made it possible via indirect means to obtain LV filling patterns.5 The most commonly accepted means of analyzing the flow patterns are via the Doppler transmitral flow and the pulmonary vein flow. Newer modes of measurement using tissue Doppler and color M-mode are leading to further insights into diastolic function.
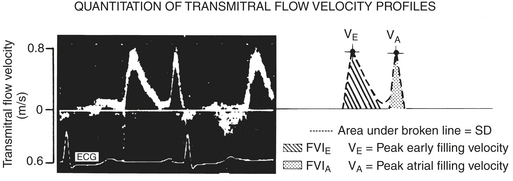
Transmitral flow patterns are the first method, which is performed by placing a pulsed-wave Doppler signal in the area between the leaflet tips of the mitral valve. Two waves are obtained: first the E wave, which represents the early passive flow across the mitral valve; and second, the A wave, which represents atrial systole (Fig. 3-3). The small area of no flow between the E and A waves represents the diastasis.By comparing the ratios of these two waves it is possible to form a view of diastolic function. The ratios change with disease and age to yield several patterns, which represent different stages of failure. In early diastolic failure, the E/A wave ratio becomes less than 1, and the waves reverse with the E wave being shorter than the A wave; this is known as the delayed relaxation pattern. As failure progresses, the waves become pseudonormalized; that is, the E/A ratio reverts to the normal pattern of greater than 1. The final stage of failure as seen via the mitral valve shows a high, rapidly decelerating E wave with a small A wave; this pattern is known as the restrictive pattern. The use of these patterns on Doppler imaging allows for the staging of diastolic failure from a mild form to a more severe form.6,7
SYSTOLIC FUNCTION

Stroke Volume
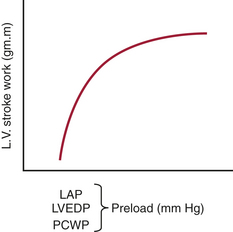
Preload
definition
measurement
The LVEDV is difficult to measure clinically, and measurements have only recently become possible with techniques such as echocardiography. TEE has been extensively used to measure LV areas as an approximation of LV volumes. Some studies have found a good correlation between areas and volumes and have also shown that in surgical patients EDV derived from a single plane is a significant determinant of SV.8
The LVEDP can be measured with placement of a catheter into the LA. The LA catheter is commonly inserted surgically through one of the pulmonary veins. The LAP provides a good approximation of LVEDP, provided the mitral valve is normal (Fig. 3-4). The most common technique for the estimation of LVEDP during cardiac surgery is the placement of a pulmonary artery (PA) catheter. The PCWP usually provides a good approximation of LVEDP. Marked alterations in airway pressure, such as occur during the use of high levels of positive end-expiratory pressure (PEEP), may disturb the relationship between the PCWP and LAP. Depending on the compliance of the pulmonary parenchyma, either part or all of the airway pressure may be transmitted to the PA catheter. This must be considered when evaluating LV filling pressure with the PA catheter in patients receiving mechanical ventilation and PEEP. When the catheter cannot be advanced into the wedge position, the PADP may be used to estimate the LVEDP. It is usually quite accurate unless the pulmonary vascular resistance (PVR) is markedly elevated. The CVP provides the poorest estimateof LVEDP, although it is frequently used in patients with good function of the RV and LV. When cardiac disease is characterized by disparate RV and LV functions, the CVP may be misleading as an indicator of LVEDP.
Afterload
definition
Afterload is the second major determinant of the mechanical properties of cardiac muscle fibers and performance of the intact heart (Box 3-2). Afterload can be considered either as the stress imposed on the ventricular wall during systole or as the arterial impedance to the ejection of SV.


Contractility
definition
The third determinant of SV is contractility. Contractility is an intrinsic property of the cardiac cell that defines the amount of work that the heart can perform at a given load. It is primarily determined by the availability of intracellular Ca2+. With depolarization of the cardiac cell, a small amount of Ca2+ enters the cell and triggers the release of additional Ca2+ from intracellular storage sites (sarcoplasmic reticulum). The Ca2+ binds to troponin, tropomyosin is displaced from the active binding site on actin, and actin-myosin crossbridges are formed. All agents with positive inotropic properties, such as the catecholamines, have in common that they increase intracellular Ca2+, whereas negative inotropes have the opposite effect (Table 3-2).9
| Factors Increasing Contractility |
determinants

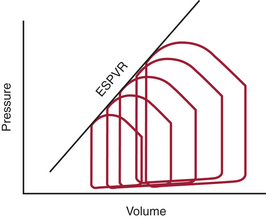
Load-Independent Indices.
Because traditional indices of contractility are load dependent, different approaches to the quantification of the contractile properties of the heart have been explored. In one such approach, Suga and colleagues10,11 studied instantaneous pressure and volume in the canine heart. The ratio of ventricular pressure over volume is the ventricular elastance, which varies throughout the cardiac cycle. For each cardiac cycle, these researchers defined the maximal value of this ratio as the end-systolic elastance (EES) and the point at which it was reached as the end-systolic point. They further noted that with rapid decreases in preload all consecutive end-systolic points were positioned on a single straight line, known as the end-systolic pressure-volume relation (ESPVR) (Fig. 3-5). The slope of this line (EES) is proportional to contractility; it is steeper at higher contractility and flatter at lower contractility.
RIGHT VENTRICULAR FUNCTION
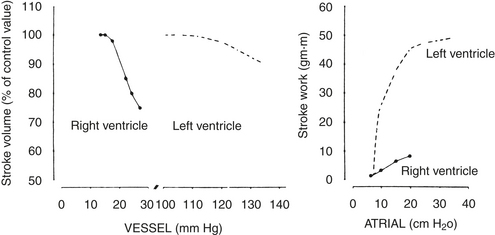
The contractile pattern, as well as the afterload presented to each ventricle (i.e., RV vs. LV), results in marked physiologic differences between the ventricles (Box 3-3). In contrast to the LV, which has a relatively simple and unified mechanism of contraction (by coaxial shortening), RV contraction occurs in three distinct phases. Initially, the spiral muscles contract, resulting in a downward movement of the tricuspid valve and shortening of the longitudinal axis of the RV chamber. This is followed by movement of the RV free wall inward toward the intraventricular septum. Because the RV free wall has limited muscular power, alterations in or failure of the intraventricular septum to contract normally will disturb the systolic function of the RV to a much greater degree than does a loss of RV free wall contractility. Finally, the third phase of RV contraction occurs when LV contraction imposes a “wringer” action, further augmenting overall RV contraction.
Global RV function is exquisitely sensitive to the impedance offered by the pulmonary vasculature.12 In comparison with the LV, which maintains a constant output over a relatively wide range of afterloads, the RV output abruptly decreases with even small increases in afterload (Fig. 3-6). Under normal conditions of RV function, any increase in afterload is accompanied by a substantial decrease in RVEF. However, normal RV contractile function is usually maintained until the mean PAP is 40 mm Hg or greater. Conversely, the RV appears to be less preload dependent than the LV (i.e., for a given preload, a smaller increase in SV is seen in the RV).
VENTRICULAR INTERACTION
Ventricular interaction is a process that is vital to the integration of heart and lung function. This relationship occurs both during systole and diastole and is a result of an intimate anatomic association between the RV and LV. The major physiologic impactof this ventricular interaction relates to (1) the effect of the distention of one ventricle on the other, and (2) the contribution of LV contraction to the development of RV systolic pressure. Factors that contribute to normal ventricular interaction include the intraventricular septum, pericardium, and shared coronary blood flow.13–16
SUMMARY
1. Grayzel J. The cardiac cycle. J Cardiothorac Vasc Anesth. 1991;5:649.
2. Schiller N.B. Ejection fraction by echocardiography. Am Heart J. 2003;146:380.
3. Groban L. Diastolic dysfunction in the elderly. J Cardiothorac Vasc Anesth. 2005;19:228.
4. Redfield M.M. Understanding diastolic heart failure. N Engl J Med. 2004;350:1930.
5. Maurer M.S., Spevack D., Birkhoff D., et al. Diastolic dysfunction diagnosed by Doppler echocardiography. J Am Coll Cardiol. 2004;44:1543.
6. Zile M.R., Brutsaert D.L. New concepts in diastolic dysfunction and diastolic heart failure: I. Diagnosis, prognosis, and measurements of diastolic function. Circulation. 2002;105:1387.
7. Weyman A.E. The year in echocardiography. J Am Coll Cardiol. 2005;45:448.
8. Thys D.M., Hillel Z., Goldman M.E., et al. Comparison of hemodynamic indices derived by invasive monitoring and two-dimensional echocardiography. Anesthesiology. 1987;67:630.
9. Krueger J.W. Fundamental mechanisms that govern cardiac function: A short review of sarcomere mechanics. Heart Failure. 1988;4:137.
10. Suga H., Sagawa K., Shoukas A.A. Load independence of the instantaneous pressure-volume ratio of the canine left ventricle and effects of epinephrine and heart rate on the ratio. Circ Res. 1973;32:314.
11. Suga H., Sagawa K. Instantaneous pressure-volume relationships and their ratio in the excised supported canine left ventricle. Circ Res. 1974;35:117.
12. Stein P.D., Sabbath H.H., Auler D.T., et al. Performance of the failing and non-failing right ventricle of patients with pulmonary hypertension. Am J Cardiol. 1979;44:1050.
13. Dell’Italia L.J., Walsh R.A. Right ventricular diastolic pressure-volume relations and regional dimensions during acute alterations in loading conditions. Circulation. 1988;77:1276.
14. Dell’Italia L. The right ventricle: Anatomy, physiology and clinical implications. Curr Probl Cardiol. 1991;16:659.
15. Katz A. Ernest Henry Starling: His predecessors and the “law of the heart”. Circulation. 2002;106:2986.
16. Carabello B. Evolution of the study of left ventricular function: Everything old is new again. Circulation. 2002;105:2701.
[/level-membership-for-anesthesiology-category][not-level-membership-for-anesthesiology-category]
Chapter 3 Cardiac Physiology
Heart rate, preload, afterload, and contractility determine CO, which, in turn, when combined with peripheral arterial resistance, determines arterial pressure for organ perfusion. Similarly, the arterial system contributes to ventricular afterload, and these interactions influence mechanoreceptors in the carotid artery and aortic arch, providing feedback signals to higher levels in the central nervous system (medullary and vasomotor center). These centers then modulate venous return, HR, contractility, and arterial resistance (Fig. 3-1).
CARDIAC CYCLE
The cardiac cycle of the left ventricle (LV) begins as excitation of the myocardium, which results in a sequence of mechanical events that lead to a pressure gradient being developed, ejection of the stroke volume (SV), and forward flow of blood through the body. These phases can be discussed based on the electrical activity, intracardiac pressures, intracardiac volumes, opening and closing of the cardiac valves, or the flow of blood into the peripheral circulation. Most practical of these is the relationship of pressure to volume over the course of the cycle. In this regard, systole represents the rapid increase in intracardiac pressure followed by the rapid decrease in volume. Diastole, on the other hand, represents first a rapid decrease in pressure followed by an increase in volume. An alternative to this approach is to exclude any temporal element and to study the relation of pressure to volume in the framework of a pressure-volume diagram (Fig. 3-2). In this diagram, the pressure is typically displayed on the vertical axis and the volume on the horizontal axis. This yields a pressure-volume loop of four distinct phases over the course of one contraction: isovolumic contraction, ventricular ejection (rapid and slow), isovolumic relaxation, and filling (rapid and diastasis).
Phases of the Cardiac Cycle
Isovolumic Contraction Phase
This phase represents the first portion of systolic activity of the myocardial muscle. It occurs just after the QRS complex on the ECG, when individual myocardial fibers begin to shorten. As the contraction continues, the ventricular pressure increasesrapidly, exceeding atrial pressure and forcing the atrioventricular (AV) valve to close due to the reversed pressure gradient. While the AV valve closes, it also balloons up into the atrium and causes the chordal apparatus to tense, holding the coaptation point at its optimal position, thus preventing regurgitation. This now forms a sealed chamber (ventricle) because the AV valve has closed and the semilunar valves have yet to open. The ventricle continues to alter shape without changing its volume, thereby resulting in increased pressure. In awake canine hearts, the ventricle has been shown to change into an ellipse. This shape seems to be volume dependent, and at lower volumes the shape during contraction is spherical.1
Ejection Phase
In addition, by using the SV equation divided by the EDV, ejection fraction (EF) can be obtained:
EF is a well-known estimation of global cardiac function that is used worldwide. It allows application of the Starling principle in the study of cardiac function based on changes in EDV as they relate to SV. The use of transesophageal echocardiography (TEE) has greatly enhanced the clinician’s ability to directly visualize EDV and ESV using biplane apical and single-plane ellipsoidal methods.2
DIASTOLIC FUNCTION
Diastology, or the study of diastolic function, has become the most important focus of cardiac physiology in the past few years. Diastolic dysfunction has been seen in 40% to 50% of patients with congestive heart failure (CHF) despite normal systolic function.3 This led to a shift in thinking about cardiac function not only as the typical systolic factors of contractile force, ejection of SV, and generation of CO but also as diastolic factors. The use of transthoracic echocardiography (TTE) and TEE has greatly improved this knowledge of diastole by showing the actual real-time activities in the heart, as related to filling pressures, shape, and relaxation. It is now possible to relate diastolic dysfunction, which is increased impedance to ventricular filling, to structural and pathologic causes of CHF (Table 3-1).
| Conditions | Mechanisms of Diastolic Dysfunction |
|---|---|
| Mitral or tricuspid stenosis | Increased resistance to atrial emptying |
| Constrictive pericarditis | Increased resistance to ventricular inflow, with decreased ventricular diastolic capacity |
| Restrictive cardiomyopathies (amyloidosis, hemochromatosis, diffuse fibrosis) | Increased resistance to ventricular inflow |
| Obliterative cardiomyopathy (endocardial fibroelastosis, Loeffler’s syndrome) | Increased resistance to ventricular inflow |
| Ischemic heart disease | Postinfarction scarring and hypertrophy (remodeling) |
| Flash pulmonary edema, dyspnea during angina | Diastolic calcium overload |
| Impaired myocardial relaxation | Increased resistance to ventricular inflow |
| Hypertrophic heart disease (hypertrophic cardiomyopathy, chronic hypertension, aortic stenosis) |
* Diastolic heart failure is increased resistance to filling of one or both cardiac ventricles.
From Grossmvan W: Diastolic dysfunction in congestive heart failure. N Engl J Med 325:1557, 1991.
