3 Cardiac Catheterization Laboratory
Diagnostic and Therapeutic Procedures in the Adult Patient
The cardiac catheterization laboratory began as a diagnostic unit. In the 1980s, percutaneous transluminal coronary angioplasty (PTCA) started the gradual shift to therapeutic procedures. Concomitantly, noninvasive modalities of echocardiography, computed tomography (CT), and magnetic resonance imaging (MRI) improved and, in some cases, obviated the need for diagnostic catheterization studies. Some experts predict the imminent demise of diagnostic cardiac catheterization studies.1,2 Of course, the promise of PTCA led to various atherectomy and aspiration devices and stents, with or without drug elution. The evolution of the cardiac catheterization laboratory has continued, with many laboratories commonly performing procedures for the diagnosis and treatment of peripheral and cerebral vascular disease.3 There also has been an expansion of the treatment of noncoronary forms of cardiac disease in the catheterization laboratory. Closure devices for patent foramen ovale (PFO)/atrial septal defect (ASD)/ventricular septal defect (VSD) are emerging as alternatives to cardiac surgery. Balloon valvuloplasty is well established, and percutaneous valve replacement/repair is in development. A variety of devices for circulatory support are now available for implantation by percutaneous methods. Finally, the era of “hybrid laboratories” has begun. Hybrid procedures include implantation of aortic stent grafts and performance of combined coronary artery bypass/stenting procedures (see Chapter 26). Such procedures require “routine” involvement of anesthesiologists in the catheterization laboratory.
Where and how did this entity called cardiac catheterization begin? In 1929, Dr. Werner Forssmann was a resident in the Auguste Viktoria Hospital at Eberswald near Berlin. At that time, cardiac arrests during anesthesia and surgery were not uncommon. Treatment included heroic measures such as intracardiac injection of epinephrine, which often resulted in fatal intrapericardial hemorrhage. In an effort to identify a safer route for delivery of medicine directly into the heart, Dr. Forssmann asked a colleague to place a catheter in his arm. The catheter was successfully passed to his axilla, at which time Dr. Forssmann, under radioscopic guidance and using a mirror, advanced the catheter into his own right atrium (RA). His mentor, Professor Ferdinand Sauerbruch, a leading surgeon in Berlin at the time, was quoted as saying, “I run a clinic, not a circus!” Dr. Forssmann subsequently practiced in a small town in the Rhine Valley, but eventually shared the Nobel Prize in 1956 for this procedure.4
Fortunately, the remainder of the world quickly acknowledged Forssmann’s accomplishments5 with right-heart catheterization; in 1930, Dewey measured cardiac output (CO) using the Fick method. In 1941, André Cournand published his work on right-sided heart catheterization in the Proceedings of the Society of Experimental Biology and Medicine. Dexter and his colleagues first reported cardiac catheterization in the pediatric population in 1947, and first documented correlation between the pulmonary capillary wedge pressure (PCWP) and the left atrial pressure (LAP). Zimmerman and Mason first performed arterial retrograde heart catheterization in 1950, and Seldinger developed his percutaneous approach in 1953. Ross6 and Cope developed transseptal catheterization in 1959. The first coronary angiogram was performed inadvertently by Mason Sones in October 1958. While performing angiography of the aorta, the catheter moved during x-ray equipment placement, and Dr. Sones injected 50 mL of contrast into the right coronary artery (RCA). Expecting cardiac arrest from this amount of contrast and with no external defibrillator available in 1958, Dr. Sones jumped to his feet and grabbed a scalpel to perform a thoracotomy. Fortunately, asystole lasted only 5 seconds, the patient awoke perplexed by the commotion, and the birth of selective coronary angiography happened.7
Diagnostic catheterization led to interventional therapy in 1977 when Andreas Gruentzig performed his first PTCA. Refinements in both diagnostic and interventional equipment occurred over the next 15 to 20 years, but the focus remained on coronary artery disease (CAD). Over the past decade or so, cardiologists have expanded into the diagnosis and treatment of peripheral vascular disease and treatment of structural heart disease. In the near future, clinicians expect to see advances in all of these interventional areas, as well as the emergence of percutaneous valve replacement or repair. Endovascular treatment of aortic disease is expanding as the relative merits of this approach are clarified. Such treatment requires the services of a multidisciplinary team that includes an anesthesiologist. The percutaneous treatment of valvular heart disease will require a similar multidisciplinary approach. Hybrid bypass procedures are performed in some institutions with internal mammary artery grafting to the left anterior descending (LAD) artery via a limited incision and percutaneous treatment of other vessels.8 Many newer catheterization laboratories are designed for these multidisciplinary procedures with the necessary access, ventilation, and lighting. Because anesthesiologists will work in these suites, it seems intuitive that they should participate in their design.
This brief historical background serves as an introduction to the discussion of diagnostic and therapeutic procedures in the adult catheterization laboratory.9 The reader must realize the dynamic nature of this field. Although failed percutaneous coronary interventions (PCIs) once occurred in up to 5% of coronary interventions, most centers now report procedural failure rates of less than 1%. Simultaneously, the impact on the anesthesiologist has changed. The high complication rates of years past required holding an operating room (OR) open for all PCIs, and many almost expected to see the patient in the OR. Current low complication rates lead to complacency, together with amazement and perhaps confusion when a PCI patient comes emergently to the OR. In addition, the anesthesiologist may find the information in this chapter useful in planning the preoperative management of a patient undergoing a cardiac or noncardiac surgical procedure based on diagnostic information obtained in the catheterization laboratory. Finally, it is the goal of these authors to provide a current overview of this field so that the collaboration between the anesthesiologist and the interventional cardiologist will be mutually gratifying.
Catheterization laboratory facilities: radiation safety, image acquisition, and physician credentialing

Room Setup/Design/Equipment
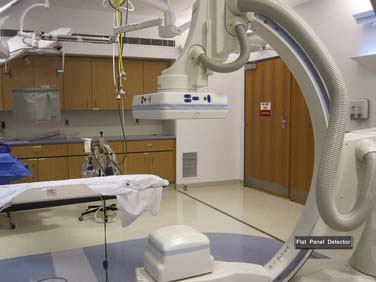
The setup and design for the hybrid cardiac catheterization OR is covered separately in Chapter 26. This section reviews the importance of radiation safety and physician credentialing. For the individual laboratory, the monitoring suite is separated from the x-ray imaging equipment by lead-lined glass, as well as lead-lined walls. Voice communication from the central area is maintained with each catheterization laboratory to coordinate tasks performed in the central area (e.g., monitoring and recording data, activated coagulation time [ACT] determination), thereby minimizing staff radiation exposure.10 A picture of a representative catheterization laboratory is shown in Figure 3-1.

Radiation Safety
Radiation safety must be considered at all times in the catheterization laboratory, from room design to everyday practice.11 Lead-lined walls, lead-glass partitions, and mobile lead shielding are useful in limiting the daily exposure of personnel.
A thermoluminescent film badge must be worn at all times by any personnel exposed to the X-ray equipment, with levels monitored regularly. In the past, anesthesiologists responding to emergencies in the catheterization laboratory were exposed to radiation briefly and infrequently (if at all). With the requirement for anesthesiologists in many of the newer multidisciplinary procedures, the inclusion of anesthesiologists in formal monitoring programs may be appropriate. Radiation levels should not exceed 5 rem per calendar year, and 1.25 rem per calendar quarter, or approximately 100 mrem per week.12 Operator and staff radiation have been assessed for years. However, only recently has the issue of radiation toxicity to the patient gained attention. With long PCI and electrophysiology procedures, radiation injury to the patient has been identified, and the need for monitoring dose delivery to the patient is now appreciated.13 Contemporary equipment estimates radiation doses to the patient, and recordings of theses doses are made. Lead aprons are mandatory for all personnel in the procedure suite. For those who need shielding for extended periods, lead apron and vest combinations may be more comfortable. Often cumbersome, these shields protect the gonads and about 80% of the active bone marrow.11 Thyroid and eye shielding also should be considered, particularly for those working in close proximity to the x-ray source.14
It is not in the scope of this chapter to cover all aspects of radiation. For a more complete review of this topic, a consensus document was published by the American College of Cardiology/American Heart Association/Heart Rhythym Society/Society of Cardiovascular Angiography and Interventions.15
Several aspects of radiation safety require a brief review. The duration of the procedure will increase exposure. Cine imaging (i.e., making a permanent recording) requires about 10 times the radiation of fluoroscopy. Although newer equipment may narrow this ratio and permanently record fluoroscopic images, limiting cine imaging will decrease exposure. Proximity to the x-ray tube, usually situated below the patient, is directly related to exposure. The bulk of the radiation exposure to medical personnel is the result of scattered x-rays coming from the patient. When working in an environment where x-rays are in use, clinicians should always remember the simple rule of radiation dose: The amount of radiation exposure is related to the square of the distance from the source. No body part should ever be placed in the imaging field when fluoroscopy/cine is being performed. Finally, the cardiologist can decrease x-ray scatter by placing the imaging equipment as close to the patient as possible, thereby decreasing personnel exposure.16
The anesthesiologist should recognize x-ray use in the catheterization laboratory and take appropriate precautions. For multidisciplinary procedures, this requires some attention to the location of equipment and the use of portable shields. It also is worth noting that most lead aprons have openings in the back, and protect best when the wearer is facing the source of the x-rays. Emergent situations, when the anesthesiologist is asked to resuscitate a critically ill patient during a procedure, may require the cardiologist to use fluoroscopic imaging while the anesthesiologist is within feet of, and often even straddling, the x-ray tube. With 96% of the x-ray beam scatter stopped with 0.5 mm of lead, aprons and thyroid shields clearly are neccessary to protect the anesthesiologist while at the head of the patient.11 The use of x-rays can almost always be interrupted to protect personnel; patient care may require the interruptions to be brief. A collaborative effort between the cardiologist and the anesthesiologist is necessary, and communication is essential. The goal of the anesthesiologist should be to treat the patient while protecting himself or herself from excess radiation.15

Filmless Imaging/Flat-Panel Technology
Essentially all modern laboratories use filmless or digital recording. Radiation is required to generate an image and recordings are made at various frequencies (frames/sec). The best image quality for film is produced at x-ray frame rates of more than 30 frames/sec. Digital imaging decreases radiation exposure in the laboratory by allowing for image acquisition at lower frame rates, 15 frames/sec (half the radiation dose), while still maintaining excellent image quality. Cost savings have been achieved by the elimination of the purchasing, processing, and storage of film. Film imaging was an analog technique, and a single recording was made. Copies rarely were made because of cost and degradation of image quality. If films were loaned, lost, or misplaced, the study could not be reviewed. With the current digital technology, images are archived on a central server and can be viewed on remote workstations.17 An infinite number of copies can be made at low cost and with no loss of image quality.
Data compression for storage is required to be 2:1 (“lossless”) compression. Although “lossless” compression on a CD-ROM is the standard for the transfer of images between institutions, similar standards do not exist for long-term archival (no media standard) and data transfer options within a single institution (no compression standard).18 Large amounts of memory and bandwidth are required for storage and transfer of the images in “lossless” compression. At remote viewing stations, such as those in the OR, it is essential that the viewer be aware of the type of image compression used to transfer data. If significant image compression is used, image quality will decrease. It is essential that improper decisions not be made because of inferior image quality.
The evolution of angiographic recording has extended beyond recording formats. Charged-couple device cameras and flat-panel detectors (FPDs) are ubiquitous in modern laboratories.19 x-rays are generated from below the patient by the x-ray tube, pass through the patient, and are captured by the FPD. In this system, the x-rays are both acquired and digitally processed by the flat panel.15 The flat panel is above the patient (analogous to the image intensifier), and the x-rays are generated below the patient, as before. This current generation of imaging in the catheterization laboratory delivers an improved image quality because the dynamic range of the image (number of shades of gray) is improved. It has the potential to decrease radiation exposure by providing immediate feedback to the x-ray generator. In laboratories designed for peripheral vascular work, including many of the hybrid ones, the sizes of the FPD above the patient can be quite large and may limit access to the patient’s face.

Facility Caseload
All catheterization facilities must maintain appropriate patient volume to assure competence. ACC/AHA guidelines recommend that a minimum of 300 adult diagnostic cases and 75 pediatric cases per facility per year be performed to provide adequate care.12 A caseload of at least 200 PCIs per year, with an ideal volume of 400 cases annually, is recommended.20–22
Facilities performing PCIs without in-house surgical backup are becoming more prevalent.23,24 Despite this, national guidelines still recommend that both elective and emergent PCIs be performed in centers with surgical capabilities.22,25 Although emergent coronary artery bypass graft surgery (CABG) is infrequent in the stent era, when emergent CABG is required, the delays inherent in the transfer of patients to another hospital would compromise the outcomes of these compromised patients.22 Primary PCI for acute myocardial infarction (AMI) is the accepted standard treatment for the following patients: (1) those in cardiogenic shock, (2) those who have contraindications to thrombolytic therapy, and (3) those who do not respond to thrombolytic therapy. It is preferred therapy for those who present late in the course of an infarction, and is probably the optimal treatment for all myocardial infarctions (MIs), provided that it can be performed in a timely manner.26–28 When a patient presents with an AMI to a facility without cardiac surgical capabilities, management is controversial. Although national guidelines do not endorse the performance of PCI in this setting, they state that the operator should be qualified. In practice, this means that he or she performs elective and emergent PCIs at another facility and the total laboratory case volume should be at least 36 AMI procedures per year.26
Although minimal volumes are recommended, no regulatory control currently exists. In a study of volume-outcome relationships published for New York State, a clear inverse relation between laboratory case volume and procedural mortality and CABG rates was identified.29 In a nationwide study of Medicare patients, low-volume centers had a 4.2% 30-day mortality rate, whereas the high-volume centers’ mortality rate was 2.7%.30 The ACC clinical competence statement for PCI summarizes these studies.21 Centers of excellence, based on physician and facility volume, as well as overall services provided, may well be the model for cardiovascular care in the future.31

Physician Credentialing
The more experience an operator has with a particular procedure, the more likely this procedure will have a good outcome. The American College of Cardiology (ACC) Task Force has established guidelines for the volume of individual operators in addition to the facility volumes mentioned earlier.12 The current recommendations for competence in diagnostic cardiac catheterization require a fellow to perform a minimum of 300 angiographic procedures, with at least 200 catheterizations as the primary operator, during his or her training.
Prior guidelines have recommended a cardiologist perform a minimum of 150 diagnostic cases per year to maintain clinical expertise after fellowship training.12,32 Of note, when physicians have performed more than 1000 cases independently, the individual case volume may decline for a limited period with the operator still maintaining a high level of expertise. The ideal case volume should not exceed 500 to 600 procedures per year for physicians committed to cardiac catheterization. For the physician performing pediatric procedures, annual volumes should equal or exceed 50 cases.12 Ultimately, each hospital’s quality assurance/peer review program is responsible for setting its own standards and maintaining them through performance improvement reviews.33,34
In 1999, the American Board of Internal Medicine established board certification for interventional cardiology. To be eligible, a physician has to complete 3 years of a cardiology fellowship, complete a (minimum) of a 1-year fellowship in interventional cardiology, and obtain board certification in general cardiology. In addition to the diagnostic catheterization experience discussed earlier, a trainee must perform at least 250 coronary interventional procedures. Board certification requires renewal every 10 years, and initially was offered to practicing interventionalists with or without formal training in intervention. In 2004, the “grandfather” pathway ended, and a formal interventional fellowship is required for board certification in interventional cardiology. After board certification, the physician should perform at least 75 PCIs as a primary operator annually. Operators who perform fewer than 75 cases per year should operate only in facilities that perform more than 600 PCIs annually. In addition to caseload, the physician should attend at least 30 hours every 2 years in interventional cardiology continuing education.22 With the establishment of board certification for PCI and the correlation of outcomes to PCI volumes, it is likely that high-volume, board-certified interventional cardiologists will displace low-volume PCI operators, and improved outcomes will result.23,24
The performance of peripheral interventions in the cardiac catheterization laboratory is increasing. Vascular surgeons, interventional radiologists, and interventional cardiologists all compete in this area. The claim of each subspecialty to this group of patients has merits and limitations. Renal artery interventions are the most common peripheral intervention performed by interventional cardiologists, but distal peripheral vascular interventions are performed in many laboratories. Stenting of the carotid arteries looks favorable when compared with carotid endarterectomy.35 Guidelines are being developed with input from all subspecialties. These guidelines and oversight by individual hospitals will be necessary to ensure that the promise of clinical trials is translated into quality patient care.
With this in mind, internal peer review is essential for the catheterization laboratory. Although separate from credentialing, the peer review process is designed to identify quality issues for the purpose of improving patient care. This involves education, clinical practice standardization, feedback and benchmarking, professional interactions, incentives, decision-support systems, and administrative interventions.12,34 An internal peer review process allows the physicians to establish and maintain in-hospital practice standards essential for quality patient care.
Patient selection for catheterization

Indications for Cardiac Catheterization in the Adult Patient
Table 3-1 lists generally agreed-on indications for cardiac catheterization. With respect to CAD, approximately 15% of the adult population studied will have normal coronary arteries.12 This reflects limitations of the specificity of the clinical criteria and noninvasive tests used to select patients for catheterization. However, as the sensitivity and specificity of the noninvasive studies have improved, this percentage of normal studies has progressively declined.36 Despite this, coronary angiography is, for the moment, still considered the gold standard for defining CAD. With advances in MRI and multislice CT scanning, the next decade may well see a further evolution of the catheterization laboratory to an interventional suite with fewer diagnostic responsibilities.1
TABLE 3-1 Indications for Diagnostic Catheterization in the Adult Patient
| Coronary Artery Disease |
| Symptoms |
| Unstable angina |
| Postinfarction angina |
| Angina refractory to medications |
| Typical chest pain with negative diagnostic testing |
| History of sudden death |
| Diagnostic Testing |
| Strongly positive exercise tolerance test |
| Early positive, ischemia in ≥ 5 leads, hypotension, ischemia present for ≥ 6 minutes of recovery |
| Positive exercise testing after myocardial infarction |
| Strongly positive nuclear myocardial perfusion test |
| Increased lung uptake or ventricular dilation after stress |
| Large single or multiple areas of ischemic myocardium |
| Strongly positive stress echocardiographic study |
| Decrease in overall ejection fraction or ventricular dilation with stress |
| Large single area or multiple or large areas of new wall motion abnormalities |
| Valvular Disease |
| Symptoms |
| Aortic stenosis with syncope, chest pain, or congestive heart failure |
| Aortic insufficiency with progressive heart failure |
| Mitral insufficiency or stenosis with progressive congestive heart failure symptoms |
| Acute orthopnea/pulmonary edema after infarction with suspected acute mitral insufficiency |
| Diagnostic Testing |
| Progressive resting left ventricular dysfunction with regurgitant lesion |
| Decreasing left ventricular function and/or chamber dilation with exercise |
| Adult Congenital Heart Disease |
| Atrial Septal Defect |
| Age > 50 with evidence of coronary artery disease |
| Septum primum or sinus venosus defects |
| Ventricular Septal Defect |
| Catheterization for definition of coronary anatomy |
| Coarctation of the aorta |
| Detection of collaterals |
| Coronary arteriography if increased age and/or risk factors are present |
| Other |
| Acute myocardial infarction therapy—consider primary percutaneous coronary intervention |
| Mechanical complication after infarction |
| Malignant cardiac arrhythmias |
| Cardiac transplantation |
| Pretransplant donor evaluation |
| Post-transplant annual coronary artery graft rejection evaluation |
| Unexplained congestive heart failure |
| Research studies with institutional review board review and patient consent |

Patient Evaluation before Cardiac Catheterization
The precatheterization history is important to delineate the specifics that may place the patient at increased risk. Proper identification of prior contrast exposure with or without contrast allergic reaction must be recorded. If a true contrast reaction (rash, breathing difficulties, angioedema, and so forth) occurred with prior contrast exposure, premedication with glucocorticoids is required. Diabetes, preexisting renal insufficiency, and heart failure are widely accepted risk factors for contrast-induced nephropathy (CIN). A Cr level greater than 1.5 mg/dL, particularly in a patient with diabetes, or a GFR less than 60 mL/min should prompt special precautions.37 The study can be canceled or delayed. If the indication for catheterization is strong, prehydration, avoidance of certain medication (e.g., nonsteroidal anti-inflammatory drugs), and limiting the volume of contrast (i.e., assessing ventricular function by echocardiography and omitting ventriculography) will reduce the risk for worsening renal function.12
Patient medications must be addressed. On the morning of the catheterization, antianginal and antihypertensive medications are routinely continued, whereas diuretic therapy is withheld. Diabetic patients are scheduled early, if possible. As breakfast is withheld, no short-acting insulin is given. Patients on oral anticoagulation should stop warfarin sodium (Coumadin) therapy 48 to 72 hours before catheterization (international normalized ratio ≤ 1.8) if femoral arterial access is used. Radial arterial access is considered an option without discontinuation of Coumadin.38 This, however, may present its own challenges and laboratory protocols should be established to address this. In patients who are anticoagulated for mechanical prosthetic valves, the patient may be managed best with intravenous heparin before and after the procedure, when the warfarin effect is not therapeutic. Low-molecular-weight heparins (LMWHs) are used in this setting, but this is controversial. LMWHs vary in their duration of action, and their effect cannot be monitored by routine tests. This effect needs to be considered, particularly with regard to hemostasis at the vascular access site. Intravenous heparin is routinely discontinued 2 to 4 hours before catheterization, except in the patient with unstable angina (UA). Aspirin therapy for patients with angina or in patients with prior CABG is often continued, particularly in patients with UA.39

Contraindications, High-Risk Patients, and Postcatheterization Care
Despite advances in facilities, equipment, technique, and personnel, the precatheterization evaluation must identify those patients at increased risk for complications. In a modern facility with an experienced staff, the only absolute contraindication would be the refusal by a competent patient or an incompetent patient unable to provide informed consent. Relative contraindications are listed in Box 3-1; the primary operator is responsible for this assessment.12
BOX 3-1 Relative Contraindications to Diagnostic Cardiac Catheterization
Modified from Baim DS, Grossman W: Cardiac Catheterization, Angiography, and Intervention, 6th ed. Philadelphia: Lippincott Williams & Wilkins, 2000.
Box 3-2 lists criteria for identifying the high-risk patient before catheterization. Procedural alterations based on this assessment may include avoidance of crossing an aortic valve or performing ventriculography.40 Regardless of the risk, determination as to whether a patient is a candidate for catheterization must be based on the risk versus benefit for each individual.
BOX 3-2 Hidentification of the High-Risk Patient for Catheterization
Modified from Baim DS, Grossman W: Cardiac Catheterization, Angiography, and Intervention, 6th ed. Philadelphia: Lippincott Williams & Wilkins, 2000; from Mahrer PR, Young C, Magnusson PT: Efficacy and safety of outpatient cardiac catheterization. Cathet Cardiovasc Diagn 13:304, 1987.
With the increased emphasis on outpatient procedures in medicine today, outpatient diagnostic catheterization is the standard of care for stable patients. Unstable and postinfarction patients are already hospitalized, and catheterization usually is performed before discharge. Planned PCI usually requires admission. Even when outpatient catheterization is planned, assessment of the patient after catheterization is required. Some patients, particularly those with left main CAD, critical aortic stenosis, uncontrolled hypertension, significant LV dysfunction with congestive heart failure, or significant postprocedural complications such as a large groin hematoma will require hospital admission.12
In addition to the high-risk cardiac patient, patients with renal insufficiency may require overnight hydration before and after catheterization. Patients on chronic anticoagulation with warfarin (Coumadin) require measurement of the coagulation status and may require heparinization before and/or after the procedure. Day-of-procedure ambulation and discharge are planned for patients undergoing outpatient catheterization.37 Radial catheterization is increasing in popularity and is associated with a reduction of vascular complications.38,41 For a variety of reasons, the sheaths used for radial access are not suitable for long-term monitoring purposes and should be removed at the conclusion of the procedure. For patients undergoing catheterization via the percutaneous femoral approach, the use of smaller catheters (4 French) for the arterial puncture may hasten ambulation.42 Alternatively, a variety of vascular closure devices are approved for use.43 Vascular closure devices differ in the material that is used (and left in the patient). Some devices (i.e., Angio-Seal, St. Jude Medical) use an intraluminal anchor made of bioabsorbable material. However, it is recommended that the treated vessel not be used for repeat arterial access for up to 3 months, to permit absorption of the anchor and limit the risk for embolization. Protocols for early ambulation may permit the patient to be out of bed 2 to 4 hours after hemostasis, or even earlier if a closure device is used.42
Cardiac catheterization procedure

Patient Preparation
Patients with previous allergic reactions to iodinated contrast agents require adequate prophylaxis.44 Greenberger et al.45 studied 857 patients with a prior history of an allergic reaction to contrast media. In this study, 50 mg of prednisone was administered 13, 7, and 1 hour before the procedure. Diphenhydramine (50 mg intramuscularly) also was administered 1 hour before the procedure. Although no severe anaphylactic reactions occurred, the overall incidence of urticarial reactions in known high-risk patients was 10%. The use of nonionic contrast agents may further decrease reactions in patients with known contrast allergies.44 The administration of H2 blockers (300 mg cimetidine) is less well-studied.44 For patients undergoing emergent cardiac catheterization with known contrast allergies, 200 mg of hydrocortisone is administered intravenously immediately and repeated every 4 hours until the procedure is completed. Diphenhydramine (50 mg intravenously) is recommended 1 hour before the procedure.44
CIN is defined as an increase in serum Cr concentration of more than 0.5 mg/dL or 25% above baseline level within 48 hours.37 Although infrequent, occurring in less than 5% of PCIs, when it does occur, its impact on patient morbidity and mortality is significant.46 Total contrast doses less than 4 mL/kg are recommended in patients with normal renal function, and lower doses are recommended for those with preexisting renal dysfunction, particularly in diabetic patients (Cr > 1.5).37 A study in more than 8000 PCI patients identified 8 risk factors for CIN: hypotension, intra-aortic balloon pump, congestive heart failure, chronic kidney disease, diabetes, age older than 75, anemia, and contrast volume.47 It is, therefore, essential that the patient at high risk be identified and properly treated. In addition, renal function should be monitored for at least 48 hours in patients at high risk for CIN, particularly if surgery or other interventions are planned.
Several methods have been used to decrease renal toxicity from contrast agents. The two most important measures are minimizing contrast dose and adequate hydration with 0.9% saline at a rate of 1 mL/kg/hr for 12 hours before and after the procedure, if tolerated.37 Low osmolar contrast agents are recommended.48 Iso-osmolar contrast agents, treatment with N-acetylcysteine (Mucomyst) and sodium bicarbonate infusions, have yielded mixed results.37,49,50 Fenoldopam, a dopamine agonist, has been studied and has shown no benefit.51 Ultrafiltration dialysis has been beneficial in small studies.37

Patient Monitoring/Sedation
Cardiac catheterization laboratories routinely monitor arterial oxygen saturation by pulse oximetry (Spo2) in all patients. Utilizing pulse oximetry, Dodson et al.52 demonstrated that 38% of 26 patients undergoing catheterization had episodes of hypoxemia (Spo2 < 90%), with a mean duration of 53 seconds. Variable amounts of premedication were administered to the patients.
Sparse data exist regarding the effect of sedation on hemodynamic variables and respiratory parameters in the cardiac catheterization laboratory. One study examined the cardiorespiratory effects of diazepam sedation and flumazenil reversal of sedation in patients in the cardiac catheterization laboratory.53 A sleep-inducing dose of diazepam was administered intravenously in the catheterization laboratory; this produced only slight decreases in mean arterial pressure, PCWP, and LV end-diastolic pressure (LVEDP), with no significant changes in intermittently sampled arterial blood gases. Flumazenil awakened the patient without significant alterations in either hemodynamic or respiratory variables.
More complex interventions have resulted in longer procedures. Although hospitals require conscious sedation policies, individual variation in the type and degree of sedation is common. Although general anesthesia rarely is required for coronary procedures, it is necessary more frequently for percutaneous valve procedures, ASD closure, and aortic endografts. Advancements in intracardiac echocardiography have decreased the need for intubation and transesophageal echocardiography (TEE) in certain patients and procedures.54 Pediatric procedures require general anesthesia more frequently than those in adults. As the frequency of noncoronary procedures increases, the presence of an anesthesiologist in the catheterization laboratory will be required more frequently.

Left-Sided Heart Catheterization
Catheterization Site and Anticoagulation
Left-sided heart catheterization traditionally has been performed by either the brachial or femoral artery approach. In the 1950s, the brachial approach was first introduced utilizing a cutdown with brachial arteriotomy. The brachial arteriotomy is often time-consuming, can seldom be performed more than three times in the same patient, and has greater complication rates. This led operators to adopt the femoral approach, which became nearly universal. The percutaneous radial artery approach has been used for more than 15 years. Only a small fraction of procedures are performed via the radial approach, but that fraction is increasing slowly.41,55 The percutaneous radial approach is also more time-consuming than the femoral approach but is associated with fewer complications.55 This approach may be preferred in patients with significant peripheral vascular disease, recent (<6 months) femoral/abdominal aortic surgeries, significant hypertension, taking oral anticoagulants with international normalized ratio greater than 1.8, or who are morbidly obese. With increasing utilization of the radial artery as a conduit for CABG, care must be taken if this vessel has been used for radial access during catheterization.56
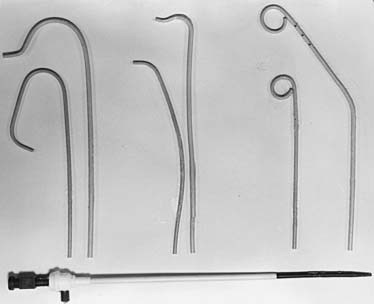
The percutaneous femoral artery approach is performed using catheters that allow for operator ease and speed of performance. The landmarks for the percutaneous femoral approach are illustrated in Figure 3-2. The percutaneous approach uses the Seldinger technique or modifications thereof with a Cook needle, which does not have an internal obturator. Once the wire is successfully inserted into the vessel, standard sheaths (4 to 8 French) are placed in the femoral artery. Through these sheaths, separate coronary artery catheters are inserted to perform left and then right coronary cineangiography, and left ventriculography is performed using a pigtail catheter. These standard catheters and a sheath are illustrated in Figure 3-3.
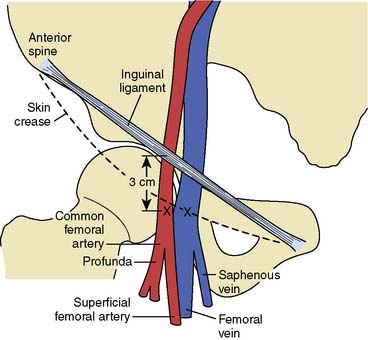
Figure 3-2 Relevant anatomy for percutaneous catheterization of femoral artery and vein.
(From Baim DS, Grossman W: Percutaneous approach. In Grossman W [ed]: Cardiac Catheterization and Angiography, 3rd ed. Philadelphia: Lea & Febiger, 1986, p 60.)
At the completion of the catheterization from the femoral approach, a closure device may be inserted in the catheterization laboratory. If so, femoral arteriography typically is performed via the sheath to assess the adequacy for the use of the device. If hemostasis will be obtained with manual compression, the patient is returned to the preprocedural/postprocedural area for sheath removal. If a right-heart catheterization is performed, arterial and venous sheaths should be removed separately to avoid the formation of an atrioventricular (AV) fistula.57 Pressure is applied manually or by a compression device. The duration of bed rest depends on the size of the sheath.58 Closure devices provide for more rapid hemostasis after the procedure, allowing for earlier ambulation and discharge. However, complication rates have not decreased with these devices.12 Closure devices include collagen plugs placed within the artery that require avoidance of the site for repeat puncture for 3 months, external arterial/subcutaneous plugs that do not hinder repeat access, topical patches that elute coagulants to the puncture site, and suture devices that perform percutaneous arteriotomy closure.43 For radial closure, wristbands are utilized to hold compression until hemostasis is achieved.38
Once hemostasis has been achieved, pulse and bleeding checks should be performed on a regular basis. Sandbag placement is seldom used. In most instances, for outpatient diagnostic studies, patients are ambulatory and ready to be discharged 2 to 4 hours after the procedure.42,58
Systemic heparinization with 5000 units was the standard of care in the early days of left-sided heart catheterization.59 Heparin was used because of the theoretic risk for thrombus formation on catheters. Eventually, heparin doses were reduced to facilitate sheath removal. When various doses of heparin were compared, a doubling of the PTT was achieved with a dose of 3000 units, with no embolic events reported.59 In contemporary practice, routine anticoagulation for diagnostic procedures from the femoral approach often is omitted because of the limited arterial access times, unproven need for anticoagulation, and risks for reversing anticoagulation and/or potential delay in sheath removal. If a sheath is to be left in place for more than 30 to 60 minutes (i.e., to confer about management or to transfer a patient), then anticoagulation is recommended. Heparinization is used routinely during brachial or radial catheterization to prevent thrombosis of the smaller arm arteries that may be obstructed by the sheath. Dosing is typically with a bolus of about 50 to 60 units/kg. Hemostasis is not compromised because the brachial arteriotomy is repaired with a suture, and radial compression devices can be left in place until hemostasis is achieved.
Contrast Agents
Adverse reactions have been the major disadvantage of the ionic contrast agents since their introduction for urinary tract visualization in 1923.44 The two major classifications of contrast agents used today for cardiovascular imaging are based on their ability to either dissociate into ionic particles in solution (ionic media) or not dissociate (nonionic). The ionic agents were the first group developed, with sodium diatrizoate and iothalamate anions as the iodine carriers. Commercially available agents using meglumine and sodium salts of diatrizoic acid include Renografin, Hypaque, and Angiovist. In 1975, Shehadi60 reported on a prospective survey of 30 university hospitals in the United States, Canada, Europe, and Australia, involving 112,003 patients, using ionic contrast for cardiovascular diagnosis. The overall rate of adverse reactions was 5.65%, with 0.02% having severe reactions and eight patients dying.
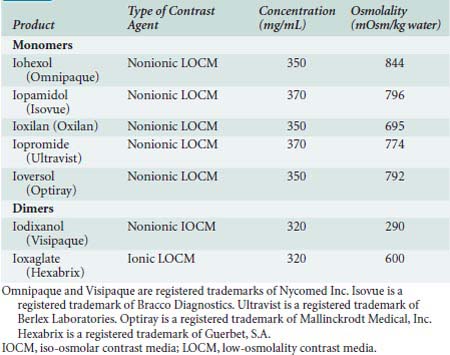
The next generation of contrast agents began to impact clinical practice in the 1980s. These agents, listed in Table 3-2, are predominantly monomeric, nonionic agents with the exception of the two dimers: ioxaglate (ionic) and iodixanol (nonionic). These agents, particularly the nonionic dimer iodixanol, have lower osmolarity and potentially lower systemic toxicity.48
Several areas must be discussed when comparing ionic and nonionic contrast agents. First, the ECG effects (transient heart block, QT and QRS prolongation), depression of LV contractility, and systemic hypotension from peripheral vasodilation are more pronounced with the ionic agents, but only marginally statistically different from that of the nonionic compounds.61 The hemodynamic effects of the nonionic dimer, iodixanol, were compared with the nonionic monomer, iohexol, in 48 patients. Although both agents caused an increase in LVEDP, this was significantly less in the iodixanol group.62 In addition, the iodine content may vary among agents, resulting in variations in opacification. Also, for patients who have had previous anaphylactoid reactions to iodinated contrast, nonionic contrast decreases the incidence of an anaphylactoid reaction with repeat contrast exposure.44,48 Finally, the nonionic agents and dimers are more expensive than the ionic agents. When first introduced, this difference was large and slowed the adoption of the newer agents. Current price differences are less dramatic, and nonionic agents are used in most laboratories.48
Both ionic and nonionic agents have anticoagulant and antiplatelet effects, these being pronounced with ionic agents. A comparison of the nonionic agents iohexol (monomer) and iodixanol with the ionic dimer, ioxaglate, demonstrated a clear distinction, with the in vivo antiplatelet effect of the ionic agent, ioxaglate, 65% greater than the nonionic agent.63 Regardless of the agent used, these differences are unlikely to be important for diagnostic procedures. Although minute thrombi may form when blood and nonionic contrast remain in a syringe, clinical sequelae have not been noted.64
Patients with impaired renal function (Cr > 1.5 mg/dL; GFR < 60 mL/min), particularly if diabetic, most likely would be at risk for renal impairment after contrast administration.37 The effects of contrast agents on the kidneys are more pronounced when larger volumes are delivered near the renal arteries. Thus, arteriography of the renal arteries or abdominal aorta would be the procedures in which the choice of contrast is most important. In fact, abdominal arteriography can be done with digital subtraction techniques and the intra-arterial injection of gaseous carbon dioxide, thus avoiding the use of any iodinated contrast.
Two large, multicenter trials have compared ionic and nonionic agents in patients undergoing cardiovascular diagnostic imaging.65,66 One performed in 109,546 patients in Australia and another in 337,647 patients in Japan demonstrated severe adverse reactions in the ionic group of 0.9% and 0.25%, respectively, whereas severe adverse reactions occurred in the nonionic group at rates of 0.02% and 0.04%, respectively. For the patient undergoing intervention, a recent trial compared the iso-osmolar nonionic dimer, iodixanol, with the ionic dimer, ioxaglate, in 856 PCI patients at high risk and noted a 45% reduction in major adverse cardiac events (MACEs) in the iodixanol group.67 The iso-osmolar contrast agent, iodixanol (Visipaque), has been compared with low-osmolar contrast agents in attempts to limit nephrotoxicity, with mixed results.
Minimizing the use of contrast is the surest way to limit nephrotoxicity. For patients at greatest risk, this might require that procedures be staged; for instance, performing a diagnostic study on one day and an interventional procedure at a later date. An additional concern is that iodinated contrast is administered frequently for other purposes, such as CT. If staging of procedures or repeat contrast administration is required, delaying these additional studies 72 hours and/or until renal dysfunctional has recovered is recommended.37

Right-Heart Catheterization
Indications
The Cournand catheter initially was used to measure right-sided heart pressures but required fluoroscopic guidance for placement. The Cournand catheter permitted the measurement of CO by the Fick method. Clinical applications of right-sided heart hemodynamic monitoring changed greatly in 1970 with the flow-directed, balloon-tipped, pulmonary artery catheter (PAC) developed by Swan and Ganz. This balloon flotation catheter allowed the clinician to measure pulmonary artery (PA) and wedge pressures without fluoroscopic guidance. It also incorporated a thermistor, making the repeated measurement of CO feasible. With this development, the PAC left the cardiac catheterization laboratory and entered both the OR and intensive care unit.68
In the cardiac catheterization laboratory, right-sided heart catheterization is performed for diagnostic purposes. The routine use of right-sided heart catheterization during standard left-sided heart catheterization was studied by Hill et al.69 Two hundred patients referred for only left-sided heart catheterization for suspected CAD also underwent right-sided heart catheterization. This resulted in an additional 6 minutes of procedure time and 90 seconds of fluoroscopy. Abnormalities were detected in 35% of the patients. However, management was altered in only 1.5% of the patients. With this in mind, routine right-sided heart catheterization cannot be recommended. Table 3-3 outlines acceptable indications for right-sided heart catheterization during left-sided heart catheterization.
TABLE 3-3 Indications for Diagnostic Right-Heart Catheterization during Left-Heart Catheterization
| Significant valvular pathology |
| Suspected intracardiac shunting |
| Acute infarct—differentiation of free wall versus septal rupture |
| Evaluation of right- and/or left-heart failure |
| Evaluation of pulmonary hypertension |
| Severe pulmonary disease |
| Evaluation of pericardial disease |
| Constrictive pericarditis |
| Restrictive cardiomyopathy |
| Pericardial effusion |
| Pretransplant assessment of pulmonary vascular resistance and response to vasodilators |
CO measurements during right-sided heart catheterization using the thermodilution technique allow for a further assessment of ventricular function.70 This obviously is helpful in the setting of an AMI to delineate high-risk groups and to measure the effect of cardiac medications.71,72 Measurement of CO can differentiate high-output failure states (hyperthyroidism, Paget disease, beriberi, anemia, AV malformations, or AV fistulas) from those secondary to a low CO. In patients with congenital heart disease, right-sided heart catheterization allows for measurement of oxygen saturation in various cardiac chambers and calculation of intracardiac shunting. In patients with ASDs, the right-sided heart catheter passes through the defect into the left atrium (LA), allowing for complete saturation and pressure measurements. The thermodilution technique cannot be used to measure CO in the setting of intracardiac shunting; in such cases, the Fick method must be used. With significant tricuspid regurgitation or very low COs, the Fick method provides a more accurate measurement of CO and is preferred. As the pharmacologic therapy for pulmonary hypertension has become more effective, right-heart catheterization is used to confirm the diagnosis of pulmonary arterial hypertension and differentiate it from pulmonary venous hypertension. A response to vasodilators predicts the response to some therapies, so vasodilators (including inhaled nitric oxide) are sometimes given during right-heart catheterization.73
Shunt Calculations
Pulmonic and systemic flows are calculated as modifications of the Fick equation for CO determination.74 It is important that measurements be made during steady state. The Qp/Qs ratio is calculated for patients with left-to-right shunting by the following equation:
where Qp is pulmonary flow, Qs is systemic flow, Pvo2 is pulmonary venous oxygen saturation, SAo2 is systemic arterial oxygen saturation, PAo2 is PA oxygen saturation, and Mvo2 is mixed venous oxygen saturation.


Calculation of bidirectional shunting involves determination of the effective blood flow. Effective blood flow (Qeff) represents the flow if no right-to-left or left-to-right shunting exists.74 With Qeff, right-to-left shunting is equal to Qs − Qeff, and left-to-right shunting is equal to Qp − Qeff, using the following formulas derived from the Fick equation for CO:
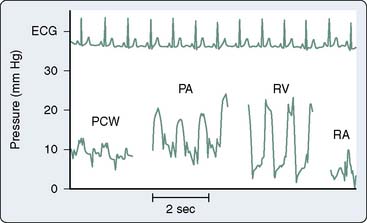
Right-sided heart pressure may be obtained either on entry or on pullback (Figure 3-4). Catheter placement using the femoral approach may be time-consuming, with expedited passage necessary to prevent catheter softening. Therefore, pressure measurements often are obtained during catheter pullback to assure temporal proximity. As with all invasive procedures, complications can occur with right-heart catheterization, requiring that risks and benefits be assessed before undertaking this and any procedure75 (see Chapter 14).
Endomyocardial Biopsy
Endomyocardial biopsy is the most (only) reliable method to detect rejection in the transplanted heart. However, its role in the management of other cardiovascular diseases in the adult and pediatric patient remains controversial. In 2007, the ACC/AHA/European Society of Cardiology published recommendations on endomyocardial biopsy.76 Either internal jugular (most common in the United States) or femoral (more common in Europe) veins are the preferred approaches with subclavian and even brachial approaches utilized. Complications are infrequent and are related to the access site in 2%, arrhythmia/conduction abnormalities in 1% to 2%, and perforation in 0.5%. Death, a rare event, is related to perforation. Histologic evaluation of the tissue is the purpose of the procedure and must be done by experienced pathologists to justify the risks.
Indications are controversial, but most groups agree that important information can be obtained in the setting of new-onset heart failure for both the less than 2-week group and the 2- to 3-month group unresponsive to therapy.76 Other potential indications include unexplained restrictive cardiomyopathy, anthracycline cardiomyopathy, suspected cardiac tumor, unexplained arrhythmias, and heart failure associated with hypertrophic cardiomyopathy, but these are less clear. A complete review of potential scenarios is found in the 2007 scientific statement.76

Diagnostic Catheterization Complications
Although adult diagnostic catheterization with selective coronary cineangiography had been performed since the late 1950s, complication rates were not followed until 1979 when the Society for Cardiac Angiography and Interventions established the first registry to prospectively monitor the performance of participating laboratories. In 1982, the first publication from this registry reported complication rates from a study population of more than 50,000 patients.77 This was updated in 1989 with a report on 222,553 patients who underwent selective coronary arteriography between 1984 and 1987.78 When compared with the earlier report, similar complication rates were noted. Complications are related to multiple factors, but severity of disease is important. Mortality rates are shown in Table 3-4. Complications are specific for both right- and left-heart catheterization (Table 3-5). The registry reported incidences of major complications as follows: death 0.1%, MI 0.06%, cerebrovascular accident 0.07%, arrhythmia 0.47%, contrast reaction 0.23%, and vascular complications 0.46%.78 Infectious complications are infrequent; this may reflect underreporting. Guidelines for infection control are based more on extrapolation from ORs than randomized control data from the catheterization laboratory.79 Although advances in technology continue, similar complication rates still are present today, most likely because of the higher-risk patient undergoing catheterization.12 The current registries for identifying complications are primarily focused on percutaneous interventions. In addition to institutional and regional databases, such as those of the Cleveland Clinic and Northern New England, the ACC maintains the National Cardiovascular Data Registry (NDCR).
| Patient Characteristics* | Mortality Rate (%) |
|---|---|
| Overall mortality from cardiac catheterization | 0.14 |
| Age-related mortality | |
| < 1 yr | 1.75 |
| > 60 yr | 0.25 |
| Coronary artery disease | |
| One-vessel disease | 0.03 |
| Three-vessel disease | 0.16 |
| Left main disease | 0.86 |
| Congestive heart failure | |
| NYHA functional class I or II | 0.02 |
| NYHA functional class III | 0.12 |
| NYHA functional class IV | 0.67 |
| Valvular heart disease | |
| All valvular disease patients | 0.28 |
| Mitral valve disease | 0.34 |
| Aortic valve disease | 0.19 |
* Other reported high-risk characteristics include unstable angina, acute myocardial infarction, renal insufficiency, ventricular arrhythmias, cyanotic congenital heart disease (including arterial desaturation and pulmonary hypertension). Detailed data from large-scale studies on these characteristics are unavailable.
From Pepine CJ, Allen HD, Bashore TM, et al: ACC/AHA guidelines for cardiac catheterization and cardiac catheterization laboratories. J Am Coll Cardiol 18:1149, 1991.
TABLE 3-5 Complications from Diagnostic Catheterization
| Left Heart |
| Cardiac |
| Death |
| Myocardial infarction |
| Ventricular fibrillation |
| Ventricular tachycardia |
| Cardiac perforation |
| Noncardiac |
| Stroke |
| Peripheral embolization |
| Air |
| Thrombus |
| Cholesterol |
| Vascular surgical repair |
| Pseudoaneurysm |
| AV fistula |
| Embolectomy |
| Repair of brachial arteriotomy |
| Evacuation of hematomas |
| Contrast related |
| Renal insufficiency |
| Anaphylaxis |
| Right Heart |
| Cardiac |
| Conduction abnormality |
| RBBB |
| Complete heart block (RBBB superimposed on LBBB) |
| Arrhythmias |
| Valvular damage |
| Perforation |
| Noncardiac |
| Pulmonary artery rupture |
| Pulmonary infarction |
| Balloon rupture |
| Paradoxic (systemic) air embolus |
AV, arteriovenous; LBBB, left bundle branch block; RBBB, right bundle branch block.
Vascular complications from the percutaneous femoral approach occur in less than 1% of diagnostic procedures, with the most common being pseudoaneurysms.43 This risk is greater for the obese patient in whom compression is more difficult. Therapy for pseudoaneurysms includes either ultrasound-directed thrombin injection or surgical repair. In patients with aortic regurgitation (AR), an increased incidence of femoral arteriovenous fistulas is seen due to the widened pulse pressure.57 Many small arteriovenous fistulas will close spontaneously. If large or if the fistula is associated with high output (rare) or edema of the affected leg, surgical correction is indicated. Thrombosis of the femoral artery occurs rarely, and underlying atherosclerotic disease usually is severe. Emergent restoration of flow is essential, with a surgical approach used at some hospitals and a percutaneous one at others.
Arrhythmic complications during left-sided heart catheterization are more frequent with ionic contrast than with nonionic contrast, and they occur during coronary injection. Surprisingly, the presence of the catheter in the LV rarely causes a sustained arrhythmia. Early contrast media containing potassium produced ventricular fibrillation during coronary arteriography. However, current contrast materials are potassium-free and contain added calcium, resulting in an incidence rate of significant ventricular arrhythmias of 0.47%.78
Anaphylactoid reactions occurred in approximately 5% to 8% of cases when nonionic contrast was used. The definition of reaction severity, as well as the differential diagnosis for severe reactions is listed in Table 3-6. If a severe anaphylactoid reaction to contrast media occurs with hypotension refractory to rapid fluid resuscitation, and/or significant bronchospasm, immediate therapy with intravenous epinephrine, 0.1 mL of 1:10,000 solution (10 μg) every minute, is recommended. Subcutaneous doses of 0.3 mL of 1:1000 solutions can be administered for moderate reactions, whereas diphenhydramine is effective for mild reactions.44
TABLE 3-6 Contrast-Induced Anaphylactoid Reactions
| Severity Classification | ||
|---|---|---|
| Minor | Moderate | Severe |
| Urticaria (limited) | Urticaria (diffuse) | Cardiovascular shock |
| Pruritus | Angioedema | Respiratory arrest |
| Erythema | Laryngeal edema | Cardiac arrest |
| Bronchospasm | ||
| Differential Diagnosis (Severe Reactions) | |
|---|---|
| Cardiac | Noncardiac |
| Vasovagal reaction | Hypovolemia |
| Cardiogenic shock | Dehydration |
| Right ventricular infarction | Blood loss—gastrointestinal, vascular, external |
| Cardiac tamponade | Drug related |
| Cardiac rupture | Narcotic, benzodiazepine, protamine |
| Bezold–Jarich reflex | Sepsis |
Adapted from Goss J, Chambers C, Heupler F, et al: Systemic anaphylactoid reactions to iodinated contrast media during cardiac catheterization procedures. Cathet Cardiovasc Diagn 34:99, 1995.
Cholesterol embolization can occur after catheter manipulation, and has been described after cardiac catheterization.80 Although the femoral approach can be used in patients with unrepaired abdominal aortic aneurysms, an increased incidence of cholesterol emboli syndrome may occur in this population.81 Cholesterol embolization produces small-vessel arterial occlusion by cholesterol crystals, resulting in a serious clinical presentation including livedo reticularis, acrocyanosis of the lower extremities, renal insufficiency, and accelerated hypertension. The clinical course is variable, does not respond to anticoagulation, and has the potential for an insidious development of progressive renal failure, accelerating hypertension, and a fatal outcome.
Valvular pathology
In 2006, the ACC/AHA published updated practice guidelines for the management of patients with valvular heart disease.82 These guidelines cover the invasive and noninvasive evaluation of valvular problems, as well as therapeutic approaches. Each type of valvular pathology has its own particular hemodynamic “fingerprint,” the character of which depends on the severity of the pathology, as well as its duration (see Chapters 12, 13, and 19).

Stenotic Lesions
Gorlin and Gorlin83 derived a formula from fluid physics to relate valve area with blood flow and blood velocity:

As described by Gorlin and Gorlin,83 the velocity of blood flow is related to the square root of the pressure drop across the valve:

Stated another way, for any given orifice size, the transvalvular pressure gradient is a function of the square of the transvalvular flow rate. For example, with mitral stenosis (MS), as the valve area progressively decreases, a modest increase in the rate of flow across the valve causes progressively larger increases in the pressure gradient across the valve (Figure 3-5).
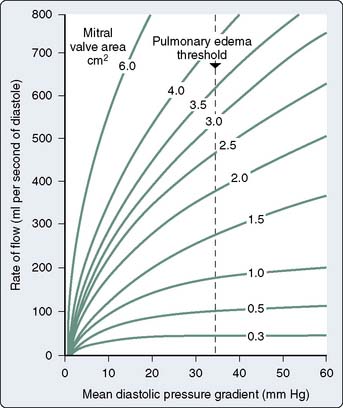
Figure 3-5 Rate of flow in diastole versus mean pressure gradient for several degrees of mitral stenosis.
(From Wallace AG: Pathophysiology of cardiovascular disease. In Smith LH Jr, Thier SO [eds]: Pathophysiology: The Biological Principles of Disease. The International Textbook of Medicine, Vol. 1. Philadelphia: WB Saunders Company, 1981, p 1192.)
The actual time of the cardiac cycle in which flow occurs must be known to complete the calculation. For semilunar valves (aortic and pulmonic), flow occurs during the SEP; for AV valves (mitral and tricuspid), flow occurs during the DFP. The SEP occurs during ventricular contraction when the aortic valve is open, and the DFP occurs while the mitral valve is open (Figure 3-6). The HR determines the duration of the SEP or DFP over an entire minute. Also present in the Gorlin formula is a coefficient that quantifies the conversion of potential energy (pressure energy) to kinetic energy (velocity). This term also contains an empirically derived factor, which accounts for the difference between calculated and measured valve areas at the time of surgery or postmortem.
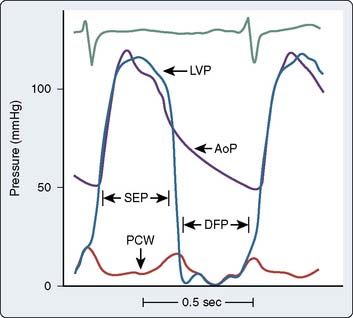
Figure 3-6 Simultaneous left ventricular (LVP), aortic (AoP), and left atrial pressure (PCW) waveforms.
The systolic ejection period (SEP) is defined as the period during which the aortic valve is open (from when LVP crosses over AoP at the beginning of systole to when AoP crosses over LVP near the end of systole) and forward blood flow is present in the aorta (see also Figure 3-2). Diastolic filling period (DFP) is defined as that period during which the mitral valve is open (from the crossover of LVP by PCW to the crossover of PCW by LVP) and blood is flowing through the mitral valve.
(Modified from Grossman W, Baim DS [eds]: Cardiac Catheterization, Angiography, and Intervention, 4th ed. Philadelphia: Lea & Febiger, 1991, p 153.)
The final Gorlin formula then becomes:

where CO is cardiac output (mL/min), DFP or SEP is diastolic filling period or systolic ejection period in seconds per beat, HR is heart rate in beats per minute, C is orifice constant (aortic, C = 1.0; mitral, C = 0.85; tricuspid, C = 0.7), and P1 − P2 is the mean pressure difference across the orifice using computer-assisted analysis or area blanketing. The 44.3 term is derived from the energy calculation.
Aortic Stenosis
The normal adult aortic valve area is 2.6 to 3.5 cm2, which corresponds to a normal aortic valve index of 2.0 cm2/m2. As the valve area decreases to a range of 1.5 to 2.0 cm2 (or a valve index of 1.0 cm2/m2, the major hemodynamic finding is an increase in the LV systolic pressure to maintain a normal aortic systolic pressure. An elevation in LVEDP also may be observed, which is merely a reflection of the decrease in compliance of the hypertrophied ventricle (see Chapter 19).
As the stenosis becomes moderate and the valve area decreases to 1.0 to 1.5 cm2, symptoms can occur. At this point, the LV exhibits a more rounded appearance at its peak systolic pressure, and a progressive increase in the LVEDP occurs. As the LV hypertrophies, its filling becomes more dependent on the contraction of the LA; this is reflected as an augmented A wave on the ventricular tracing. At this point, the increased LA pressure makes atrial fibrillation (AF) more likely, and the decreasing compliance of the LV makes it poorly tolerated. Widening of the systolic pressure gradient from the LV to the aorta, a decrease in the rate of rise of the upstroke of the aortic pressure tracing, and a delay in the time-to-peak aortic pressure also are seen (Figure 3-7).
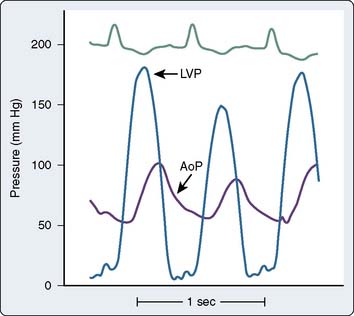
Figure 3-7 Left ventricular (LVP) and aortic (AoP) pressure waveforms in patient with aortic stenosis.
In the case of severe AS with a valve area of less than 1.0 cm2 and a valve area index of less than 0.5 cm2/m2, a decrease in systolic function of the LV can occur. Increases in PAP, PCWP, and right atrial pressure (RAP) also are observed. These latter changes often are accompanied by symptoms of congestive heart failure. The diagnosis and potential therapy for the patient with low-flow/low-gradient aortic stenosis is always challenging. Among patients with low-gradient AS, dobutamine infusions may help to identify those who will benefit from aortic valve replacement.84
Mitral Stenosis
In normal adults, the mitral valve orifice is 4 to 6 cm2. Mild MS is considered to be present when the mitral valve orifice is reduced to less than 2.0 cm2. In this condition, the typical hemodynamic finding is that of an elevation in either LAP or PCWP. The increase in LAP will tend to maintain normal flow across the valve. As the mitral valve orifice becomes reduced to less than 1.0 cm2, considered to be critical MS, a much larger LA-to-LV gradient is required to maintain reasonable flow across the valve (Figure 3-8). An increase in LAP during diastole leads to early opening of the mitral valve, as well as slightly delayed closure of the same valve (Figure 3-9). It is easy to understand why a slow HR in the presence of MS is preferred, because a maximal DFP is necessary to maintain reasonable flow and maintain CO across the mitral valve. Another hemodynamic hallmark in patients with MS is the reduced increase in LV pressure during early diastole. Normally, a fairly rapid increase is seen during the rapid filling phase of diastole, but the slope of this pressure increase is delayed in the presence of severe MS. In the presence of severe MS, increases in right-sided heart pressures are common. In severe long-standing MS, the PAP can reach or exceed systemic arterial pressure. Dilation of the LA commonly leads to chronic AF in these patients.
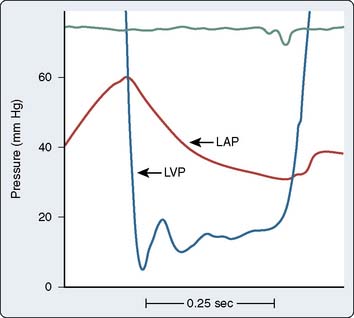
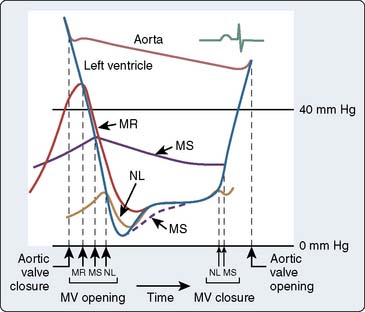
Figure 3-9 Idealized diagram summarizing mitral valve disorders, concentrating on the diastolic filling period.
(From Braunwald E: Valvular heart disease. In Braunwald E [ed]: Heart Disease: A Textbook of Cardiovascular Medicine, 3rd edition. Philadelphia, WB Saunders Company, 1988, p 1024.)
Doppler echocardiography has reduced the importance of catheterization in the evaluation of valvular disease (see Chapter 12). In stenoses of borderline severity, data from the catheterization laboratory are still important for clinical decision making. Performance of exercise or administration of inotropic agents increases the CO. In addition to confirmation of inotropic reserve, this increase in output increases the flow across the valves and increases the gradient exponentially. When both the gradient across the valve and the CO are low, augmentation of flow can help to distinguish severe stenosis with reversible ventricular failure from mild stenosis with irreversible ventricular failure.

Regurgitant Lesions
The severity of regurgitant lesions is quantified angiographically (see later). However, several hallmark changes occur in the presence of regurgitant lesions of either the semilunar or AV valves. As an example of semilunar valve regurgitation, the aortic valve is discussed, and the mitral valve is used as an example of AV valve regurgitation or incompetence (see Chapters 12, 13, and 19).
Aortic Regurgitation
Chronic AR can be caused by aortic root dilation, bicuspid valves, rheumatic fever, failing prostheses, endocarditis, and other conditions. With chronic AR, the LV dilates and becomes more compliant, reflected as a lower LVEDP, than in the acute phase. End-diastolic pressure may even be in the normal range until terminal failure is present. The systolic arterial pressure increases, and the diastolic pressure decreases. The former is due to the greater ventricular pressures generated, and the latter is due to continued runoff from the arterial system into the ventricle (Figure 3-10). AI imposes both a pressure load and a volume load on the left ventricle. Accordingly, the mass of the left ventricle can increase markedly if the condition is chronic.
Mitral Regurgitation
Mitral regurgitation either can be acute or chronic in nature. Acute mitral regurgitation usually is secondary to a condition such as acute ischemia leading to dysfunction of the papillary muscles of the mitral valve, or frank rupture of the structures after a significant MI. Rupture of the chordae tendineae can occur in the setting of endocarditis or spontaneously and cause acute mitral regurgitation (Figure 3-11). In this instance, it is not uncommon to see an enormously large V wave in the PCWP or LAP tracing, as ventricular blood freely flows back into a small, normal, and, thus, noncompliant LA. This also is accompanied by acute increases in the PAP and RAP, which can lead to significant clinical signs and symptoms.
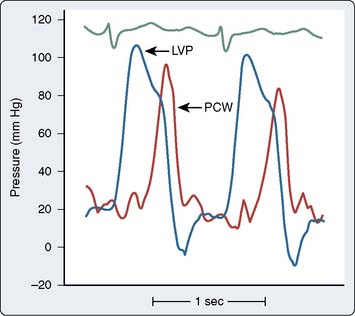
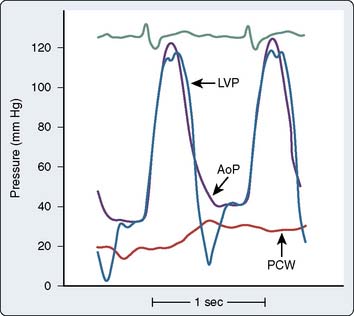
Figure 3-11 Acute mitral regurgitation caused by chordae tendineae rupture.
Simultaneous left ventricular (LVP) and pulmonary wedge (PCW) pressures demonstrate large V wave caused by severe regurgitation into a normal-sized left atrium. Note that the V wave is delayed temporally from that shown in Figure 13-2. This delay is due to the time required for the pressure wave to travel through the compliant pulmonary venous and capillary beds to the pulmonary artery catheter.
(Modified from Grossman W, Baim DS [eds]: Profiles in valvular heart disease. In Grossman W [ed]: Cardiac Catheterization, Angiography, and Intervention, 4th ed. Philadelphia: Lea & Febiger, 1991, p 564.)
Angiography

Ventriculography
Ejection Fraction Determination
Ventriculography routinely is performed in the single-plane 30-degree right anterior oblique (RAO) or biplane 60-degree left anterior oblique (LAO) and 30-degree RAO projections using 20 to 45 mL contrast with injection rates of 10 to 15 mL/sec (Box 3-3). Complete opacification of the ventricle without inducing ventricular extrasystoles is necessary for accurate assessment during ventriculography. These premature contractions not only alter the interpretation of mitral regurgitation, but result in a false increase in the global ejection fraction (EF).
The EF is a global assessment of ventricular function and is calculated as follows:

where EF is ejection fraction, EDV is end-diastolic volume, ESV is end-systolic volume, and SV is stroke volume.
The primary clinical method for calculation of ventricular volumes necessary for determining the EF utilizes the area length method described by Dodge et al. in 1960.85 Before calculation, visual identification is the outer margin of the ventricular silhouette in both the RAO and LAO projections for both end-systole and end-diastole is necessary. The ventricle is approximated as an ellipsoid to facilitate volume calculations (Figure 3-12). Using biplane ventriculography to define major (L) and minor (M, N) axes, the following standard geometric formula for the area of an ellipsoid is used86:
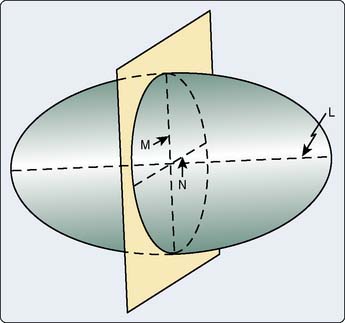


with Lmin being the shorter of Lrao and Llao.

Calculation of EF does not require correction for magnification, but measurement of dimensions or calculation of volumes does. Such correction can be made using a calibrated grid imaged after cineangiography, or a part of the catheter that is in the ventricle can be used for calibration. Catheters with precise calibration markings are available. Contemporary software permits calibration that is based on the height of the table and detector. Mathematical equations for ventricular volume overestimate true volume; therefore, regression equations are used to correct for this.86 This method or a variation has been incorporated into software on most modern systems.
There are problems with the use of EF as a measure of ventricular function. EFs calculated by various techniques (e.g., echocardiography, ventriculography, gated blood pool scanning) may not be identical because of the mathematical modeling involved. When single-plane ventriculography is used to calculate the EF, dysfunction of a nonvisualized segment (e.g., the lateral wall in an RAO ventriculogram) and global function may be overestimated. Most importantly, the EF is a load-dependent measure of ventricular function. Changes in preload, afterload, and contractility can significantly alter the EF determination. Thus, the EF can vary over time without any change in the myocardium, if the loading conditions or the inotropic conditions change. Identification of a load-independent measure of LV function has been the quest of many cardiologists over the years. The best approximation requires pressure-volume analysis at varying loading conditions to generate a series of curves. Although not used in routine clinical practice, pressure-volume curve analysis provides assessment of the systolic and diastolic properties of the ventricle and has been a valuable research tool (see Chapters 5 and 14). In addition to EF calculations, ventriculography allows for estimation of wall stress and LV mass.
Abnormalities in Regional Wall Motion
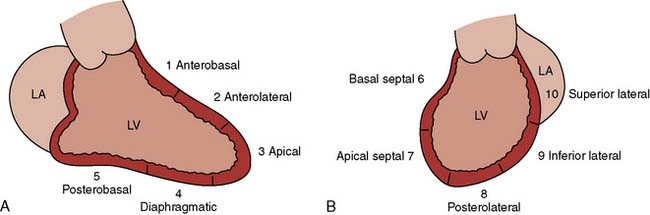
Segmental wall motion abnormalities are defined in both the RAO and LAO projections. A 0 to 5 grading scale may be used with hypokinesis (decreased motion), akinesis (no motion), and dyskinesis (paradoxic or aneurysmal motion). This scale is as follows: 0 = normal; 1 = mild hypokinesis; 2 = moderate hypokinesis; 3 = severe hypokinesis; 4 = akinesis; 5 = dyskinesis (aneurysmal). Each wall segment is identified as outlined in Figure 3-13 for both the LAO and RAO projections. These segments correspond roughly to vascular territories.


Aortography
The primary indication for aortography performed in the cardiac catheterization laboratory is to delineate the extent of AR. Secondary indications include defining supravalvular lesions and determining the origins of saphenous vein grafts (SVGs). Studies to differentiate proximal and distal dissections may be performed in the catheterization laboratory. However, TEE, MRI, and CT scanning with contrast are more commonly utilized today to make this diagnosis.87

Coronary Arteriography
Description of Coronary Anatomy
The left main coronary artery is variable in length (Figure 3-14). The left main bifurcates into the circumflex (CX) and LAD arteries. Occasionally, the CX and LAD arteries may arise from separate ostia or the left main may trifurcate, creating a middle branch, the ramus intermedius, which supplies the high lateral wall of the left ventricle. Both septal perforators and diagonal branch vessels arise from the LAD, which is described as proximal, mid, and distal vessel based on the location of these branch vessels. The proximal LAD artery is before the first septal and first diagonal branch; the mid LAD is between the first and second septal and diagonal branches; and the distal LAD is beyond the major septal and large diagonal vessels. The distal LAD provides the apical blood supply in two thirds of patients, with the distal RCA supplying the apex in the remaining third (see Chapters 6 and 18).
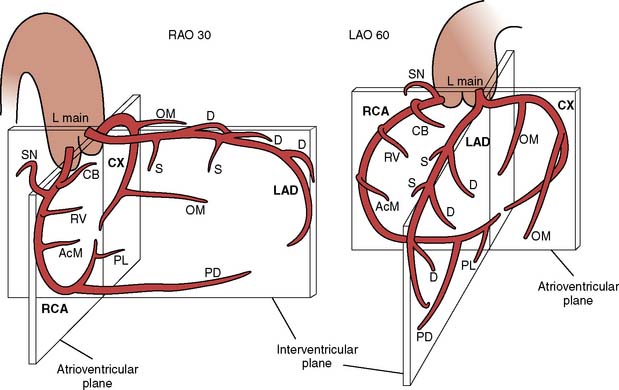
Figure 3-14 Representation of coronary anatomy relative to the interventricular and arterioventricular valve planes.
(From Baim DS, Grossman W: Coronary angiography. In Grossman W, Baim DS [eds]: Cardiac Catheterization, Angiography, and Intervention, 4th ed. Philadelphia: Lea & Febiger, 1991, p 200.)
Coronary Anomalies
The coronary anomalies most frequently encountered during coronary angiography are listed in Table 3-7. Anomalous coronary origins are seldom of clinical or surgical significance, but are potentially time-consuming during coronary angiography. Rarely, anomalous coronary arteries arising from the opposite cusp and traversing between the PA and aorta may produce vessel compression and ischemia. The Bland–Garland–White syndrome occurs when the LAD arises from the PA. Although most patients present early in life, young adults with this syndrome also may present with sudden cardiac death or ischemic cardiomyopathy.88 Coronary-cameral fistulas are not rare. Most are small and of no clinical significance.89
| Anomalous Coronary Origin |
| Left main coronary artery from right sinus of Valsalva separately or with right coronary artery |
| Circumflex artery as a separate origin off right cusp or with common origin with right coronary artery |
| Right coronary artery as a separate vessel from left cusp as separate ostia or as common ostia with circumflex as branch |
| Coronary Artery from Pulmonary Artery |
| Left coronary artery (Bland–Garland–White syndrome) |
| Right coronary artery |
| Fistula Formation from Normal Coronary Origin |
| Coronary branch vessels drain directly into right ventricle, pulmonary artery, coronary sinus, superior vena cava, pulmonary vein |
A variety of classification systems have been proposed for coronary anomalies. Some classification systems try distinguishing significant anomalies from minor ones, whereas other classification systems consider all anomalies anatomically, independent of clinical or hemodynamic repercussions.90 The reported incidence of coronary anomalies varies. Unfortunately, the life-threatening anomalies, particularly an anomalous origin of the left coronary artery from the right sinus, often are diagnosed at autopsy.90
Assessing the Degree of Stenosis
Qualitative estimates of percentage of diameter reduction are highly variable among different observers, and not reflective of coronary flow. Using a Doppler velocity probe, White et al.91 demonstrated that lesion severity was underestimated in the overwhelming majority of cases. When visual interpretation is required for clinical decisions, as opposed to research purposes, there may be a systematic bias toward overestimation of lesion severity. Quantitative coronary angiography was developed to overcome the pitfalls of qualitative visual interpretation of lumen reduction. Although cumbersome in its early iterations, most contemporary imaging systems include a usable quantification program.92 Even with quantification, the limitations of angiography remain.93 Accurate interpretation of coronary angiography and quantitation are possible only when high-quality images are obtained. Contrast injections must be forceful to fully opacify the artery, whereas pressure tracings are closely observed to prevent coronary artery dissection. When smaller catheters are used, injection may require smaller syringes or power injection for adequate coronary opacification. Branch vessels must clearly be separated utilizing cranial and caudal angulations. Periodic assessment of image quality is required to assure properly functioning imaging equipment.15
Intravascular ultrasound (IVUS) is a newer imaging modality that uses a miniature transducer in the lumen of the artery to generate a two-dimensional, cross-sectional image of the vessel. Although electronic (phased-array) transducers exist, the most commonly used intracoronary systems use mechanical rotation to provide 360-degree imaging. This rotation introduces the potential for artifacts that must be recognized as such. Refinements to these systems permit a transducer diameter of about 1 mm with an imaging frequency of 40 megahertz (MHz) for coronary arteries. However, the transducer is placed into the coronary (or peripheral) artery over a 0.014-inch guidewire. Thus, it entails more risk than angiography, and anticoagulation is mandatory. The transducer is placed distally in the vessel, and a mechanical system is used to withdraw the transducer at a controlled rate, typically 0.5 mm/sec, while a recording is made. Software permits reconstruction of serial cross-sectional images into longitudinal views, and volumetric analysis is possible. Both the lumen and the vessel wall can be imaged. The apposition of stent struts can be confirmed, and small dissections can be seen. Wall constituents, such as calcium and pooled lipids can be identified. Modifications permit analysis of “virtual histology.” IVUS has been a critical research tool. For instance, early stent implantation was associated with a high risk for subacute thrombosis that seemed refractory to anticoagulants. IVUS identified incomplete expansion of many stents using the existing deployment techniques and incomplete apposition of the struts to the vessel wall. Deployment techniques were modified to include higher pressures and larger balloon diameters, and subacute thrombosis receded. The volumetric measurements with IVUS are sufficiently reproducible to measure the effects of medication on the progression of atherosclerotic plaque. IVUS is used clinically in selected situations. In a study comparing IVUS findings with quantitative angiography, the plaque burden at maximal obstruction frequently were underestimated by quantitative angiography.93 Thus, IVUS can be used when angiography is equivocal. It also is useful in certain segments of the coronary tree, like the left main and bifurcations, where angiography may be limited. IVUS reports contain information on the diameter reductions and area reductions, which translate to angiographic values. However, an important value in the IVUS report is the minimal luminal area (MLA). Generally, an MLA less than 4.0 mm2 in a proximal coronary vessel correlates with an ischemic response during perfusion imaging. An MLA less than 6.0 mm2 in the left main correlates with ischemia. Finally, IVUS can be used to ensure optimal stent sizing and deployment. Similar equipment exists for peripheral vessels, although the role of IVUS in the periphery remains to be determined.
Anatomic information usually is used to guide management decisions. However, recent work suggests that revascularization may offer no advantage over medical therapy when it is guided by anatomic data.94 This has prompted a renewed interest in the physiologic assessment of coronary stenoses.95 One method uses a Doppler probe that is incorporated into a standard, 0.014-inch angioplasty wire (Volcano Therapeutics, San Diego, CA). The Doppler probe is placed distal to the coronary stenosis, and baseline velocity is recorded. An intracoronary (or intravenous) agent is administered to produce maximal coronary dilation, and the velocity is recorded again. A normal response is about a fourfold increase in velocity, but for clinical use, a value of twofold is used. The stability of velocity recordings varies, and accurate readings require careful placement of the probe into the middle of the vessel. These concerns have limited the use of the Doppler wire in clinical practice. An alternative is the Pressure Wire (St. Jude Medical, St. Paul, MN), in which a micromanometer is incorporated into a standard angioplasty wire. Again, the micromanometer is placed distal to the stenosis, and maximal coronary dilation is induced with the administration of an intracoronary or intravenous vasodilator. The ratio of the distal pressure to the aortic pressure (measured at the tip of the guiding catheter) is calculated at peak vasodilation and is termed the fractional flow reserve (FFR). Correlation with nuclear stress testing has been good for both techniques. For instance, a ratio of distal pressure to proximal pressure after adenosine vasodilation (FFR < 0.75) predicts an abnormal nuclear perfusion scan result. This can aid in the assessment of an angiographically “borderline” stenosis. Clinical outcomes have been good for those with a greater ratio (FFR).96,97 Moreover, when PCI is guided by pressure-wire measurements, as opposed to angiography, fewer stents are implanted and clinical outcomes are superior.98,99
Coronary Collaterals
Common angiographically defined coronary collaterals are described in Table 3-8. Although present at birth, these vessels become functional and enlarge only if an area of myocardium becomes hypoperfused by the primary coronary supply.100 Angiographic identification of collateral circulation requires both the knowledge of potential collateral source and prolonged imaging to allow for coronary collateral opacification.
| Left Anterior Descending Coronary Artery (LAD) |
| Right-to-Left |
| Conus to proximal LAD |
| Right ventricular branch to mid-LAD |
| Posterior descending septal branches at midvessel and apex |
| Left-to-Left |
| Septal to septal within LAD |
| Circumflex-OM to mid-distal LAD |
| Circumflex Artery (Cx) |
| Right-to-Left |
| Posterior descending artery to septal perforator |
| Posterior lateral branch to OM |
| Left-to-Left |
| Cx to Cx in AV groove (left atrial circumflex) |
| OM to OM |
| LAD to OM via septal perforators |
| Right Coronary (RCA) |
| Right-to-Right |
| Kugels—proximal RCA to AV nodal artery |
| RV branch to RV branch |
| RV branch to posterior descending |
| Conus to posterior lateral |
| Left-to-Right |
| Proximal mid and distal septal perforators from distal LAD OM to posterior lateral |
| OM to AV nodal |
| AV groove Cx to posterior lateral |
AV, atrioventricular; OM, obtuse marginal; RV, right ventricular.
The increased flow from the collateral vessels may be sufficient to prevent ongoing ischemia. A stenosis in a main coronary or branch vessel must reduce the luminal diameter by 80% to 90% to recruit collaterals for an ischemic area. Clinical studies suggest that collateral flow can double within 24 hours during an episode of acute ischemia.101 However, well-developed collaterals require time to develop and only these respond to nitroglycerin (NTG). The RCA is a better collateralized vessel than the left coronary. Areas that are supplied by good collaterals are less likely to be dyskinetic or akinetic.
Catheterization report
The promise of the electronic medical record is the timely availability of patients’ medical information at sites that need it. Most catheterization laboratories have integrated the catheterization reports into the record system of the hospital, facilitating its retrieval in preoperative anesthesia clinics. However, it must be remembered that the information obtained in the cardiac catheterization laboratory is representative of the patient’s pathophysiologic process at only one point in time. Therefore, these data are static and not dynamic. In addition, alterations in fluid and medication management before catheterization can influence the results obtained. The hemodynamic information usually is obtained after the patient has fasted for 8 hours. Particularly in patients with dilated, poorly contractile hearts, the diminished filling pressures seen in the fasted state may reduce the CO. In other circumstances, fluid status will be altered in the opposite direction. Patients with known renal insufficiency are hydrated overnight before contrast administration. In these instances, the right- and left-sided heart hemodynamics may not reflect the patient’s usual status. In addition, medications may be withheld before catheterization, particularly diuretics. Acute β-blocker withdrawal can produce a rebound tachycardia, altering hemodynamics and potentially inducing ischemia.102 These should be noted in interpreting the catheterization data.
Technical factors may influence coronary arteriography and ventriculography. The table in the catheterization laboratory may not hold very heavy patients. Patient size may limit X-ray tissue penetration and visualization and may prevent proper angulations. Stenosis at vessel bifurcations may not be identified in the hypertensive patient with tortuous vessels. Catheter-induced coronary spasm, most commonly seen proximally in the RCA, must be recognized, treated with NTG, and not reported as a fixed stenosis.103 Myocardial bridging results in a dynamic stenosis seen most commonly in the mid-LAD during systole. This is seldom of clinical significance and should not be confused with a fixed stenosis present throughout the cardiac cycle. With ventriculography, frequent ventricular ectopy or catheter placement in the mitral apparatus may result in nonpathologic (artificial) mitral regurgitation. This must be recognized to avoid inappropriate therapy.
Interventional cardiology: percutaneous coronary intervention
This section is designed to present the current practice of interventional cardiology (Box 3-4). Although begun by Andreas Gruentzig in September 1977 as PTCA, catheter-based interventions have expanded dramatically beyond the balloon to include a variety of PCIs.104 Worldwide, this field has expanded to include approximately 900,000 PCI procedures annually.22

General Topics for All Interventional Devices
Indications
Throughout the history of PCI, both technology and operator expertise have improved continually. With the proper credentialing, experience, and current technology, the interventionalist now has the capabilities to go places in the coronary tree “where no man (or woman) has gone before.” This is reflected in the expanded role for PCI. Although first restricted to patients with single-vessel disease and normal ventricular function who had a discrete, noncalcified lesion in the proximal vessel, PCI now is performed as preferred therapy in many groups of patients, including select patients with unprotected (no bypass grafts) left main stenosis.22,105
Box 3-5 provides a summary of current clinical indications for PCI. Primary PCI is the standard of care for patients with STEMI with or without cardiogenic shock.28,106 Although initially reserved only for those patients considered suitable candidates for CABG, PCI routinely is performed in patients who are not candidates for CABG in both emergent and nonemergent settings.22 In considering both the indications and the appropriateness of PCI, the physician must review the patient’s historic presentation, including functional class, treadmill results with or without perfusion data, and wall motion assessment. Demonstrating ischemia noninvasively, either before procedure or with an intraprocedural physiologic assessment, avoids inappropriate procedures prompted by the “ocular-dilatory reflex” (lesion seen = lesion dilated).97,107,108