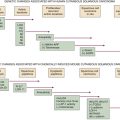
Figure 20-1 Genomic alterations in glioma co-segregate with only some of the identified molecular subtypes. (With permission from Verhaak RG, Hoadley KA, Purdom E, et al. Integrated genomic analysis identifies clinically relevant subtypes of glioblastoma characterized by abnormalities in PDGFRA, IDH1, EGFR, and NF1. Cancer Cell. 2010;17:98-110).
Recently, alternative approaches to those pursued using GWAS statistical approaches have started to emerge. 12 The rationale for these methods is that genome-wide regulatory models representing causal molecular interactions in the cell—for example, transcription factors regulating their transcriptional targets or protein kinases activating their substrates—may help us identify a relatively small number of candidate genes, upstream of genetic programs that are dysregulated, which may be tested for genetic and epigenetic alterations (Figure 20-3 ).
Variants of such a genetic genomics approach were pioneered in plants 13 and metabolic disease 14 and have been used successfully in cancer-related studies. For instance, identification of the novel HUWE1-MYCN-DLL3 cascade in brain tumors was possible by reverse engineering posttranslational modulators of MYCN activity as well as its downstream targets using reverse engineering algorithms. 15 Similarly, the role of RUNX1 as a tumor suppressor mutated in T-cell acute lymphoblastic leukemia (T-ALL) was elucidated based on its most significant overlap with the TLX1 and TLX3 oncogene regulatory programs. 16 In some cases, a network-based view of cancer biology may allow elucidation of the dependency of a phenotype on an entire collection of genetic events, which would be virtually impossible to dissect using statistical approaches. For example, it was recently shown that deletion of any combination of 13 genetic loci distributed across the entire genome leads to functional inactivation of PTEN in glioma patients, via a novel interaction mechanism involving competitive endogenous RNA (ceRNA). 17 Indeed, cancer systems biology applications have exploded over the past 3 years, with studies ranging from the study of key drivers of tumorigenesis in melanoma 18,19 to the dissection of tyrosine kinase signals downstream of ERBB receptors. 20,21
Such a regulatory-model–driven view of cancer biology is thus emerging as an important systems-level contribution to the study of this disease. By taking a more holistic view of tumor-related processes, anchored in gene regulatory mechanisms, cancer systems biology mediates the genetic and the genomic views of cancer to provide novel insight into its mechanisms. Specifically, the proponents of these approaches argue that among all genetic and epigenetic alterations in a tumor, those contributing to its initiation, progression, or drug sensitivity cannot affect regulatory interactions in a random way but must co-segregate within specific regulatory subnetworks that are thus globally dysregulated across different samples of a given tumor subtype. Hence, if the full complement of regulatory interactions regulating the behavior of a specific cancer cell population were known, then it should be able to use its structure to separate driver from passenger alterations. The example of RUNX1 in T-ALL 16 is particularly revealing in this case. Here, the functional role of RUNX1 mutations could only be elucidated after determining that its targets are virtually overlapping with those of two previously established oncogenes, TLX1 and TLX3. 22 Without this regulatory insight, it would have been impossible to identify these mutations as statistically significant across the full repertoire of genes.
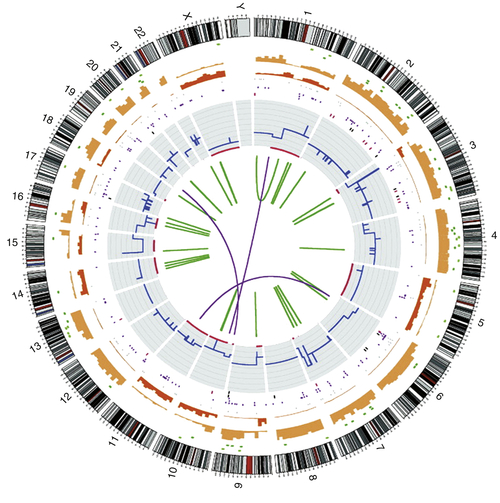
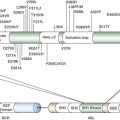
Figure 20-2 Circos plot showing the whole-genome catalogue of somatic mutations from the malignant melanoma cell line COLO-829 This genome has approximately 30,000 somatic base substitutions and 1000 somatic insertions and/or deletions. In coding exons, 272 somatic substitutions are present, including 155 missense changes, 16 nonsense changes, and 101 silent changes. The numbers and types of mutations are highly variable across different cancer genomes. Chromosome number and karyotype are indicated on the exterior of the plot. Key: blue lines, copy number across each chromosome; red lines, sites of loss of heterozygosity (LOH); green lines, intrachromosomal rearrangements; purple lines, interchromosomal rearrangements; red spots, nonsense mutations; green spots, missense mutations; black spots, silent mutations; brown spots, intronic and intergenic mutations (merged). (With permission from Garnett M, McDermott U. Exploiting genetic complexity in cancer to improve therapeutic strategies. Drug Discov Today. 2012;17:188-193).
A key issue, then, is how to assemble accurate and comprehensive repertoires of molecular interactions to create a quantitative regulatory model that may be interrogated to elucidate drivers of tumor-related phenotypes. This is an important question, because virtually all cancer-related publications today contain appealing graphical presentations of molecular pathways in cancer. These bona fide models could provide a starting point for a systems-level study of cancer, as proposed, for instance, by pathway-wide association study (PWAS) strategies. 23
Unfortunately, knowledge of molecular pathways governing physiological and tumor-related traits is still very poor. Indeed, canonical cancer pathways are more reflective of the researcher’s desire to understand biological processes as a relatively linear and interpretable set of events than of the true complexity of cellular regulation. Specifically, these representations have two major limitations. First, they are not context specific. For instance, the EGFR pathway would be identically represented for a glioma and for a lung-cancer cell.
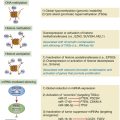
Second, they constitute a manually curated collection of published facts, of which several are actually incorrect, and which represents less than 1% of the total complement of regulatory interactions in the cell. Hence, their use introduces a strong bias toward what is already known (prior knowledge). Indeed, in the absence of a prior hypothesis, interrogation of canonical cancer pathways has been largely unsuccessful in the elucidation of novel tumor-related mechanisms. To understand the difference between a true regulatory network and a canonical cancer pathway, consider Figure 20-4 , A, showing the differential phosphorylation of canonical EGFR pathway proteins in the H1650 cell line, where EGFR has an activating mutation, compared to the average of all cell lines. In contrast, Figure 20-4, B, shows the differentially phosphorylated proteins for the same cell lines in a signal transduction network, inferred de novo from a large-scale collection of phosphopeptide profiles of non–small-cell lung adenocarcinoma. 24 Whereas the pathway-based representation provides no clue that the EGFR pathway may be dysregulated, the network-based representation shows a clear hyperphosphorylated protein pattern surrounding both EGFR and MET.
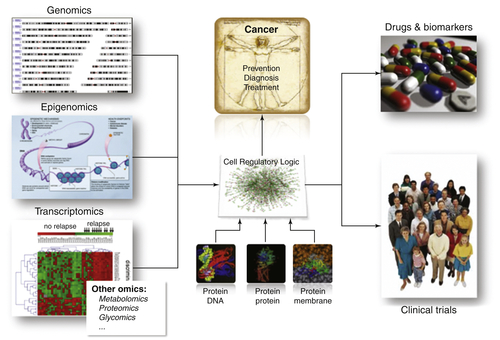
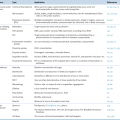
Figure 20-3 The -omics layers of the cell both encode and are processed by a context-specific regulatory logic. At the atomic level, this logic is implemented via molecular interactions, such as protein-DNA, protein-protein, protein-RNA, and RNA-RNA. Dissection and interrogation of this logic in context-specific fashion, using systems biology approaches, is starting to allow elucidation of driver genes responsible for the presentation of relevant cancer-related phenotypes.
In the following, we discuss the idea of a simultaneous, de novo reconstruction of context-specific gene regulatory networks from large-scale molecular profile data, and of the genetic and epigenetic variability they harbor and mediate. A classic systems biology workflow generally involves three steps: First is acquisition of molecular profiles for a variety of molecular species, several of which represent gene products, from mRNA to phosphopeptide abundance, as well as of genetic and epigenetic alterations. Second is data integration and reconstruction of the regulatory models for the specific cellular context of interest. The final step is regulatory model interrogation, using genetic and genomic signatures that represent the cellular states of interest. Given the abundance and prior coverage of molecular profile data for cancer, we concentrate on the two latter steps.
Reverse Engineering Regulatory Networks
From a systems biology perspective, cell behavior is driven by the processing of endogenous and exogenous signals and maintenance of homeostasis by a complex network of molecular interaction, that is, the regulatory model of the cell. The latter consists of several cross-interacting layers, including transcriptional, posttranscriptional, signal transduction, stable protein-complex formation, and metabolic interactions. Disruption of network topology or dynamics, within one of these layers or, more frequently, across layers, can aberrantly reprogram the cell by activating specific genetic programs, with the potential outcome of a stable phenotypic transformation such as is observed in tumorigenesis. Systems biology, as a field, has evolved on the premise that these regulatory models, from simple kinetic models describing a handful of genes to probabilistic models of genome-wide regulation, could be dissected or “reverse engineered” from experimental data to infer their topology and behavior. One should be aware, however, that regulatory interactions in the cell are both dynamic and context dependent. 25 For instance, the Stat3 transcription factor must be phosphorylated to be transcriptionally active. Hence, the presence or absence of kinase activity or upstream signals may activate or inactivate its role as a transcriptional regulator in dynamic fashion. Of course, one could generate a fully representative, multivariate model of regulation that would represent both states of the transcription factor, but this requires the ability to detect changes in the pairwise interactions between the transcription factor and its targets, as the result of the presence or absence of other molecular species. 26 In addition, the complete model is likely so complex and unyielding that it may be more convenient to use simpler, contextualized models of regulation.
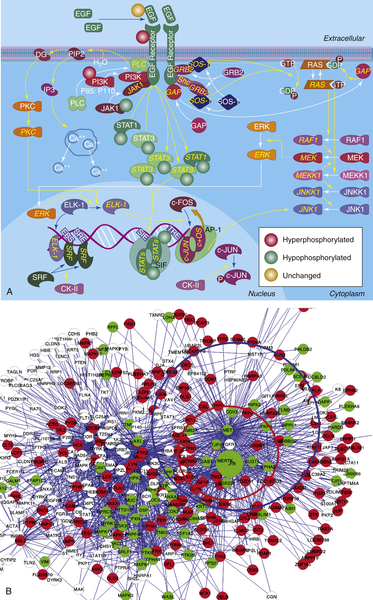
Figure 20-4 Pathway-based vs. network-based representation of differential protein phosphorylation in H1650 cells. (A) Pathway-based representation of differential EGFR pathway protein phosphorylation in H1650 cells, harboring an EGFR-activating mutation. Proteins tagged with a red circle are hyperphosphorylated, those tagged with a green circle are hypophosphorylated, and those with an orange circle are unchanged. Phosphopeptide abundance for the remaining proteins was not detected. (B) Network-based representation of differential protein phosphorylation in H1650 cells. Signal transduction network was inferred de novo from a large phospho-proteomic dataset 24 for non–small-cell adenocarcinoma. Red proteins are hyperphosphorylated, whereas those in green are hypophosphorylated. The red and blue circles represent EGFR and MET substrates, respectively.
Over the past decade, multiple strategies have been developed by systems biologists to reconstruct the regulatory networks of living cells. Initially, these efforts have been driven by the study of yeast and bacteria as simple model organisms. 27–29 One advantage in these organisms is that regulatory regions on the genome, that is, regions where transcription factors and other chromatin binding proteins bind and regulate gene expression, are relatively short, allowing the efficient use of sequence information in reverse engineering. For instance, in yeast, promoter regions have an average length of 600 bp, whereas human genes may have distal regulatory elements hundreds of kilobases away from the transcription start site. In addition, gene regulation in higher eukaryotes is made dauntingly more complex by the presence of alternative splice variants, alternative start sites, and multiple poly-A tails.
Fortunately, as data generation technology and computational algorithms advance, regulatory models are becoming increasingly quantitative and predictive, thus capturing regulation of biological process more precisely. Currently, reverse-engineering methods can be mostly grouped into four categories. The following is not intended to provide a comprehensive description of all reverse engineering approaches in systems biology, but rather to provide a more general understanding of key differences between approaches.
Optimization-Driven Machine Learning Approaches
Because of the high-dimensional nature of the regulatory space covered by molecular profiles and the comparatively small number of distinct molecular profiles available in tumor repositories, such as those assembled by the Cancer Genome Atlas (TCGA) consortium 30 and the Catalogue of Somatic Mutations in Cancer (COSMIC), 31 classical methods such as maximum likelihood are not directly applicable to inferring causal relationships between regulators and regulated gene products. However, several assumptions, such as maximum parsimony, have allowed the successful use of machine learning (ML) approaches. 32 In this context, ML addresses this problem by asking what is the regulatory model with the largest posterior probability to have generated the observed molecular profile data. This cannot be addressed by enumerating all the possible models, of course. As a result, many approaches rely on greedy algorithms and underlying approximations, such as assuming that regulatory models can be effectively represented as directed acyclic graphs (DAG) that lack feedback loops. 27 The final model can then be used to infer systems behavior inferences with future data. 32 Examples of such methods include the analysis of regulators of gene expression modules, 33 as well as the use of Bayesian and dynamic Bayesian networks for reverse engineering transcriptional 27,34 and signal-transduction networks. 35 For a general review of these methods, see Refs. 36 through 38. Factors that affect the precision of the predictions by ML approaches include the dataset quality, feature preselection for single residues, and algorithm selection based on the purpose and data type. 39
Integration of Prior Knowledge and Experimental Evidence
Rather than predicting interaction from a single data modality, such as gene expression profile data, systems biologists have embraced the vast number of repositories containing experimental data from high-throughput approaches. These range from gene expression profiles, to genome-wide chromatin immunoprecipitation data (GW-ChIP), to yeast-two-hybrids and nuclear pull-down assays. Although partial and often inaccurate in isolation, the knowledge contained in these repositories can be effectively integrated into a single unified model, using computational models to combine the probability about a specific event (e.g., the interaction between two molecular species) from a wealth of independent facts. For instance, transcriptional interactions may combine data from GW-ChIP, DNA binding site motif analysis, and co-expression, among a number of other relevant data types. Use of ML frameworks for the integration of multiple weak clues, from naïve Bayes classifiers, 40 to Bayesian networks, 41 to a variety of consensus scoring methods, has been very successful in generating more accurate and comprehensive molecular interaction models. 42,43 Recently, an intriguing result has been shown in the analysis of the Dialogue on Reverse Engineering Assessment Methods (DREAM) challenges. 44 DREAM is an attempt to objectively measure the ability of computational approaches to correctly infer facts about regulatory network structure. Specifically, it was shown that integration of the results of many different inference algorithms performs generally better or at least as well as the best individual algorithm. This is an important result, as we often do not have a principled approach to objectively assess the quality of each given method and may instead want to use the integrative results of several of them. An additional value of integrative methods is that they allow the integration of completely heterogeneous types of data. For instance, it was recently shown that protein structure information from x-ray and nuclear magnetic resonance (NMR) crystallography can be effectively integrated with functional data to accurately predict protein-protein interactions. 45 For a more comprehensive review of integrative approaches, see Ref. 46.
Regression Analysis
Regression techniques have long been used to estimate parameters for kinetic models from experimental data and could, at least in theory, be extended to the inference of parameters for entire regulatory models. Various regression methods have been proposed for pathways or network inference, including maximum likelihood, 47,48 least squares, 49–51 and Bayesian inference, 52–54 to obtain estimates of model parameters. 55 Maximum likelihood approaches infer parameter values from a distribution, as those maximizing the posterior probability of the experimental data; least squares approaches determine the parameter values that minimize the sum of the squares of the residuals, that is, the difference between each experimental and model data point; and finally, Bayesian methods use a priori models for the unknown parameter distribution to compute their most likely values. A key problem of regression methods is that they are generally underdetermined. A determined problem is one where the number of independent observations of a system is equal to the number of parameters that must be estimated. Overdetermined problems—that is, those with more observations than parameters—have the advantage that estimates have some level of statistical robustness. When the number of parameters is much larger than the number of observations, however, an infinite number of parameter values becomes equally possible, thus requiring other heuristics. This is a common issue in real biological systems, as the number of parameters for a system with tens of thousands of interacting molecular species can be in the several hundred thousands, but few datasets with more than a few hundred independent experimental profiles are available for the same system. To address this problem, a number of dimensionality reduction approaches have been developed, which work by either splitting a single high-dimensional problem into a number of independent lower-dimensional ones, such as via singular value decomposition, or by penalizing models with a larger number of connections via sparsity constraints. 56
Information Theory and Probabilistic Methods
Shannon’s information theory provides a probabilistic model to characterize information flow in a system. 57 In recent years, information theory has become a staple of systems biology approaches, 58 for instance, by predicting the minimal machinery in the cell necessary to account for the globally observed information transfer between distinct molecular species characterized by a profile, such as mRNA, 26,59,60 mutational data, 61 and microRNAs. 17,62
In general, these approaches view a regulatory process, such as a signaling pathway or a transcriptional regulatory circuit, as a flow of information carried by a cascade of molecular events, each one adding some noise to the process. Shannon entropies are estimated for each node of the cascade to quantify the information flow, and gain or loss of information is used as evidence to derive the structure of the information circuit. Specifically, the concept of mutual information (MI) 63 or conditional mutual information (CMI) 64 is usually applied to quantify two-way and three-way functional dependencies between variables, respectively. MI measures the mutual dependence of two random variables, without any linearity assumptions, for instance, between the mRNA of a transcription factor and one of its potential targets. CMI measures whether the information transfer between two variables is dependent on a third variable, for instance, the availability of a protein kinase affecting the ability of a transcription factor to regulate its targets. Various probabilistic and information-theoretic methods have been proposed for the reverse engineering of regulatory networks, of which some have been extensively experimentally validated, such as ARACNe, 59,65 MINDy, 26 Hermes, 66 minet, 67 and CLR. 68
ARACNe and MINDy: A Case Study
These two algorithms are among those with the most extensive repertoire of experimental assays supporting their ability to dissect regulatory networks in cancer cells, as well as among the most adopted by the research community. We thus use them as a case study to illustrate several relevant concepts in the area of reverse engineering. Other examples of extensively validated algorithms with applications to the study of cancer and other diseases include CONEXIC, 19 CLR, 18 and Bayesian networks 14,35 ; see Refs. 12 and 69 for a more detailed review.
ARACNe has been widely applied to dissect transcriptional regulatory networks from gene expression profiles of multiple cancer subtypes, including B-cell lymphoma, 65 breast cancer, 70 glioma, 71 and T-cell leukemia. 16 ARACNe first estimates the statistical significance of the mutual information between every possible transcription factor and candidate target (TF A →T) and then removes candidate interactions that violate the data processing inequality, an information-theoretic property stating that information transferred via a direct interaction must exceed that transferred via any indirect path (e.g., TF A →TF B →T). Thus, if even one indirect path is found that exceeds the MI computed for a specific transcription factor–target pair, the candidate direct interaction is eliminated. ARACNe was experimentally validated by ChIP and GW-ChIP assays, as well as by silencing of transcription factors followed by gene expression profiling; see the papers referenced earlier.
This analysis was extended to higher-order interactions. Specifically, the Modulator Inference by Network Dynamics (MINDy) algorithm was developed to identify posttranslational modulators of transcription factor activity on their targets using the conditional mutual information. 26,72 These include both co-transcription factors and upstream signaling proteins regulating the transcription factor activity. 26 Genome-wide searches based on this methodology were successful in identifying the HUWE1 ubiquitin ligase as a key modulator of MYCN in neural stem cells, 15 as well as the serine threonine kinase STK38 as a key modulator of MYC in human B cells, 73 among several other interactions that were experimentally validated.