[level-membership-for-pulmolory-and-respiratory-category]
3 Blood Gas Sampling, Analysis, Monitoring, and Interpretation
Note 1: This book is written to cover every item listed as testable on the Entry Level Examination (ELE), Written Registry Examination (WRE), and Clinical Simulation Examination (CSE).
The listed code for each item is taken from the National Board for Respiratory Care’s (NBRC) Summary Content Outline for CRT (Certified Respiratory Therapist) and Written RRT (Registered Respiratory Therapist) Examinations (http://evolve.elsevier.com/Sills/resptherapist/). For example, if an item is testable on both the ELE and the WRE, it will simply be shown as: (Code: …). If an item is only testable on the ELE, it will be shown as: (ELE code: …). If an item is only testable on the WRE, it will be shown as: (WRE code: …).
MODULE A
There are three broad, general indications for this recommendation:
MODULE B
1. Blood gas sampling device selection and preparation
a. Get the appropriate blood gas sampler
d. Use the proper amount of heparin
This is a concern only when liquid heparin is added to a needle and syringe. Aspirate about 1 mL of 10 mg/mL or 1000 units/mL sodium heparin through the needle into the syringe. Pull the plunger back to coat the inside of the syringe. Push the plunger forward to squirt the excess heparin out through the needle. The values of a 2- to 4-mL sample of blood should not be affected by this concentration. Remember that inadequate heparin can cause the blood sample to clot. Excessive heparin can alter the blood gas values by reducing the pH and the carbon dioxide level and increasing the oxygen level.
2. Manipulate arterial catheters by order or protocol (WRE code: IIA20b) [Difficulty: WRE: R, Ap, An]
a. Select the appropriate catheter
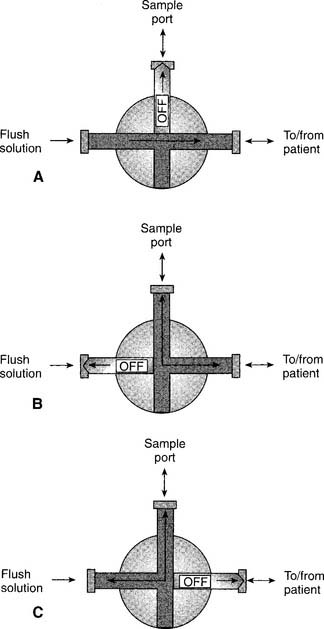
An arterial catheter (also called an arterial line) is a flexible catheter that is placed into a peripheral artery for the purposes of sampling blood or continuously monitoring the patient’s blood pressure, or both. The blood-sampling procedure is explained in the following discussion. Chapter 5 contains a discussion on blood pressure monitoring and illustrations of how the monitoring system is assembled. The radial artery is the most common site for catheter insertion. Alternate arterial sites may be used if needed.
A newborn with a severe cardiopulmonary problem should have the catheter inserted into either of the umbilical arteries. Usually, a long, flexible umbilical artery catheter (UAC) is placed into the patient and advanced into the aorta (see Figure 1-7). If indicated, this should be done as quickly as possible after birth, before arterial spasm prevents the catheter from being advanced. If the patient weighs more than 1250 g, a 6-French (6 Fr) catheter is used; a 3.5 Fr catheter is used if the neonate weighs less than 1250 g. Besides obtaining blood samples and monitoring the blood pressure, one can give the newborn glucose or a blood transfusion through the catheter. A neonatal patient also may have the umbilical vein catheterized.
3. Get a blood sample from an arterial catheter (Code: IB9f and IIIE2b) [Difficulty: ELE: R, Ap; WRE: An]
The steps for obtaining an arterial blood sample include the following:
4. Perform an arterial puncture to obtain a blood sample for analysis (Code: IB9f and IIIE2a) [Difficulty: ELE: R, Ap; WRE: An]
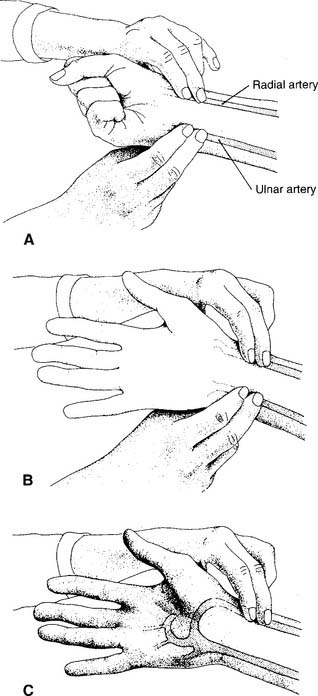
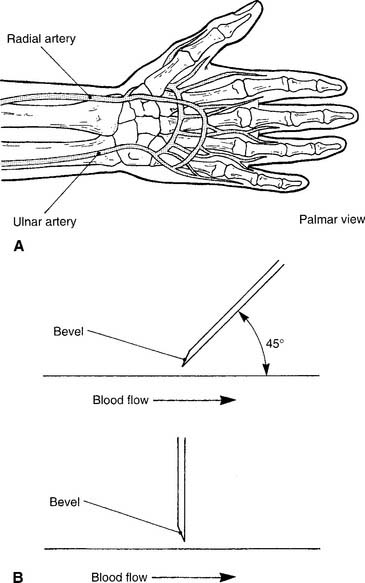
1. Radial artery site
See Figure 3-2 for the basic procedure. Circulation to the hand is stopped by pressing both the radial and the ulnar arteries closed. Releasing the pressure over the ulnar artery should result in the hand flushing within 5 to 15 seconds. This is a positive test result and proves that the ulnar artery has adequate circulation to the hand. If the hand does not flush within 15 seconds of the release of the ulnar artery, the circulation is inadequate, and the radial artery of that wrist must not be punctured. Another site must be evaluated for puncture.
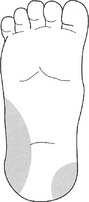
2. Dorsalis pedis artery site
Press down on the dorsalis pedis artery to occlude it. Press on the nail of the great toe so that it blanches. Release the pressure on the nail, and watch for a rapid return of color. This normal test finding confirms that a good blood flow exists through the posterior tibial and lateral plantar arteries. It is safe to draw a sample from the site. A slow return of blood flow indicates poor circulation; another site must be chosen.
5. Perform arterialized capillary blood gas sampling (Code: IB9g and IIIE2c) [Difficulty: ELE: R, Ap; WRE: An]
MODULE C
1. Manipulate a point-of-care blood gas analyzer by order or protocol (Code: IIA10) [Difficulty: ELE: R, Ap; WRE: An]
b. Put the equipment together and make sure that it works properly (CSE code: IIA10)
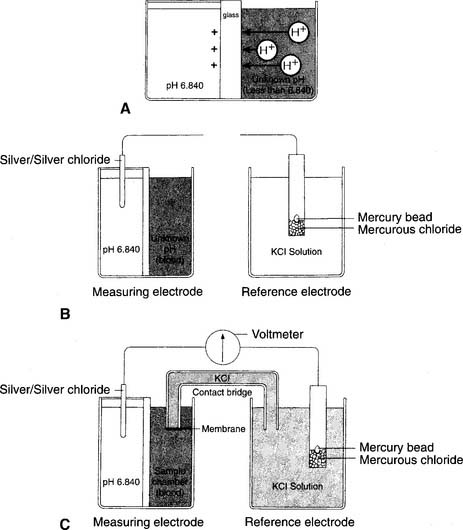
1. pH electrode
The modern pH electrode has existed since the mid-1950s and is usually referred to as the Sanz electrode after its principal inventor. The basic principle behind the pH analyzer is its ability to measure the voltage (potential for electrical flow) between two different solutions. This is based on the different hydrogen ion (H+) concentrations between the solutions that reflect their relative pH values. The reference electrode is immersed in a solution with a pH of 6.840 that fills a glass or plastic chamber. The blood sample, of unknown pH, is placed in a separate measuring chamber called a cuvette. These two chambers are separated by a special glass membrane that contains metals and sodium ions (Na+), thus making it pH sensitive. Both chambers are kept at a stable 37° C temperature. See Figure 3-5 for a graphic representation of the pH electrode. When blood or a quality control (QC) material is introduced into the cuvette, the potential exists for hydrogen ions to replace the sodium ions in the pH-sensitive glass if the two pHs are different. The replacement is proportional to the difference in the two pHs.
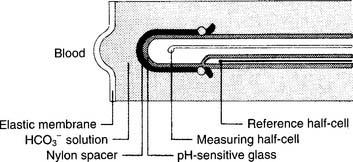
2. Pco2 electrode
The partial pressure of carbon dioxide (Pco2) is measured in a modified pH electrode. This was first designed in the mid-1950s by Stow and further perfected by Severinghaus. Accordingly, these units are now referred to as Severinghaus electrodes, or sometimes as Stow-Severinghaus electrodes. In Figure 3-6, the electrode is depicted in cross section. It has a reference half-cell and a measuring half-cell that are enclosed within pH-sensitive glass and electrically connected by an electrolyte contact bridge. The blood sample is introduced into a cuvette heated to 37° C.
3. Po2 electrode
This unit is completely different from the others mentioned. It was developed in the late 1950s by Clark and thus is usually called a Clark electrode. It is also sometimes known as a polarographic electrode because of the basis of its operation. Figure 3-7 is a drawing of key features of the unit. A phosphate-KCl buffer solution surrounds the silver anode. A thin membrane separates the blood-filled cuvette from direct contact with the electrode but allows oxygen molecules to diffuse slowly through to contact the platinum wire cathode. The whole unit is heated to 37° C. The term polarographic comes from the addition of about 0.7 volt to the cathode to make it slightly “polarized” or negative compared with the anode. This is needed to ensure that oxygen is rapidly chemically reduced (that it gains electrons) at the cathode. This creates an electrical current directly proportional to the number of reduced oxygen molecules.
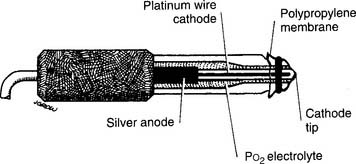
Figure 3-7 Schematic illustration of the Clark electrode for measuring PO2.
(From Harrison BA, Shapiro C: Clinical application of blood gases, ed 4, St Louis, 1989, Mosby.)
It must be understood that the partial pressure of oxygen (Po2) being measured is derived from oxygen that is dissolved in the plasma. It does not come from the hemoglobin found in the erythrocytes (red blood cells). The reported value for the saturation of oxygen in the hemoglobin (Sao2) is calculated by using a mathematical table. Under normal conditions, the calculated Sao2 value is the same as or close to the true Sao2 value. Carbon monoxide (CO) poisoning is the only commonly seen clinical situation during which a calculated saturation can be incorrectly high. If carbon monoxide poisoning is suspected or known, the patient’s blood sample should be analyzed on a CO-oximeter unit.
d. Perform quality control procedures for a blood gas analyzer (Code: IIC1) [Difficulty: ELE: R, Ap; WRE: An]
5. Levey-Jennings charts
An out-of-control situation exists whenever a single calibration value or a series of calibration values is outside established limits. A random error is an unpredictable aberration in precision that occurs when the QC material is sampled. A systematic error shows an accuracy problem and is much more serious. It must be investigated, corrected, and documented. Figure 3-8 shows an example of both random error and systematic error. Rules have been established for determining whether the error is random or systematic (Table 3-1).
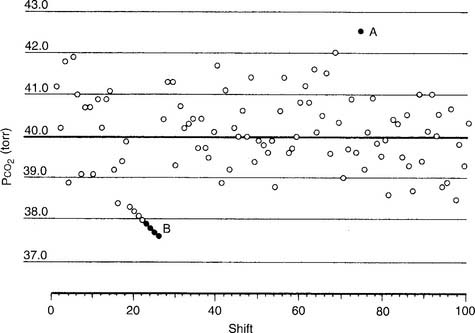
TABLE 3-1 Westgard’s Rules for Determining When an Aalyzer Is Not Functioning Properly
| Rule name | Levey-Jennings chart |
|---|---|
| RANDOM ERROR | |
| 1-2 SDs | The measurement is more than 2 SDs but not more than 3 SDs from the mean. |
| 1-3 SDs | The measurement is more than 3 SDs from the mean. |
| R*-4 SDs | Two consecutive measurements are 4 SDs or more apart. |
| SYSTEMATIC ERROR | |
| 2-2 SDs | Two consecutive measurements are either 2 SDs above or 2 SDs below the mean. |
| 4-1 SDs | Four consecutive measurements are either 1 SD above or 1 SD below the mean. |
| 7-trend | Seven consecutive measurements are on only one side of the mean; each measurement is progressively more out of control. |
| 10-mean | Ten consecutive measurements are on only one side of the mean. |
SDs, standard deviations.
Modified from Lane EE, Walker JF: Clinical arterial blood gas analysis, St Louis, 1987, Mosby.
6. pH electrode
a. One-point calibration
7. Pco2 electrode
a. One-point calibration


8. Po2 electrode
a. One-point calibration
c. Three-point calibration


10. Calibration gas cylinders
For economic reasons, the low-percentage oxygen and carbon dioxide gases are placed together in one cylinder, and the high-percentage oxygen and carbon dioxide gases are placed together in a second cylinder. Box 3-1 summarizes the normal precision of the electrodes discussed and the gases used in their calibration. A cylinder containing 100% oxygen and no carbon dioxide can be used for three-point calibration.
e. Perform quality control procedures for a point-of-care blood gas analyzer (Code: IIC3) [Difficulty: ELE: R, Ap; WRE: An]
f. Perform blood gas analysis (Code: IB9j and IIIE3c) [Difficulty: ELE: R, Ap; WRE: An]
1. CO-oximeter/hemoximeter
a. Perform quality control procedures on the CO-oximeter/hemoximeter (Code: IIC1) [Difficulty: ELE: R, Ap; WRE: An].
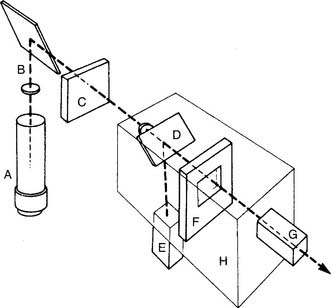
The unit is preassembled by the manufacturer. Practical experience with a unit is recommended to understand how to add a patient blood sample and perform calibration duties. (See Figure 3-9 for a schematic drawing of a CO-oximeter.) A thallium-neon hollow cathode lamp emits light in the infrared-visible range. A device called a monochromator contains four filters and rotates through the light beam. Each filter allows only one specific wavelength to pass through it. These four monochromatic wavelengths correspond to the three isosbestic points, discussed later (shown in Figure 3-10) and 626.6 nm. This last wavelength is poorly absorbed by all four hemoglobin moieties. It is used to find the maximal difference in absorption so that the relative amounts of the hemoglobin species can be determined.
The following are examples of common problems and their solutions:
b. Perform CO-oximetry/hemoximetry (Code: IB9j and IIIE3c) [Difficulty: ELE: R, Ap; WRE: An].
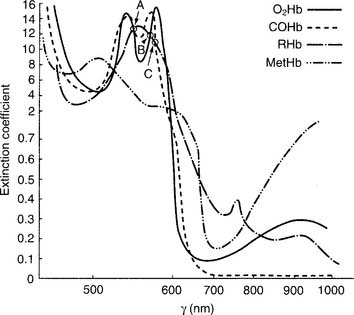
Each of these hemoglobin moieties has a unique spectroscopic “fingerprint” of absorbed light-wave frequencies. See Figure 3-10 for the spectral analysis of the various forms of hemoglobin.
MODULE D
1. Review the chart for any blood gas results (Code: IA5) [Difficulty: ELE: R; WRE: Ap]
Look in the chart for any blood gas results, including arterial, capillary, or mixed venous. Any patient may have had an arterial sample analyzed. A neonate also may have had an arterialized capillary sample analyzed. A patient with a pulmonary artery catheter may have had a mixed venous sample analyzed.
2. Interpret the results of arterial blood gas analysis (Code: IB10j, IB10f, and IIIE4a) [Difficulty: ELE: R, Ap; WRE: An]
A number of authors have written extensively on how to interpret ABGs. The system proposed by Shapiro and associates (1994) has been found to be both practical and relatively easy to understand. Most of the following discussion and tables are based on this system. This does not mean that if one has learned another system, he or she is at any disadvantage for taking the National Board for Respiratory Care (NBRC) examination.
a. Assessment of oxygenation
Hypoxemia or hypoxia can rapidly become life threatening. This will often be first seen when the patient develops cardiac arrhythmias, unstable vital signs, and mental confusion or unconsciousness. Table 3-2 shows the normal Pao2 values for the newborn, child to adult, and the elderly when room air (almost 21% oxygen) is inhaled at sea level. These values decrease progressively as altitude increases. However, under most clinical conditions, this is not a factor unless working in a high-altitude setting.
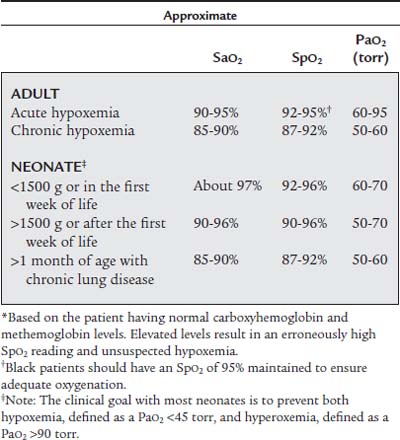
TABLE 3-2 Age-Based Acceptable Levels of Partial Pressure of Oxygen in Arterial Blood (Pao2) When Breathing Room Air (21% Oxygen) at Sea Level
| Age | Pao2 |
|---|---|
| NEWBORN | |
| Acceptable range | 40 to 70 torr |
| CHILD TO ADULT | |
| Normal | 97 torr |
| Acceptable range | >80 torr |
| Hypoxemia | <80 torr |
| OLDER ADULT | |
| 60-year-old | >80 torr |
| 70-year-old | >70 torr |
| 80-year-old | >60 torr |
| 90-year-old | >50 torr |
Modified from Shapiro BA, Peruzzi WT, Kozelowski-Templin R: Clinical application of blood gases, ed 5, Chicago, 1994, Mosby-Year Book.
A general rule is that any patient is seriously hypoxemic if the Pao2 is less than 60 torr on room air. See Table 3-3 for guidelines on judging the seriousness of hypoxemia. Once hypoxemia is recognized, it must be corrected. The most obvious way to correct hypoxemia is to give supplemental oxygen. The clinician must realize that oxygen alone will not correct the hypoxemia if the patient is hypoventilating (increased Paco2), has heart failure, or is unable to carry or make use of the oxygen. In general, try to keep the patient’s Pao2 level between 60 and 100 torr.
TABLE 3-3 Evaluation of Hypoxemia
| CONDITIONS: ROOM AIR IS INSPIRED; THE PATIENT IS YOUNGER THAN 60 YEARS* | ||
|---|---|---|
| Hypoxemia | Pao2 | Sao2 |
| Mild | 60-79 torr | 90-94% |
| Moderate | 40-59 torr | 75-89% |
| Severe | <40 torr | <75% |
| CONDITIONS: SUPPLEMENTAL O2 IS INSPIRED; THE PATIENT IS YOUNGER THAN 60 YEARS | |
|---|---|
| Hypoxemia | Pao2 |
| Uncorrected | Less than room air acceptable limit |
| Corrected | Within room air acceptable limit (<100 torr) |
| Excessively corrected | >100 torr |
* Subtract 1 torr of O2 from limits of mild and moderate hypoxemia for each year older than 60. A Pao2 value of <40 torr indicates severe hypoxemia in any patient at any age.
Modified from Shapiro BA, Peruzzi WT, Kozelowski-Templin R: Clinical application of blood gases, ed 5, Chicago, 1994, Mosby-Year Book.
Shapiro and associates (1994) suggested the following formula, in which FiO2 is the fraction of inspired oxygen, for determining whether the patient will be hypoxemic on room air: “If Pao2 is less than FiO2 ×5, the patient can be assumed to be hypoxemic on room air.”
Figure 3-11 shows a normal oxyhemoglobin dissociation curve. The saturation value is important to know because it shows how much hemoglobin is saturated with oxygen. Several important points of correlation exist between the Sao2 and the Pao2. (Calculated saturation values can be misleadingly high if the patient has inhaled carbon monoxide. In this situation, it is best to measure the saturation directly on a CO-oximeter–type blood gas analyzer.)
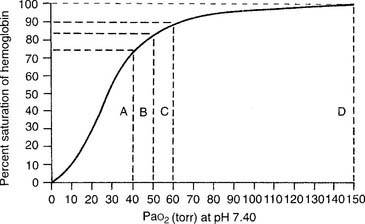
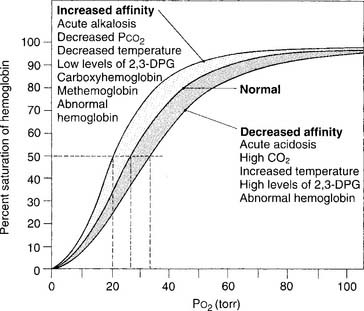
Figure 3-12 shows a number of factors that can influence the oxyhemoglobin dissociation curve and how oxygen associates and dissociates from hemoglobin. In a patient with normal oxygenation, these factors are not clinically significant. However, when the Pao2 level is less than 60 torr and the Sao2 level is less than 90%, these factors can become an important consideration. As can be seen, a left-shifted oxyhemoglobin dissociation curve results in a lower Pao2 value at any given saturation. This results in even less oxygen being delivered to the tissues.
b. Assessment of carbon dioxide and pH
Table 3-4 shows normal values for pH and Paco2 and the acceptable ranges around the mean or average. Table 3-5 shows the most widely acceptable therapeutic ranges for pH and Paco2. Values that fall outside of these ranges present a progressively greater risk to the patient.
TABLE 3-4 Normal Laboratory Ranges for Partial Pressure of Carbon Dioxide in Arterial Blood (Paco2) and pH
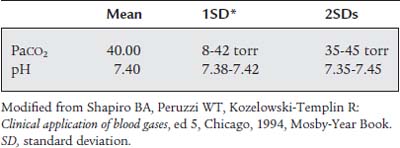
TABLE 3-5 Acceptable Clinical Ranges for Partial Pressure of Carbon Dioxide in Arterial Blood (Paco2) and pH
| Paco2 | 30-50 torr* |
| pH | 7.30-7.50 |
* This is the range for patients with an acute change. It does not apply to patients with long-standing disease, such as chronic obstructive pulmonary disease. These patients may have Paco2 values greater than 50 torr.
Modified from Shapiro BA, Peruzzi WT, Kozelowski-Templin R: Clinical application of blood gases, ed 5, Chicago, 1994, Mosby-Year Book.
Table 3-6 shows the definitions of Shapiro and associates for alkalemia and acidemia from a respiratory cause. An acute change in the patient’s ventilation causes the following when starting from a Paco2 of 40 torr:
TABLE 3-6 Naming Unacceptable Values for Partial Pressure of CO2 in Arterial Blood (Paco2) and pH
| Paco2 >45 torr | Respiratory acidosis/alveolar hypoventilation/ventilatory failure |
| pH <7.35 | Acidemia |
| Paco2 <35 torr | Respiratory alkalosis/alveolar hyperventilation |
| pH >7.45 | Alkalemia |
Modified from Shapiro BA, Peruzzi WT, Kozelowski-Templin R: Clinical application of blood gases, ed 5, Chicago, 1994, Mosby-Year Book.
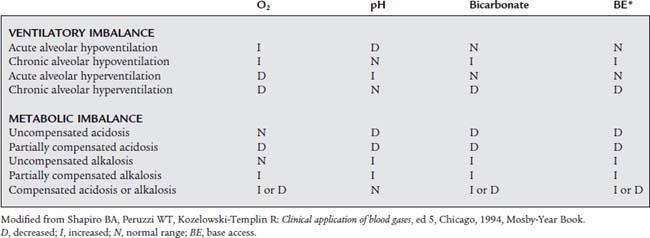
Metabolic effects are evaluated by interpreting either the bicarbonate (HCO3−) value or the base excess/base deficit (BE/BD) value. Both reveal whether any metabolic effect on the pH exists. Normal values are as follows:
Values indicating metabolic alkalosis of a primary or secondary nature are as follows:
Values indicating metabolic acidosis of a primary or secondary nature are as follows:
Tables 3-7 to 3-9 show definitions of terms and classifications of the various acid-base states. As stated earlier, there are other systems for interpreting blood gases. All are probably satisfactory for interpretation purposes and preparing for the NBRC examinations.
TABLE 3-7 Clinical Terminology for Arterial Blood Gas Measurements
| Clinical Terminology | Clinical Findings |
|---|---|
| Respiratory acidosis/alveolar hypoventilation/ventilatory failure | Paco2 >45 torr |
| Acute ventilatory failure | Paco2 >45 torr; pH <7.35 |
| Chronic ventilatory failure | Paco2 >45 torr; pH 7.36-7.40 |
| Respiratory alkalosis/alveolar hyperventilation | Paco2 <35 torr |
| Acute alveolar hyperventilation | Paco2 <35 torr; pH >7.45 |
| Chronic alveolar hyperventilation | Paco2 <35 torr; pH 7.41-7.45 |
| Acidemia | pH <7.35 |
| Acidosis | Pathophysiologic condition in which the patient has a significant base deficit (plasma bicarbonate level below normal) |
| Alkalemia | pH >7.45 |
| Alkalosis | Pathophysiologic condition in which the patient has a significant base excess (plasma bicarbonate level above normal) |
Modified from Shapiro BA, Peruzzi WT, Kozelowski-Templin R: Clinical application of blood gases, ed 5, Chicago, 1994, Mosby-Year Book.
TABLE 3-8 Evaluation of Ventilatory and Metabolic Effects on Acid-Base Status
| EVALUATION OF Paco2 | |
| Paco2 >45 torr | Respiratory acidosis/alveolar hypoventilation/ventilatory failure |
| Paco2 35-45 torr | Acceptable alveolar ventilation |
| Paco2 <35 torr | Respiratory alkalosis/alveolar hyperventilation |
| EVALUATION OF Paco2 IN CONJUNCTION WITH pH* | |
| Acceptable Alveolar Ventilation (Paco2 from 35 to 45 torr) | |
| pH >7.50 | Metabolic alkalosis |
| pH 7.30-7.50 | Acceptable pH |
| pH <7.30 | Metabolic acidosis |
| Alveolar Hypoventilation (Paco2 >45 torr) | |
| pH >7.50 | Partially compensated metabolic alkalosis |
| pH 7.30-7.40 | Chronic ventilatory failure |
| pH <7.30 | Acute ventilatory failure |
| Alveolar Hyperventilation (Paco2 <35 torr) | |
| pH >7.50 | Acute alveolar hyperventilation |
| pH 7.40-7.50 | Chronic alveolar hyperventilation |
| pH 7.30-7.40 | Compensated metabolic acidosis |
| pH <7.30 | Partially compensated metabolic acidosis |
Paco2, partial pressure of CO2 in arterial blood.
* Some authors use a narrower pH range for these classifications.
Modified from Shapiro BA, Peruzzi WT, Kozelowski-Templin R: Clinical application of blood gases, ed 5, Chicago, 1994, Mosby-Year Book.
3. Interpret the results of CO-oximetry/hemoximetry blood gas analysis (Code: IB10j and IIIE4b) [Difficulty: ELE: R, Ap; WRE: An]
The CO-oximeter type blood gas analyzer gives values for oxyhemoglobin (O2Hb), reduced hemoglobin (RHb), carboxyhemoglobin (COHb), and methemoglobin (MetHb)/sulfhemoglobin (SHb). Each of these hemoglobin moieties can be displayed in terms of grams per deciliter, percentage of the whole, and added together for a total hemoglobin (THb) value. Table 3-10 shows normal adult hemoglobin values. The amounts of carboxyhemoglobin and methemoglobin should be subtracted from the total hemoglobin amount to find the amount of functional hemoglobin. Any increase in the COHb or MetHb levels above those listed is abnormal and results in even less normal hemoglobin to carry oxygen. The patient with carbon monoxide poisoning is at greatest risk. A COHb level of 30% saturation or greater can be fatal. By subtraction, the O2Hb (Sao2) level can be no greater than 70% with a resulting Pao2 of less than 40 torr.
| Total hemoglobin (THb) | Men: 13.5-18.0 g/dL |
| Women: 12.0-16.0 g/dL | |
| 15.0 g/dL is often listed as an average for both | |
| Oxyhemoglobin | 94-100% of THb (reported as Sao2*) of 94-100% |
| Carboxyhemoglobin | Nonsmokers: <1.5% (0.225 g/dL) of THb |
| Smokers: 1.5-10% of THb | |
| Methemoglobin | 0.5-3% (0.075-0.45 g/dL) of THb |
| Oxygen content (arterial sample) | 15-23 g/dL |
g/dL, grams per deciliter (sometimes listed as g/100 mL); Sao2, O2 saturation in arterial blood.
4. Mixed venous blood gases
a. Review the patient’s chart for mixed venous blood gas results (Code: IA5) [Difficulty: ELE: R; WRE: Ap]
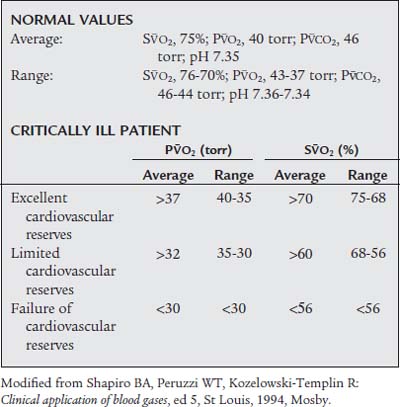
A mixed venous blood sample can be taken from the pulmonary artery of any patient who has a pulmonary artery (Swan-Ganz) catheter. This is a true mixed venous sample and should not be confused with a blood sample taken from an arm vein or other venous site. The symbol P is the prefix for venous blood gas values of oxygen and so forth. In general, a typical patient has the following mixed venous blood gas values: S
 O2, 75%; P
 O2, 40 mm Hg; P
 CO2, 46 mm Hg; and pH 7.35. (Table 3-11 provides details on normal venous blood gas values and their interpretation in patients with cardiovascular disease.)
b. Interpret the results of mixed venous blood gas analysis to evaluate the patient’s response to respiratory care (Code: IB10j and IIIE4a) [Difficulty: ELE: R, Ap; WRE: An]
In the critically ill patient, it is just as important to measure the mixed venous blood gases as it is to measure the ABGs. The venous blood gas values reveal what has happened as the arterial blood has passed through the body. Oxygen has been extracted, and carbon dioxide has been added to the blood. The difference between the arterial and venous oxygen levels reflects oxygen consumption by the body as well as cardiac output.
Because of this, the most critical venous blood gas values to measure are the S O2 and P
 O2. It is generally accepted that a P
 O2 value of less than 30 torr or an S
 O2 value of less than 56% indicates that the patient has tissue hypoxia. Both values can be obtained by analyzing a mixed venous blood sample taken through a pulmonary artery catheter. If the patient has a fiberoptic catheter, the S
 O2 value can be monitored continuously. This is extremely helpful if the patient is unstable or having frequent changes in inspired oxygen or ventilator settings. (Pulmonary artery catheters are discussed in more detail in Chapter 5.)
5. Arterialized capillary blood gases
a. Review the patient’s chart for arterialized capillary blood gas results (Code: IA5) [Difficulty: ELE: R; WRE: Ap]
MODULE E
1. Check the patient’s chart for previous pulse oximetry results (Code: IA7e) [Difficulty: ELE: R; WRE: Ap]
3. Manipulate a pulse oximeter by order or protocol (ELE code: IIA22) [Difficulty: ELE: R, Ap, An]
a. Get an appropriate pulse oximeter and related equipment
Each pulse oximeter reports a percentage of hemoglobin saturation with oxygen (Spo2). This information and the patient’s heart rate are displayed on a light-emitting diode (LED). More expensive units store the information in memory and/or print out a copy of the Spo2 percentage and pulse rate to be placed into the patient’s chart if it is required. A variety of sensors fit the feet or hands of infants, an adult’s fingers, the bridge of the nose, the forehead, and the earlobe. Choose a sensor designed to fit the site that is selected.
b. Put the equipment together and make sure that it works properly
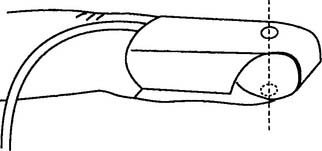
Follow the manufacturer’s suggestions for setup. The newer pulse oximetry systems visually display the strength of the pulse so that the best place for the probe can be found (Figure 3-13). Keep bright light away from the patient site and transducer. Figure 3-14 shows how to apply the finger probe properly.
c. Troubleshoot any problems with the equipment
The pulse signal will not be strong if the patient has poor circulation at the site of the oximeter probe. This can occur if the patient is hypothermic, hypotensive, or receiving a vasoconstricting medication. If the pulse signal is weak, the pulse oximetry values may not be accurate. See Table 3-12 for common sources of error and their solutions.
| Sources of Error | Remedy |
|---|---|
| Light interference: xenon lamp, fluorescent light, infrared (bilirubin) light; probe fell off of patient | Cover the probe with an opaque wrap; put the probe back in place on the patient |
| Low perfusion: low blood pressure, hypothermia, vasoconstricting drugs | Use earlobe, bridge of nose, or forehead instead of finger or toe; discontinue use if still unreliable |
| Motion artifact | Secure the probe site; ensure that the Spo2* reading is synchronized with the heart rate |
| Darkly pigmented patient | Use lightly pigmented site such as tip of finger or toe; Spo2 value may overestimate Pao2; discontinue use if still unreliable |
| Artificial or painted fingernails | Remove acrylic nails; remove black, blue, green, metallic, or frosted nail polish; use a different site |
| Venous pulsation being read as an arterial pulsation | Loosen a tight sensor; change the finger sensor site every 2-4 hr; loosen the cause of a tourniquet-like effect |
| The following vascular dyes will cause low Spo2 readings: methylene blue, indigo carmine, indocyanine green | Do not use Spo2 |
Pao2, partial pressure of O2 in arterial blood; Spo2, pulse oximeter.
4. Perform pulse oximetry on your patient (Code: IB9c and IIIE3b) [Difficulty: ELE: R; WRE: Ap, An]
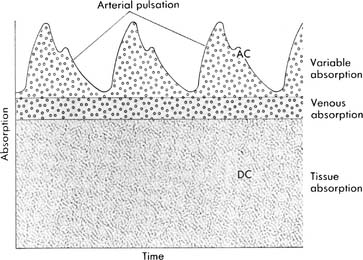
The second principle is plethysmography. It is used to find and then evaluate the amplitude of the arterial pulse waveform. See Figure 3-13 for the plethysmographic arterial waveform. When the pulse oximeter sensor is placed on a patient site, the fingertip for example, the two wavelengths of light shine through the blood, tissues, and bone within the finger. It is important that the sending LED and receiving (photodiode) sensors be opposite each other (see Figure 3-14). Most units have a signal strength display that indicates when the photodiode is receiving a strong signal, and the patient’s pulse has been detected. The microprocessor is designed to detect a baseline level of light absorption by the tissues and venous blood, containing more RHb, as well as the light absorption of arterial blood, containing more O2Hb. It can then compare the absorptions of the two wavelengths to determine the level of saturated oxyhemoglobin. This is displayed as saturation by pulse oximetry, or Spo2.
The second-generation pulse oximeters (Masimo Rad-57 or Rainbow SET) analyze 7 to 12 wavelengths of light. Because of this, they can identify and measure the various normal and abnormal types of hemoglobin, such as carboxyhemoglobin (SpCO) from carbon monoxide poisoning and methemoglobin (SpMet) from nitric oxide therapy. These units provide the opportunity to continuously monitor patients with elevated levels of carboxyhemoglobin and methemoglobin as they are being treated. It may not be necessary to draw as many arterial blood gas samples for analysis through a CO-oximeter. If necessary, review the discussion on CO-oximeters and see Figure 3-10 since the principles apply to second-generation pulse oximeters.
Table 3-13 lists common clinical ranges for Spo2 values. For the aforementioned reasons, with first-generation pulse oximeters the minimum safe values are 2% higher than the corresponding Sao2 value by CO-oximetry. It is important that the patient have good pulsatile blood flow to the measurement site to obtain an accurate reading.
5. Interpret a patient’s pulse oximetry value (Code: IB10c and IIIE4d) [Difficulty: ELE: R, Ap; WRE: An]
The previously healthy patient who has cardiopulmonary failure should have the Spo2 value kept at 92% or greater to ensure adequate oxygenation. The patient with chronic obstructive pulmonary disease (COPD) can probably tolerate an Spo2 value as low as 87%. In general, a neonate should have the Spo2 level kept between 92% and 96%. See Table 3-13 for more specific guidelines. Saturations below these values indicate hypoxemia in most patients.
Note the site at which the saturation was measured. This is especially important in neonates who may have congenital heart defects. A higher saturation in the right fingers or right earlobe compared with the rest of the body is seen in a neonate who has patent ductus arteriosus (PDA). A higher saturation in the fingers and earlobes as compared with the toes is seen in a neonate who has coarctation of the aorta.
MODULE F
1. Review the patient’s chart for a transcutaneous oxygen (Ptco2) value (Code: IA7e) [Difficulty: ELE: R; WRE: Ap]
2. Recommend transcutaneous oxygen monitoring for additional data (Code: IC8) [Difficulty: ELE: R, Ap; WRE: An]
Ptco2 monitoring has been used for the following purposes:
3. Manipulate a transcutaneous oxygen monitor by order or protocol (ELE code: IIA22) [Difficulty: ELE: R, Ap, An]
a. Get the necessary equipment to perform transcutaneous oxygen monitoring
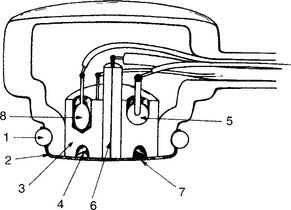
The electrode used for monitoring the patient’s transcutaneous oxygen level is a miniaturized and modified Clark-type polarographic electrode similar to that used in the blood gas analyzer (Figure 3-15). Some authors describe it as a Huch or Hellige electrode, named after two researchers who modified the original Clark electrode for their work with pediatric patients.
4. Perform quality control procedures on a transcutaneous oxygen monitor (Code: IIC7) [Difficulty: ELE: R, Ap; WRE: An]
a. Calibration

in which PB is the local barometric pressure and 0.2095 is the oxygen fraction found in room air. Expose the electrode to room air to determine whether it matches the calculated calibration value. Adjust the instrument to match the calibration Ptco2 if necessary. It is recommended that the room air calibration point be rechecked every 24 hours when in continuous use, after changing the membrane, or after changing the electrolyte solution. A variation of up to ± 5 torr is acceptable and can be corrected by adjusting the reading on the instrument. If the variation is greater than ± 5 torr, the zero point and room air calibration procedures should be repeated.
5. Perform transcutaneous oxygen (Ptco2) monitoring (Code: IB9b) [Difficulty: ELE: R, Ap; WRE: An]
a. Site selection
Care must be taken to select the best site for the electrode. A bad site will give incorrect information that can lead to mistakes in patient care. See Box 3-2 for a listing of site selection guidelines.
b. Skin and electrode preparation and application of the skin electrode
An airtight seal between the skin and electrode is necessary for accurate readings. An air leak (21% oxygen) will falsely increase or decrease the Ptco2 reading from the patient’ s actual value. A room air leak will always cause a decrease in the PtcCO2 reading. The following steps should be taken to ensure that the skin site and electrode are prepared and an airtight seal is ensured:
6. Interpret transcutaneous oxygen monitoring values to evaluate the patient’s response to respiratory care (Code: IB10b) [Difficulty: ELE: R, Ap; WRE: An]
An arterial blood gas sample should be drawn for Pao2 every time transcutaneous oxygen monitoring is started. The Pao2-PtCO2 gradient can then be calculated as the difference between the two. For example, if the patient’s Pao2 value is 100 torr, the PtCO2 value should be no less than 85 torr. If the PtCO2 level decreases to 70 torr, the Pao2 level should have decreased to no lower than 85 torr. Because of this close correlation, the patient’s trend can be monitored with some assurance of accuracy. In addition, ABG samples do not need to be drawn as frequently for the Pao2 measurement. This trending relation holds true for changes in the patient’s pulmonary condition. It does not, however, hold true when the patient has cardiovascular problems such as hypotension, hypothermia, peripheral vascular disease, or cardiogenic shock with decreased tissue perfusion.
a. Correlation of Ptco2 and local power consumption
MODULE G
1. Review the patient’s chart for a transcutaneous carbon dioxide value (Code: IA7e) [Difficulty: ELE: R; WRE: Ap]
2. Recommend transcutaneous carbon dioxide monitoring for additional data (Code: IC8) [Difficulty: ELE: R, Ap; WRE: An]
PtcCO2 monitoring has been used for the following purposes:
3. Manipulate a transcutaneous carbon dioxide monitor by order or protocol (ELE code: IIA22) [Difficulty: ELE: R, Ap, An]
a. Get the necessary equipment to perform transcutaneous carbon dioxide monitoring
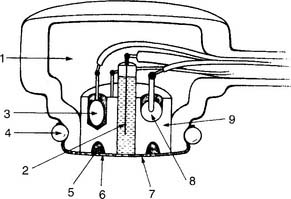
The electrode used for monitoring the patient’s transcutaneous carbon dioxide level is a miniaturized and modified Stow-Severinghaus–type electrode similar to the ABG electrode (Figure 3-16).
4. Perform quality control procedures on a transcutaneous carbon dioxide monitor (Code: IIC7) [Difficulty: ELE: R, Ap; WRE: An]
Calibration PtcCO2 = (PB × CO2% used) − XCO2 × electrode temperature factor)
in which PB is the local barometric pressure; CO2% is the carbon dioxide fraction exposed to the electrode, either 10% (0.10) or 5% (0.05); and XCO2 is the correction factor used to equilibrate the PtcCO2 to Paco2. (This is discussed later.)
5. Perform transcutaneous carbon dioxide (PtcCO2) monitoring (Code: IB9b) [Difficulty: ELE: R, Ap; WRE: An]
The information on skin-site selection and so forth presented in the preceding discussion of transcutaneous oxygen monitors applies here, as well. As with the transcutaneous oxygen electrode, it has been found that heating the PtcCO2 electrode speeds the diffusion of carbon dioxide through the skin. Always follow the manufacturer’s recommendations for the proper electrode temperature. In general, the temperature is 44° C in both neonates and adults. It must be remembered that the PtcCO2 value is not the same as the Paco2 value. An arterial blood gas sample should be analyzed for Paco2 value every time transcutaneous carbon dioxide monitoring is started. Unlike transcutaneous oxygen monitoring, the correlation between Paco2 and PtcCO2 values is as good in adult patients as in neonatal patients. In addition, it is not as easily influenced by changes in the patient’s skin blood flow.

MODULE H
1. Analyze available information to determine the patient’s pathophysiologic state (Code: IIIH1) [Difficulty: ELE: R, Ap; WRE: An]
2. Difference between the alveolar oxygen level and the arterial oxygen level
a. Calculate the difference between the alveolar oxygen level and the arterial oxygen level (ELE code: IB9i) [Difference: ELE: R, Ap]
Perform the following to determine the alveolar-arterial O2 pressure difference [P(A-a)O2]:

The factor of 0.8 is based on how much oxygen a normal person uses in 1 minute and how much carbon dioxide is produced in 1 minute. The symbols for this metabolic value are R for respiratory exchange ratio and RQ for respiratory quotient. The following calculation is based on a normal person’s metabolism:
b. Interpret the results of the P(A-a)O2 calculation (Code: IB10i) [Difficulty: ELE: R, Ap; WRE: An]
When interpreting the patient’s value, remember that the P(A-a)O2 level in a normal young person should be no greater than 15 torr. The difference slowly increases as a normal person ages (see Figure 3-17). Lung disease causes the value to increase significantly. The following are examples of some conditions in which the measurement of the P(A-a)O2 level aids in diagnosis or treatment:
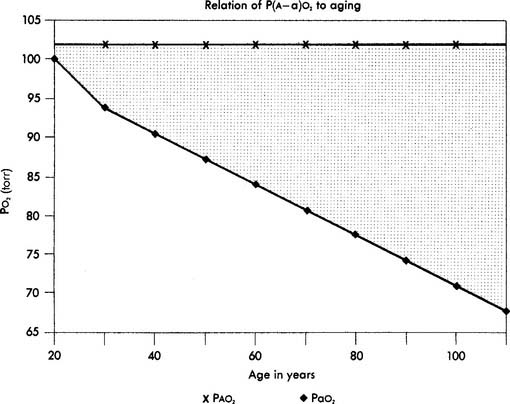
Interpretation: A P(A-a) O2 value of 10 torr is normal for a patient of this age. It is normal to see a difference between the alveolar and arterial oxygen levels that starts in the range of 4 to 12 torr and slowly increases with age (Figure 3-17).
3. Determine the appropriateness of the prescribed therapy and goals for the identified pathophysiologic state (Code: IIIH3) [Difficulty: ELE: R, Ap; WRE: An]
4. Terminate the procedure if the patient has an adverse reaction to it (Code: IIIF1) [Difficulty: ELE: R, Ap; WRE: An]
Aloan CA, Hill TV, editors. Respiratory care of the newborn and child, ed 2, Philadelphia: Lippincott-Raven, 1997.
American Academy of Pediatrics. Task force on transcutaneous oxygen monitors. Pediatrics. 1989;83(1):122.
American Association for Respiratory Care. Clinical practice guideline: blood gas analysis and hemoximetry: 2001 revision and update. Respir Care. 2001;46:498-505.
American Association for Respiratory Care. Clinical practice guideline: transcutaneous blood gas monitoring for neonatal and pediatric patients: 2004 revision and update. Respir Care. 2004;49(9):1069-1072.
American Association for Respiratory Care. Clinical practice guideline: transcutaneous blood gas monitoring for neonatal and pediatric patients. Respir Care. 1994;39(12):1176.
American Association for Respiratory Care. Clinical practice guideline: capillary blood gas sampling for neonatal and pediatric patients. Respir Care. 1994;39(12):1180.
American Association for Respiratory Care. Clinical practice guideline: oxygen therapy in the acute care hospital. Respir Care. 1991;36(12):1410.
American Association for Respiratory Care. Clinical practice guideline: pulse oximetry. Respir Care. 1991;36(12):1406.
American Association for Respiratory Care. Clinical practice guideline: sampling for arterial blood gas analysis. Respir Care. 1991;37(8):913.
American Association for Respiratory Care. Clinical practice guideline: in-vitro pH and blood gas analysis and hemoximetry. Respir Care. 1993;38(5):505.
Barnes TA, editor. Textbook of respiratory care practice, ed 2, St Louis: Mosby, 1994.
Blanchette T, Dziodzio J, Harris K. Pulse oximetry and normoximetry in neonatal intensive care. Respir Care. 1991;36(1):25.
Bohn DJ. Ask the expert. Respiratory Tract. 9, Feb 1988.
Branson RD, Hess DR, Chatburn RL, editors. Respiratory care equipment, ed 2, Philadelphia: Lippincott Williams & Wilkins, 1999.
Burton GC, Hodgkin JE, Ward JJ, editors. Respiratory care: a guide to clinical practice, ed 4, Philadelphia: LippincottRaven, 1997.
Cairo JM, Pilbeam SP. Mosby’s respiratory care equipment, ed 8. St Louis: Mosby, 2010.
Czervinske MP. Arterial blood gas analysis and other cardiopulmonary monitoring. In Koff PB, Daily KE, Schroeder JS, editors: Techniques in bedside hemodynamic monitoring, ed 4, St Louis: Mosby, 1989.
Eitzman D, Neu J. Neonatal and pediatric respiratory care, ed 2. St Louis: Mosby, 1993.
Elser RC. Quality control of blood gas analysis: a review. Respir Care. 1986;31(9):807.
Federal government releases CLIA ‘88 final regulations. AARC Times. 1992;16(4):76.
Fell WL. Sampling and measurement of blood gases. In: Lane EE, Walker JF, editors. Clinical arterial blood gas analysis. St Louis: Mosby, 1987.
Fink JB, Hunt GE, editors. Clinical practice in respiratory care. Philadelphia: Lippincott-Raven, 1999.
Garza D, Becan-McBride K. Phlebotomy handbook, ed 4. Stamford, Conn: Appleton & Lange, 1996.
Instrumentation Laboratories: Operator’s manual for the IL282 CO-oximeter, Lexington, Mass.
Jubran A, Tobin MJ. Reliability of pulse oximetry in titrating supplemental oxygen therapy in ventilator-dependent patients. Chest. 1990;97:1420.
Lane EE, Walker JF. Clinical arterial blood gas analysis. St Louis: Mosby, 1987.
Levitzky MG, Cairo JM, Hall SM. Introduction to respiratory care. Philadelphia: WB Saunders, 1990.
Madama VC. Pulmonary function testing and cardiopulmonary stress testing, ed 2. Albany, NY: Delmar, 1998.
Mahoney JJ, Hodgkin JE, Van Kessel AL. Arterial blood gas analysis. In Burton GG, Hodgkin JE, Ward JJ, editors: Respiratory care: a guide to clinical practice, ed 4, Philadelphia: Lippincott-Raven, 1997.
Malley WJ. Clinical blood gases: assessment and intervention, ed 2. St. Louis: Elsevier Saunders, 2005.
Martin RJ. Transcutaneous monitoring: instrumentation and clinical applications. Respir Care. 1990;35(6):577.
Mathews P, Conway L. Arterial blood gases and noninvasive monitoring of oxygen and carbon dioxide. In: Wyka KA, Mathews PJ, Clark WF, editors. Foundations of respiratory care. Albany, NY: Delmar, 2002.
Mohler JG, Collier CR, Brandt W. Blood gases. In: Clausen JL, editor. Pulmonary function testing guidelines and controversies. Orlando: Grune & Stratton, 1984.
Moran RF. Assessment of quality control of blood gas/pH analyzer performance. Respir Care. 1981;26(6):538.
Moran RF. CLIA regulations. I. The cure might be worse than the disease. AARC Times. 1990;14(11):41.
Moran RF. CLIA regulations. II. An analysis of some technical requirements. AARC Times. 1990;14(12):25.
Nelson CM, Murphy EM, Bradley JK, et al. Clinical use of pulse oximetry to determine oxygen prescriptions for patients with hypoxemia. Respir Care. 1986;31(8):673.
Novametrics Medical Systems: product literature on transcutaneous monitoring, Wallingford, Conn.
Peters JA, Hodgkin JE, Collier CA. Blood gas analysis and acid-base physiology. In Burton GG, Hodgkin JE, Ward JJ, editors: Respiratory care: a guide to clinical practice, ed 3, Philadelphia: JB Lippincott, 1991.
Ruppel G. Manual of pulmonary function testing, ed 9. St Louis: Mosby, 2009.
Salyer JW. Pulse oximetry in the neonatal intensive care unit. Respir Care. 1991;36(1):17.
Walsh B, Czervinske MP, Diblasi RM. Perinatal and pediatric respiratory care, ed 3. St. Louis: Saunders, 2010.
Wilkins RL. Analysis and monitoring of gas exchange. In Wilkins RL, Stoller JK, Kacmarek RM, editors: Egan’s fundamentals of respiratory care, ed 9, St Louis: Mosby, 2009.
Shapiro BA, Kacmarek RM, Cane RD, et al, editors. Clinical application of respiratory care, ed 4, St Louis: Mosby, 1991.
Shapiro BA, Peruzzi WT, Kozlowski-Templin R. Clinical application of blood gases, ed 5. St Louis: Mosby, 1994.
Sonnesso G. Are you ready to use pulse oximetry? Nursing. 1991;21(8):60.
Walton JR, Shapiro BA. Value and application of temperature-compensated blood gas data. Respir Care. 25(2), 1980.
Welch JP, DeCesare R, Hess D. Pulse oximetry: instrumentation and clinical applications. Respir Care. 1990;35(6):584.
Whitaker K. Comprehensive perinatal and pediatric respiratory care, ed 2. Albany, NY: Delmar, 1997.
White GC. Equipment theory for respiratory care, ed 3. Albany, NY: Delmar, 1999.
SELF-STUDY QUESTIONS FOR THE ENTRY LEVEL EXAM See page 583 for answers
 O2, 30 torr
 O2, 75%
Based on the listed conditions, what is the patient’s PAO2 value?
SELF-STUDY QUESTIONS FOR THE WRITTEN REGISTRY EXAM See page 606 for answers
 O2 of 25 torr
 O2 of 80%
[/level-membership-for-pulmolory-and-respiratory-category][not-level-membership-for-pulmolory-and-respiratory-category]
3 Blood Gas Sampling, Analysis, Monitoring, and Interpretation
Note 1: This book is written to cover every item listed as testable on the Entry Level Examination (ELE), Written Registry Examination (WRE), and Clinical Simulation Examination (CSE).
The listed code for each item is taken from the National Board for Respiratory Care’s (NBRC) Summary Content Outline for CRT (Certified Respiratory Therapist) and Written RRT (Registered Respiratory Therapist) Examinations (http://evolve.elsevier.com/Sills/resptherapist/). For example, if an item is testable on both the ELE and the WRE, it will simply be shown as: (Code: …). If an item is only testable on the ELE, it will be shown as: (ELE code: …). If an item is only testable on the WRE, it will be shown as: (WRE code: …).
MODULE A
There are three broad, general indications for this recommendation:
MODULE B
1. Blood gas sampling device selection and preparation
a. Get the appropriate blood gas sampler
d. Use the proper amount of heparin
This is a concern only when liquid heparin is added to a needle and syringe. Aspirate about 1 mL of 10 mg/mL or 1000 units/mL sodium heparin through the needle into the syringe. Pull the plunger back to coat the inside of the syringe. Push the plunger forward to squirt the excess heparin out through the needle. The values of a 2- to 4-mL sample of blood should not be affected by this concentration. Remember that inadequate heparin can cause the blood sample to clot. Excessive heparin can alter the blood gas values by reducing the pH and the carbon dioxide level and increasing the oxygen level.
2. Manipulate arterial catheters by order or protocol (WRE code: IIA20b) [Difficulty: WRE: R, Ap, An]
a. Select the appropriate catheter
An arterial catheter (also called an arterial line) is a flexible catheter that is placed into a peripheral artery for the purposes of sampling blood or continuously monitoring the patient’s blood pressure, or both. The blood-sampling procedure is explained in the following discussion. Chapter 5 contains a discussion on blood pressure monitoring and illustrations of how the monitoring system is assembled. The radial artery is the most common site for catheter insertion. Alternate arterial sites may be used if needed.
A newborn with a severe cardiopulmonary problem should have the catheter inserted into either of the umbilical arteries. Usually, a long, flexible umbilical artery catheter (UAC) is placed into the patient and advanced into the aorta (see Figure 1-7). If indicated, this should be done as quickly as possible after birth, before arterial spasm prevents the catheter from being advanced. If the patient weighs more than 1250 g, a 6-French (6 Fr) catheter is used; a 3.5 Fr catheter is used if the neonate weighs less than 1250 g. Besides obtaining blood samples and monitoring the blood pressure, one can give the newborn glucose or a blood transfusion through the catheter. A neonatal patient also may have the umbilical vein catheterized.
3. Get a blood sample from an arterial catheter (Code: IB9f and IIIE2b) [Difficulty: ELE: R, Ap; WRE: An]
The steps for obtaining an arterial blood sample include the following:
4. Perform an arterial puncture to obtain a blood sample for analysis (Code: IB9f and IIIE2a) [Difficulty: ELE: R, Ap; WRE: An]
1. Radial artery site
See Figure 3-2 for the basic procedure. Circulation to the hand is stopped by pressing both the radial and the ulnar arteries closed. Releasing the pressure over the ulnar artery should result in the hand flushing within 5 to 15 seconds. This is a positive test result and proves that the ulnar artery has adequate circulation to the hand. If the hand does not flush within 15 seconds of the release of the ulnar artery, the circulation is inadequate, and the radial artery of that wrist must not be punctured. Another site must be evaluated for puncture.
2. Dorsalis pedis artery site
Press down on the dorsalis pedis artery to occlude it. Press on the nail of the great toe so that it blanches. Release the pressure on the nail, and watch for a rapid return of color. This normal test finding confirms that a good blood flow exists through the posterior tibial and lateral plantar arteries. It is safe to draw a sample from the site. A slow return of blood flow indicates poor circulation; another site must be chosen.
5. Perform arterialized capillary blood gas sampling (Code: IB9g and IIIE2c) [Difficulty: ELE: R, Ap; WRE: An]
MODULE C
1. Manipulate a point-of-care blood gas analyzer by order or protocol (Code: IIA10) [Difficulty: ELE: R, Ap; WRE: An]
b. Put the equipment together and make sure that it works properly (CSE code: IIA10)
1. pH electrode
The modern pH electrode has existed since the mid-1950s and is usually referred to as the Sanz electrode after its principal inventor. The basic principle behind the pH analyzer is its ability to measure the voltage (potential for electrical flow) between two different solutions. This is based on the different hydrogen ion (H+) concentrations between the solutions that reflect their relative pH values. The reference electrode is immersed in a solution with a pH of 6.840 that fills a glass or plastic chamber. The blood sample, of unknown pH, is placed in a separate measuring chamber called a cuvette. These two chambers are separated by a special glass membrane that contains metals and sodium ions (Na+), thus making it pH sensitive. Both chambers are kept at a stable 37° C temperature. See Figure 3-5 for a graphic representation of the pH electrode. When blood or a quality control (QC) material is introduced into the cuvette, the potential exists for hydrogen ions to replace the sodium ions in the pH-sensitive glass if the two pHs are different. The replacement is proportional to the difference in the two pHs.
2. Pco2 electrode
The partial pressure of carbon dioxide (Pco2) is measured in a modified pH electrode. This was first designed in the mid-1950s by Stow and further perfected by Severinghaus. Accordingly, these units are now referred to as Severinghaus electrodes, or sometimes as Stow-Severinghaus electrodes. In Figure 3-6, the electrode is depicted in cross section. It has a reference half-cell and a measuring half-cell that are enclosed within pH-sensitive glass and electrically connected by an electrolyte contact bridge. The blood sample is introduced into a cuvette heated to 37° C.
3. Po2 electrode
This unit is completely different from the others mentioned. It was developed in the late 1950s by Clark and thus is usually called a Clark electrode. It is also sometimes known as a polarographic electrode because of the basis of its operation. Figure 3-7 is a drawing of key features of the unit. A phosphate-KCl buffer solution surrounds the silver anode. A thin membrane separates the blood-filled cuvette from direct contact with the electrode but allows oxygen molecules to diffuse slowly through to contact the platinum wire cathode. The whole unit is heated to 37° C. The term polarographic comes from the addition of about 0.7 volt to the cathode to make it slightly “polarized” or negative compared with the anode. This is needed to ensure that oxygen is rapidly chemically reduced (that it gains electrons) at the cathode. This creates an electrical current directly proportional to the number of reduced oxygen molecules.
Figure 3-7 Schematic illustration of the Clark electrode for measuring PO2.
(From Harrison BA, Shapiro C: Clinical application of blood gases, ed 4, St Louis, 1989, Mosby.)
It must be understood that the partial pressure of oxygen (Po2) being measured is derived from oxygen that is dissolved in the plasma. It does not come from the hemoglobin found in the erythrocytes (red blood cells). The reported value for the saturation of oxygen in the hemoglobin (Sao2) is calculated by using a mathematical table. Under normal conditions, the calculated Sao2 value is the same as or close to the true Sao2 value. Carbon monoxide (CO) poisoning is the only commonly seen clinical situation during which a calculated saturation can be incorrectly high. If carbon monoxide poisoning is suspected or known, the patient’s blood sample should be analyzed on a CO-oximeter unit.
d. Perform quality control procedures for a blood gas analyzer (Code: IIC1) [Difficulty: ELE: R, Ap; WRE: An]
5. Levey-Jennings charts
An out-of-control situation exists whenever a single calibration value or a series of calibration values is outside established limits. A random error is an unpredictable aberration in precision that occurs when the QC material is sampled. A systematic error shows an accuracy problem and is much more serious. It must be investigated, corrected, and documented. Figure 3-8 shows an example of both random error and systematic error. Rules have been established for determining whether the error is random or systematic (Table 3-1).
TABLE 3-1 Westgard’s Rules for Determining When an Aalyzer Is Not Functioning Properly
| Rule name | Levey-Jennings chart |
|---|---|
| RANDOM ERROR | |
| 1-2 SDs | The measurement is more than 2 SDs but not more than 3 SDs from the mean. |
| 1-3 SDs | The measurement is more than 3 SDs from the mean. |
| R*-4 SDs | Two consecutive measurements are 4 SDs or more apart. |
| SYSTEMATIC ERROR | |
| 2-2 SDs | Two consecutive measurements are either 2 SDs above or 2 SDs below the mean. |
| 4-1 SDs | Four consecutive measurements are either 1 SD above or 1 SD below the mean. |
| 7-trend | Seven consecutive measurements are on only one side of the mean; each measurement is progressively more out of control. |
| 10-mean | Ten consecutive measurements are on only one side of the mean. |
SDs, standard deviations.
Modified from Lane EE, Walker JF: Clinical arterial blood gas analysis, St Louis, 1987, Mosby.
6. pH electrode
a. One-point calibration
7. Pco2 electrode
a. One-point calibration
8. Po2 electrode
a. One-point calibration
c. Three-point calibration
10. Calibration gas cylinders
For economic reasons, the low-percentage oxygen and carbon dioxide gases are placed together in one cylinder, and the high-percentage oxygen and carbon dioxide gases are placed together in a second cylinder. Box 3-1 summarizes the normal precision of the electrodes discussed and the gases used in their calibration. A cylinder containing 100% oxygen and no carbon dioxide can be used for three-point calibration.
e. Perform quality control procedures for a point-of-care blood gas analyzer (Code: IIC3) [Difficulty: ELE: R, Ap; WRE: An]
f. Perform blood gas analysis (Code: IB9j and IIIE3c) [Difficulty: ELE: R, Ap; WRE: An]
1. CO-oximeter/hemoximeter
a. Perform quality control procedures on the CO-oximeter/hemoximeter (Code: IIC1) [Difficulty: ELE: R, Ap; WRE: An].
The unit is preassembled by the manufacturer. Practical experience with a unit is recommended to understand how to add a patient blood sample and perform calibration duties. (See Figure 3-9 for a schematic drawing of a CO-oximeter.) A thallium-neon hollow cathode lamp emits light in the infrared-visible range. A device called a monochromator contains four filters and rotates through the light beam. Each filter allows only one specific wavelength to pass through it. These four monochromatic wavelengths correspond to the three isosbestic points, discussed later (shown in Figure 3-10) and 626.6 nm. This last wavelength is poorly absorbed by all four hemoglobin moieties. It is used to find the maximal difference in absorption so that the relative amounts of the hemoglobin species can be determined.
[/not-level-membership-for-pulmolory-and-respiratory-category]
