[level-membership-for-basic-science-category]
CHAPTER 4 Biophysical Principles*
The concepts in this chapter form the basis for understanding all the molecular interactions in chemistry and biology. To illustrate some of these concepts with a practical example, the chapter concludes with a section on an exceptionally important family of enzymes that bind and hydrolyze the nucleotide GTP. This example provides the background knowledge to understand how GTPases participate in numerous processes covered in later chapters.
The extent of chemical reactions is characterized by the equilibrium constant; the rates of these reactions are described by rate constants. This chapter reviews the physical basis for rate constants and how they are related to the thermodynamic parameter, the equilibrium constant. These simple but powerful principles permit a deeper appreciation of molecular interactions in cells. On the basis of many examples presented in this book, it will become clear to the reader that rate constants are at least as important as equilibrium constants, since the rates of reactions govern the dynamics of the cell. The chapter includes discussion of the chemical bonds important in biochemistry. Box 4-1 lists key terms used in this chapter.
BOX 4-1 Key Biophysical Terms

Reaction rates are expressed as follows:
At equilibrium, the forward rate equals the reverse rate:

and concentrations of reactants Req and products Peq do not change with time.


First-Order Reactions
First-order reactions have one reactant (R) and produce a product (P). The general case is simply

Some common examples of first-order reactions (Fig. 4-1) include conformational changes, such as a change in shape of protein A to shape A*:
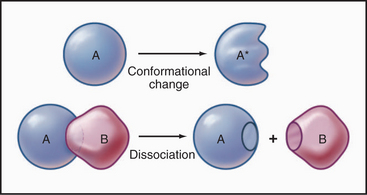

and the dissociation of complexes, such as


A first-order rate constant can be viewed as a probability per unit of time. For a conformational change, it is the probability that any A will change to * in a unit of time. For dissociation of complex AB, the first-order rate constant is determined by the strength of the bonds holding the complex together. This “dissociation rate constant” can be viewed as the probability that the complex will fall apart in a unit of time. The probability of the conformational change of any particular A to * or of the dissociation of any particular AB is independent of its concentration. The concentra-tions of A and AB are important only in determining the rate of the reaction observed in a bulk sample (Box 4-2).
BOX 4-2 Relationship of the Half-Time to a First-Order Rate Constant


where Ro is the initial concentration and Rt is the concentration at time t. Rearranging, we have

When the initial concentration Ro is reduced by half,


To review, the rate of a first-order reaction is simply the product of a constant that is characteristic of the reaction and the concentration of the single reactant. The constant can be calculated from the half-time of a reaction (Box 4-2).
Second-Order Reactions
Second-order reactions have two reactants (Fig. 4-2). The general case is
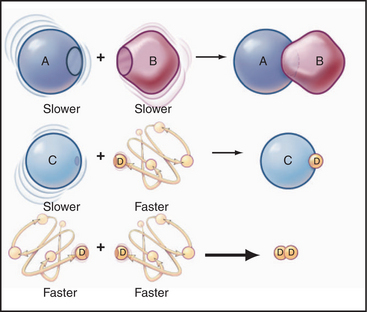
A common example in biology is a bimolecular association reaction, such as


the same as a first-order reaction.
The value of a second-order “association” rate constant, k+, is determined mainly by the rate at which the molecules collide. This collision rate depends on the rate of diffusion of the molecules (Fig. 4-2), which is determined by the size and shape of the molecule, the viscosity of the medium, and the temperature. These factors are summarized in a parameter called the diffusion coefficient, D, with units of m2 s−1. D is a measure of how fast a molecule moves in a given medium. The rate constant for collisions is described by the Debye-Smoluchowski equation, a relationship that depends only on the diffusion coefficients and the area of interaction between the molecules:

Reversible Reactions


The overall rate of the reaction is the forward rate minus the reverse rate:
At equilibrium, the forward and reverse rates are (by definition) the same:

The equilibrium constant for such a bimolecular reaction can be written in two ways:
When half of the total A is bound to B, the concentration of free B is simply equal to the dissociation equilibrium constant.
Thermodynamic Considerations


Substituting the definition of δG0, we have


It is sometimes said that a reaction with a positive δG0 will not proceed spontaneously. This is not strictly true. Reactants will still be converted to products, although relative to the concentration of reactants, the concentration of products will be small. The size and sign of the free energy change tell nothing about the rate of a reaction. For example, the oxidation of sucrose by oxygen is highly favored with a δG0 of −5693 kJ/mol, but “a flash fire in a sugar bowl is an event rarely, if ever, seen.”*

The change in entropy, expressed as δS is a measure of the change in the order of the products and reactants. The value of the entropy is a function of the number of microscopic arrangements of the system, including the solvent molecules. Note the minus sign in front of the TδS term. Reactions are favored if the change in entropy is positive, that is, if the products are less well ordered than the reactants. Increases in entropy drive reactions by increasing the negative free energy change. For example, the hydrophobic effect, which is discussed later in this chapter, depends on an increase in entropy. Increases in entropy provide the free energy change for many biologic reactions, especially macromolecular folding (see Chapters 3 and 17) and assembly (see Chapter 5).
Linked Reactions
Many important processes in the cell consist of a single reaction, but most of cellular biochemistry involves a series of linked reactions (Fig. 4-3). For example, when two macromolecules bind together, the complex often undergoes some type of internal rearrangement or conformational change, linking a first-order reaction to a second-order reaction.
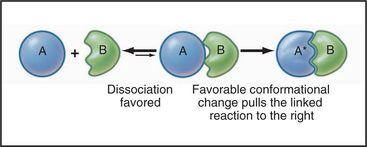

One of thousands of such examples is GTP binding to a G protein, causing it to undergo a conformational change from the inactive to the active state (Figs. 4-6 and 4-7 ahead).

Linking reactions together is the secret of how the cell carries out unfavorable reactions. All that matters is that the total free energy change for all coupled reactions is negative. An unfavorable reaction is driven forward by a favorable reaction upstream or downstream. For example, the unfavorable reaction producing adenosine triphosphate (ATP) from adenosine diphosphate (ADP) and inorganic phosphate is driven by being coupled to an energy source in the form of a proton gradient across the mitochondrial membrane (see Fig. 8-5). This proton gradient is derived, in turn, from the oxidation of chemical bonds of nutrients. To use a macroscopic analogy, a siphon can initially move a liquid uphill against gravity provided that the outflow is placed below the inflow, so that the overall change in energy is favorable.
An appreciation of linked reactions makes it possible to understand how catalysts, including biochemical catalysts—protein enzymes and ribozymes—influence reactions. They do not alter the free energy change for reactions, but they enhance the rates of reactions by speeding up the forward and reverse rates of unfavorable intermediate reactions along pathways of coupled reactions. Given that the rates of both first- and second-order reactions depend on the concentrations of the reactants, the overall reaction is commonly limited by the concentration of the least favored, highest-energy intermediate, called a transition state. This might be a strained conformation of substrate in a biochemical pathway. Interaction of this transition state with an enzyme can lower its free energy, increasing its probability (concentration) and thus the rate of the limiting reaction. Acceleration of biochemical reactions by enzymes is impressive. Enhancement of reaction rates by 10 orders of magnitude is common.
Chemical Bonds
Covalent bonds are responsible for the stable architecture of the organic molecules in cells (Fig. 4-4). They are very strong. C—C and C—H bonds have energies of about 400 kJ mol−1. Bonds this strong do not dissociate spontaneously at body temperatures and pressures, nor are the reactive intermediates required to form these bonds present in finite concentrations in cells. To overcome this problem, living systems use enzymes, which stabilize high-energy transition states, to catalyze formation and dissolution of covalent bonds. Energy for making strong covalent bonds is obtained indirectly by coupling to energy-yielding reactions. For example, metabolic enzymes convert energy released by breaking covalent bonds of nutrients, such as carbohydrates, lipids, and proteins, into ATP (see Fig. 19-4), which supplies energy required to form new covalent bonds during the synthesis of polypeptides. Metabolic pathways relating the covalent chemistry of the molecules of life are covered in depth in many excellent biochemistry books.
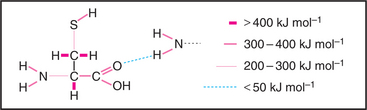
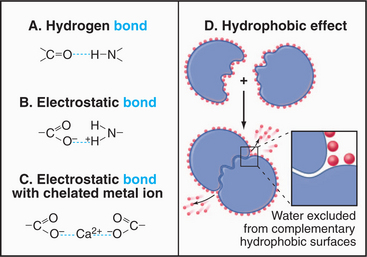
For cell biologists, four types of relatively weak interactions (Fig. 4-5) are as important as covalent bonds because they are responsible for folding macromolecules into their active conformations and for holding molecules together in the structures of the cell. These weak interactions are (1) hydrogen bonds, (2) electrostatic interactions, (3) the hydrophobic effect, and (4) van der Waals interactions. None of these interactions is particularly strong on its own. Stable bonding between subunits of many macromolecular structures, between ligands and receptors, and between substrates and enzymes is a result of the additive effect of many weak interactions working in concert.
Hydrogen and Electrostatic Bonds
Hydrogen bonds (Fig. 4-5) occur between a covalently bound donor H atom with a partial positive charge, δ+ (due to electron withdrawal by a covalently bonded O or N), and an acceptor atom (usually O or N) with a partial negative charge, δ−. These bonds are highly directional, with optimal bond energy (12 to 29 kJ mol−1) when the H atom points directly at the acceptor atom. Hydrogen bonds are extremely important in the stabilization of secondary structures of proteins, such as α-helices and β-sheets (see Fig. 3-8) and in the base pairing of DNA and RNA (see Fig. 3-14).
Electrostatic (or ionic) bonds occur between charged groups that have either lost or gained a proton (e.g., —COO− and —NH3+). Although these bonds are potentially about as strong as an average hydrogen bond (20 kJ mol−1), it has been argued that they contribute little to biological structure. This is because a charged group is usually neutralized by an inorganic counterion (such as Na+ or Cl−) that is itself surrounded by a cloud of water molecules. The effect of having the cloud of water molecules is that the counterion does not occupy a single position with respect to the charged group on the macromolecule; so these interactions lack structural specificity.
The Hydrophobic Effect
How can association of molecules lead to increased disorder? The answer is that the entropy of the system—including macromolecules and solvent—increases ow-ing to the loss of order in the water surrounding the mac-romolecules (Fig. 4-5). This increase in the entropy of the water more than offsets the increased order and decreased entropy of the associated macromolecules. Bulk water is a semistructured solvent maintained by a loose network of hydrogen bonds (see Fig. 3-1). Water cannot form hydrogen bonds with nonpolar (hydrophobic) parts of lipids and proteins. Instead, water molecules form “cages” or “clathrates” of extensively H-bonded water molecules near these hydrophobic surfaces. These clathrates are more ordered than is bulk water or water interacting with charged or polar amino acids.
When proteins fold (see Fig. 17-12), macromolecules bind together (see Chapter 5), and phospholipids associate to form bilayers (see Fig. 7-5), hydrophobic groups are buried in pockets or between interfaces that exclude water. The highly ordered water formerly associated with these surfaces disperses into the less ordered bulk phase, and the entropy of the system increases.
Analysis of an Enzyme Mechanism: The Ras GTPase
This section uses a vitally important family of enzymes called GTPases to illustrate how enzymes work. The example is Ras, a small GTPase that serves as part of a biochemical pathway linking growth factor receptors in the plasma membrane of animal cells to regulation of the cell cycle. The example shows how to dissect an enzyme reaction by kinetic analysis and how crystal structures can reveal conformational changes related to function. GTPases related to Ras regulate a host of systems (see Table 25-3) including nuclear transport (see Fig. 14-17), protein synthesis (see Figs. 17-9 and 17-10), vesicular trafficking (see Fig. 21-6), signaling pathways coupled to seven-helix receptors including vision and olfaction (see Figs. 25-8 and 25-9), the actin cytoskeleton (see Figs. 33-17 and 33-20), and assembly of the mitotic spindle (see Fig. 44-8). This section gives the reader the background required to understand the contributions of GTPases to all of these processes as they are presented in the following sections of the book.
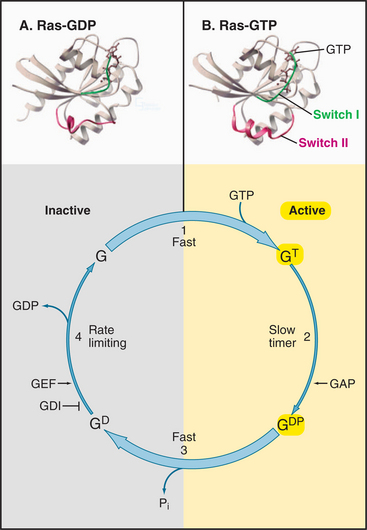
Having evolved from a common ancestor, Ras and its related GTPases share a homologous core domain that binds a guanine nucleotide and use a common enzymatic cycle of GTP binding, hydrolysis, and product dissociation to switch the protein on and off (Fig. 4-6). The GTP-binding domain consists of about 200 residues folded into a six-stranded β-sheet sandwiched between five α-helices. GTP binds in a shallow groove formed largely by loops at the ends of elements of secondary structure. A network of hydrogen bonds between the protein and guanine base, ribose, triphosphate, and Mg2+ anchor the nucleotide. Larger GTPases have a core GTPase domain plus domains required for coupling to seven-helix receptors (see Fig. 25-9) or regulating protein synthesis (see Figs. 17-10 and 25-7).
The bound nucleotide determines the conformation and activity of each GTPase. The GTP-bound conformation is active, as it interacts with and stimulates effector proteins. In the example considered here, the Ras-GTP binds and stimulates a protein kinase, Raf, which relays signals from growth factor receptors to the nucleus (see Fig. 27-6). The GDP-bound conformation of Ras is inactive because it does not bind effectors. Thus, GTP hydrolysis and phosphate dissociation switch Ras and related GTPases from the active to the inactive state.
All GTPases use the same enzyme cycle, which involves four simple steps (Fig. 4-6). GTP binding favors the active conformation that binds effector proteins. GTPases remain active until they hydrolyze the bound GTP. Hydrolysis is intrinsically slow, but binding to effector proteins or regulatory proteins can accelerate this inactivation step. GTPases tend to accumulate in the inactive GDP state, because GDP dissociation is very slow. Specific proteins catalyze dissociation of GDP, making it possible for GTP to rebind and activate the GTPase. Seven-helix receptors activate their associat-ed γ-proteins. Guanine nucleotide exchange proteins (GEFs) activate small GTPases.
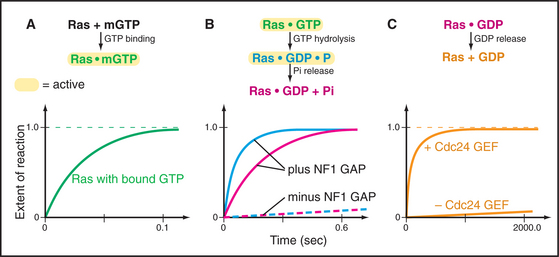
Figure 4-7 illustrates the experimental strategy used to establish the mechanism of the Ras GTPase cycle.
Step 3: Dissociation of inorganic phosphate.
Ras and most other small GTPases depend on regulatory proteins to stimulate the two slow steps in the GTPase cycle: GDP dissociation and GTP hydrolysis. For example, when growth factors stimulate their receptors, a series of reactions (see Fig. 27-6) brings a guanine nucleotide exchange factor (GEF) to the plasma membrane to activate Ras by accelerating dissociation of GDP. First the GEF binds Ras-GDP and then favors a slow conformational change that distorts a part of Ras that interacts with the β-phosphate. This allows GDP to dissociate on a time scale of seconds to minutes rather than 10 hours (Fig. 4-7C). Once GDP has dissociated, nucleotide-free Ras can bind either GDP or GTP. Binding GTP is more likely in cells, because the cytoplasmic concentration of GTP (about 1 mM) is 10 times that of GDP. GTP binding activates Ras, allowing transmission of the signal to the nucleus.
GTPase-activating proteins (GAPs) turn off Ras and related GTPases, by binding Ras-GTP and stimulating GTP hydrolysis, thereby terminating GTPase activation (Fig. 4-7B). Ras GAPs stabilize the transition state, by contributing a positively charged arginine side chain that stabilizes the negative charges on the oxygen bridging the β- and γ-phosphates and on the γ-phosphate. GAPs also help to position Gln61 and its attacking water. In the experiment in the figure, a GAP called neurofibromin (NF1) binds Ras with a half-time of 3 ms (not illustrated) and stimulates rapid hydrolysis of GTP at 20 s−1. This is followed by rate-limiting dissociation of γ-phosphate from the Ras-GDP-P intermediate at 8 s−1 and rapid dissociation of NF1 from Ras at 50 s−1. NF1 is the product of a human gene that is inactivated in the disease called neurofibromatosis. Lacking the NF1 GAP activity to keep Ras in check, affected individuals develop numerous neural tumors that disfigure the skin and may compromise the function of the nervous system.
Berg OG, von Hippel PH. Diffusion controlled macromolecular interactions. Annu Rev Biophys. 1985;14:131-160.
Eisenberg D, Crothers D. Physical Chemistry with Applications to the Life Sciences. Menlo Park, Calif: Benjamin Cummings Publishing, 1979.
Garcia-Viloca M, Gao J, Karplus M, Truhlar DG. How enzymes work: Analysis by modern rate theory and computer simulations. Science. 2004;303:186-194.
Herrmann C. Ras-effector interactions: After one decade. Curr Opin Struct Biol. 2003;13:122-129.
Johnson KA. Transient-state kinetic analysis of enzyme reaction pathways. Enzymes. 1992;20:1-61.
Lenzen C, Cool RH, Prinz H, et al. Kinetic analysis by fluorescence of the interaction between Ras and the catalytic domain of the guanine nucleotide exchange factor CdcMn. Biochemistry. 1998;37:7420-7430.
Northrup SH, Erickson HP. Kinetics of protein-protein association explained by Brownian dynamics computer simulation. Proc Natl Acad Sci U S A. 1992;89:3338-3342.
Phillips RA, Hunter JL, Eccleston JF, Webb MR. Mechanism of Ras GTPase activation by neurofibromin. Biochemistry. 2003;42:3956-3965.
Wachsstock DH, Pollard TD. Transient state kinetics tutorial using KINSIM. Biophys J. 1994;67:1260-1273.
* This chapter is adapted in part from Wachsstock DH, Pollard TD: Transient state kinetics tutorial using KINSIM. Biophys J 67:1260–1273, 1994.
* Eisenberg D, Crothers D: Physical Chemistry with Applications to the Life Sciences. Menlo Park, Calif: Benjamin Cummings Publishing, 1979.
[/level-membership-for-basic-science-category][not-level-membership-for-basic-science-category]
CHAPTER 4 Biophysical Principles*
The concepts in this chapter form the basis for understanding all the molecular interactions in chemistry and biology. To illustrate some of these concepts with a practical example, the chapter concludes with a section on an exceptionally important family of enzymes that bind and hydrolyze the nucleotide GTP. This example provides the background knowledge to understand how GTPases participate in numerous processes covered in later chapters.
The extent of chemical reactions is characterized by the equilibrium constant; the rates of these reactions are described by rate constants. This chapter reviews the physical basis for rate constants and how they are related to the thermodynamic parameter, the equilibrium constant. These simple but powerful principles permit a deeper appreciation of molecular interactions in cells. On the basis of many examples presented in this book, it will become clear to the reader that rate constants are at least as important as equilibrium constants, since the rates of reactions govern the dynamics of the cell. The chapter includes discussion of the chemical bonds important in biochemistry. Box 4-1 lists key terms used in this chapter.
BOX 4-1 Key Biophysical Terms
Reaction rates are expressed as follows:
At equilibrium, the forward rate equals the reverse rate:
and concentrations of reactants Req and products Peq do not change with time.
First-Order Reactions
First-order reactions have one reactant (R) and produce a product (P). The general case is simply
Some common examples of first-order reactions (Fig. 4-1) include conformational changes, such as a change in shape of protein A to shape A*:
and the dissociation of complexes, such as
A first-order rate constant can be viewed as a probability per unit of time. For a conformational change, it is the probability that any A will change to * in a unit of time. For dissociation of complex AB, the first-order rate constant is determined by the strength of the bonds holding the complex together. This “dissociation rate constant” can be viewed as the probability that the complex will fall apart in a unit of time. The probability of the conformational change of any particular A to * or of the dissociation of any particular AB is independent of its concentration. The concentra-tions of A and AB are important only in determining the rate of the reaction observed in a bulk sample (Box 4-2).
BOX 4-2 Relationship of the Half-Time to a First-Order Rate Constant
where Ro is the initial concentration and Rt is the concentration at time t. Rearranging, we have
When the initial concentration Ro is reduced by half,
To review, the rate of a first-order reaction is simply the product of a constant that is characteristic of the reaction and the concentration of the single reactant. The constant can be calculated from the half-time of a reaction (Box 4-2).
Second-Order Reactions
Second-order reactions have two reactants (Fig. 4-2). The general case is
A common example in biology is a bimolecular association reaction, such as
the same as a first-order reaction.
The value of a second-order “association” rate constant, k+, is determined mainly by the rate at which the molecules collide. This collision rate depends on the rate of diffusion of the molecules (Fig. 4-2), which is determined by the size and shape of the molecule, the viscosity of the medium, and the temperature. These factors are summarized in a parameter called the diffusion coefficient, D, with units of m2 s−1. D is a measure of how fast a molecule moves in a given medium. The rate constant for collisions is described by the Debye-Smoluchowski equation, a relationship that depends only on the diffusion coefficients and the area of interaction between the molecules:
