[level-membership-for-critical-care-medicine-category]83
Bedside Ultrasonography in the Critical Care Patient

Lung Ultrasonography
Lung ultrasonography is a valuable tool in the assessment of critically ill patients. The diagnostic accuracy of using ultrasound in the lung to establish the presence of pneumothorax, pleural effusion, lung consolidation, and alveolar-interstitial syndrome has been well established.1 Lung ultrasonography can be rapidly performed at the bedside and has been shown to significantly aid in the management of critical patients.2 Lung computed tomography (CT) remains the gold standard for thoracic imaging in the critical care setting, despite its major drawbacks (radiation, cost, transportation), even though portable chest radiography is the most common diagnostic imaging modality.2–4 Although portable chest radiographs are routinely performed in the ICU, multiple studies have shown limited diagnostic accuracy, with the elimination of routine chest radiographs having no adverse effect on length of stay, readmission, and mortality rates.5–7 Routine use of bedside lung ultrasound in the ICU has been shown to significantly reduce the number of both chest radiographs and CT scans obtained.8
Technique and Equipment
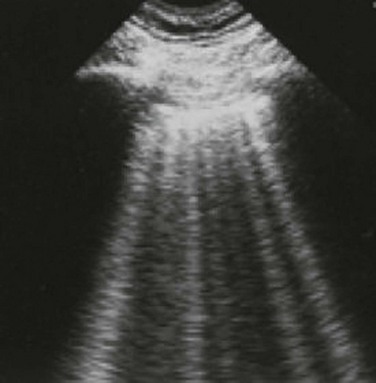
In normal lung, ultrasound waves are reflected off gas-filled structures, limiting the visualization of lung structures beyond the pleura.1 The diagnosis of lung disease by ultrasound largely relies on the detection of ultrasound artifacts. To examine the thorax, a high-frequency linear transducer (5-12 MHz) is best used to visualize the relatively superficial pleural line. Lower frequency microconvex and convex transducers (2-5 MHz) can be used to scan the deeper lung parenchyma.9 Supine positioning is most commonly utilized in the ICU, and lateral decubitus positioning may assist in the visualization of the dorsal aspects of the lower lobes. To perform lung ultrasonography the transducer should be placed in a longitudinal axis, between two ribs. In this view the pleural interface can be seen as a hyperechoic horizontal line approximately 0.5 cm deep, relative to the anterior border of the ribs1,10 (Fig. 83.1). This image of the ribs and pleural line is the basic landmark in lung sonography and is often referred to as the bat sign.10,11
Pneumothorax
Pneumothorax, defined as a collection of air between the visceral and parietal pleural layers, has a frequency of approximately 6% in the ICU setting.12 Although screening for pneumothorax with supine anteroposterior (AP) chest radiography is still common in the critical care setting, sensitivities for the diagnosis of pneumothorax average 50%.13 The sensitivity for diagnosis of pneumothorax by lung ultrasound has been shown to be greater than 95% in multiple large prospective studies.14 Moreover, lung ultrasound for pneumothorax can be completed in an average of 2 to 3 minutes, significantly faster than obtaining a portable chest radiograph or transport to CT scan.15 The examination should begin with the transducer placed longitudinally at the midclavicular line at the level of the second to third intercostal space. Sequential movement of the transducer inferior and lateral across multiple rib interspaces will allow for a comprehensive examination of the pleura.9 This approach should then be repeated on the opposite hemithorax.
Focusing on the pleural line in real time, a sliding type of motion of the visceral and parietal pleura can be observed. This dynamic motion is termed lung sliding, and can be seen in normal lung ultrasound ( Video 83.1). In the presence of a pneumothorax, air is trapped between the visceral and parietal pleural layers and the dynamic motion of lung sliding will not be detected (
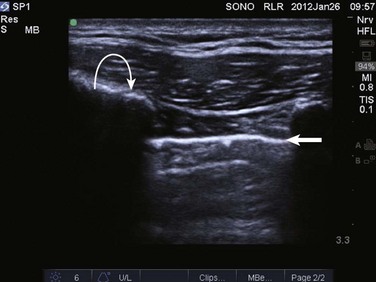
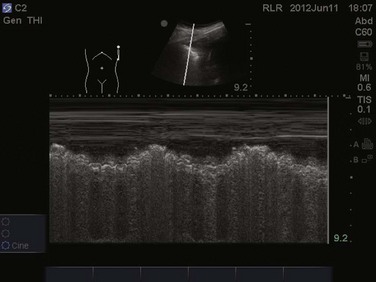
 Video 83.2). The presence of lung sliding alone has a 100% negative predictive value in the diagnosis of pneumothorax.16 However, the absence of lung sliding does not rule in the diagnosis of pneumothorax. A number of conditions can result in the absence of lung sliding such as massive atelectasis, acute respiratory distress syndrome (ARDS), pleural adhesions, and severe fibrosis.9,10 M-mode and power Doppler may be useful when lung sliding is difficult to visualize on real-time B-mode imaging. M-mode analysis of normal lung tissue displays the “seashore sign,” a characteristic linear wave pattern representing the motionless chest wall, and below the pleural line a granular pattern represents normal lung motion17 (Fig. 83.2). M-mode analysis of a pneumothorax demonstrates the “stratosphere sign,” a characteristic appearance of exclusively linear lines10 (Fig. 83.3). Power Doppler will depict motion along the pleural interface, corresponding to normal lung sliding (Fig. 83.4). In the presence of a pneumothorax, no Doppler signal will be detected along the pleural surface. The visualization of the lung point may also be used in the diagnosis of pneumothorax, having a specificity of 100%. The lung point represents the area on the chest wall where normal lung sliding is again appreciated, corresponding to the lateral edge of the pneumothorax (Fig. 83.5). This confirms the absence of visualization of lung sliding was not due to technical errors in lung ultrasound, but rather the presence of pneumothorax.10
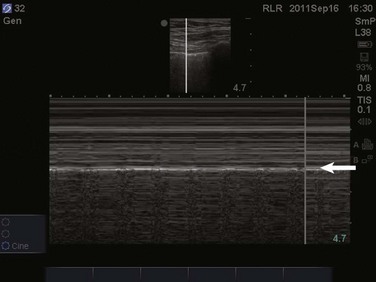
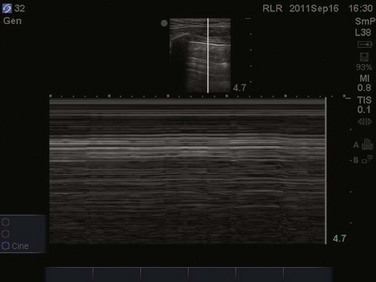
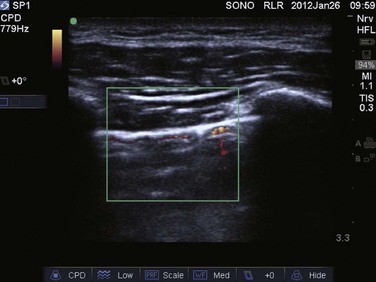
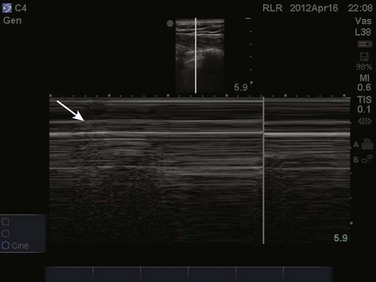
Figure 83.5 M-mode ultrasound imaging of the lung point, correlating with the lateral edge of the pneumothorax.
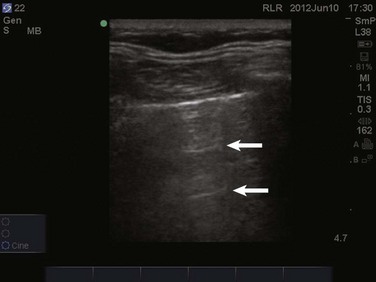
Two linear artifacts arising from the pleural line are key to the evaluation of pneumothorax by lung ultrasound, A and B lines. A lines are a reverberation artifact of the parietal pleura, represented as horizontal lines in a repetitive pattern (Fig. 83.6). B lines, or comet tails, are described as vertical lines extending the length of the screen, which erase A lines and move with lung sliding12 (Fig. 83.7). In lung ultrasound, the appreciation of only one B line indicates normal apposition of the parietal and visceral pleura and rules out pneumothorax at that location.9 Because A lines arise from the parietal pleura, their presence can be appreciated in both normal lung and pneumothorax. The absence of lung sliding with the presence of A lines has a sensitivity of 95% and specificity of 94% in the diagnosis of pneumothorax.12
Lung Consolidation
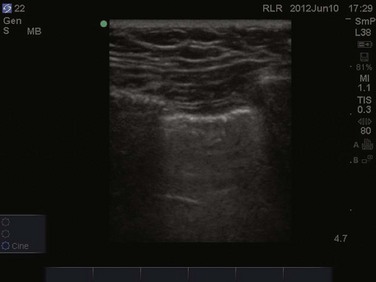
Alveolar consolidation, seen in pulmonary edema, bronchopneumonia, lung contusion, and lobar atelectasis, results in the loss of lung aeration replaced by fluid, allowing for ultrasound transmission and imaging.1 As the ratio of lung tissue to air increases, lung hepatization appears on ultrasound imaging, with the lung parenchyma taking a hepatic tissue-like appearance3 (Fig. 83.8). Consolidated lung adjacent to the pleura will permit the transmission of ultrasound waves. A prospective clinical study in a medical ICU setting showed that 98% of alveolar consolidations abutted the pleura, allowing for ultrasound assessment. The deep border of alveolar consolidations will typically have an irregular appearance, sometimes referred to as the shred sign, unless the entire lobe is involved.10 Using CT as the gold standard, ultrasound has a 90% sensitivity and 98% specificity in the diagnosis of alveolar consolidation.18 Air bronchograms can be visualized within consolidated lung as bright highly reflective echogenic lines.21 Dynamic air bronchograms move centrifugally during inspiration and can typically be seen in pneumonia, as opposed to static air bronchograms of atelectasis.19
Alveolar-Interstitial Syndrome
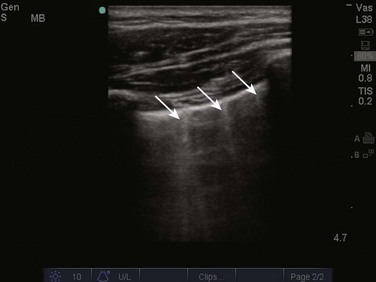
Alveolar-interstitial syndrome is a common entity in the ICU, caused acutely by a variety of conditions, including ARDS, acute pulmonary edema, and interstitial pneumonia.20 Interstitial edema precedes alveolar edema and may be difficult to discern on chest radiograph. Interstitial edema can be visualized on lung ultrasound by demonstrating three or more B lines located between two ribs, defined as lung rockets21 (Fig. 83.9 and  Video 83.3). B lines 7 mm apart correspond to thickened interlobular septa and extravascular lung volume, but B lines 3 mm apart or less correspond to alveolar edema and a ground-glass appearance of the lung.22 In an acutely dyspneic patient, the detection of lung rockets allows the intensivist to immediately differentiate acute pulmonary edema from chronic obstructive pulmonary disease (COPD). Lung rockets are also unusual in the presence of pulmonary embolism.10 It is important to remember that B lines may be isolated or confined laterally in the last intercostal space in normal healthy lung.23
Pleural Effusion
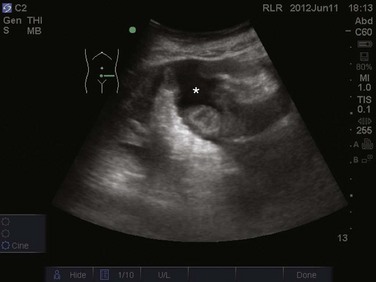
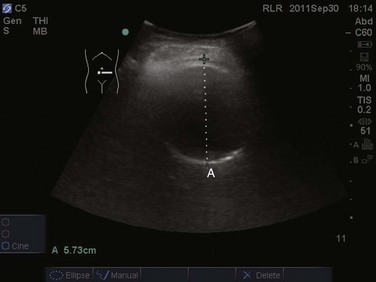
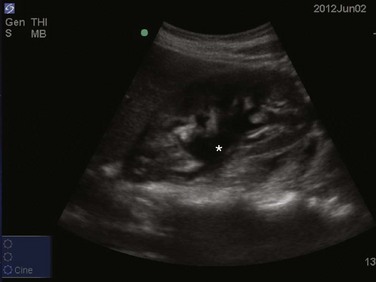
The prevalence of pleural effusion is approximately 60% in the ICU setting.24 Pleural effusion may arise from a variety of conditions, most commonly heart failure, atelectasis, pneumonia, and volume overload. Portable supine chest radiography has poor sensitivity and specificity in the diagnosis of a pleural effusion, but lung ultrasound outperforms both chect radiography and clinical examination. Lung ultrasound can help differentiate pleural effusions from infiltrate or atelectasis, with a sensitivity of 92% and specificity of 93%.22 Pleural effusions appear as an anechoic area in dependent lung regions (Figs. 83.10 and 83.11). Transudative fluid appears echo-free, and exudative fluid may contain small echogenic debris. In intercostal imaging, pleural effusions will be bordered laterally by rib shadows, superiorly by the parietal pleural line, and inferiorly by the lung line. M-mode analysis demonstrates a decrease in the interpleural distance with inspiration, known as the sinusoid sign10 (Fig. 83.12). Lung ultrasound can also help estimate volume of pleural fluid. An anteroposterior diameter greater than 5 cm measured at the lung base or fifth intercostal space predicts a pleural effusion fluid volume of greater than 500 mL.25
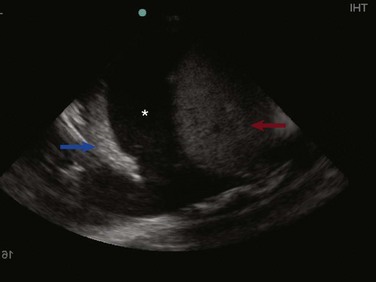
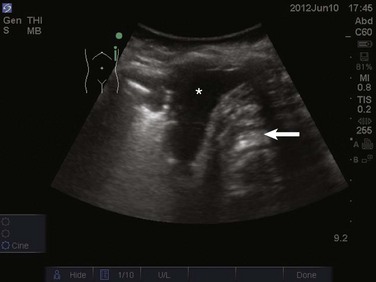
Figure 83.11 Left-sided pleural effusion (star).
Thoracentesis
The utilization of ultrasound to determine needle placement in thoracentesis has been shown in multiple studies to significantly decrease complication rates, especially that of pneumothorax.26–28 Localization of fluid above the diaphragm should be the first objective, avoiding mistaking peritoneal for pleural fluid.28 Once pleural fluid is visualized, the transducer should be moved one interspace above and below to evaluate the extent of the effusion.29 The chest should be scanned in both the longitudinal and cross-sectional plane and the positions of the heart, diaphragm, and liver/spleen determined. Next, an interpleural measurement (parietal pleura to visceral pleura) of at least 1.5 cm during inspiration should be obtained to allow for safe needle puncture. The potential site of needle puncture should be observed throughout the entire respiratory cycle to evaluate for the appearance of lung, heart, liver, or spleen in the projected needle path.28 After a safe site has been identified, the skin should be marked and disinfected. It is essential the patient remain in the same position as when the ultrasonography was performed.30 Real-time guidance is not necessary for needle puncture, but needle insertion should occur within minutes of ultrasound marking.31
Abdominal Ultrasonography
Paracentesis
Paracentesis is a commonly performed procedure in the critical care setting. Bedside ultrasonography prior to every paracentesis improves both the safety and efficacy of this procedure.32,33 An emergency department study comparing ultrasound-assisted paracentesis versus traditional blind technique showed a 95% success rate with ultrasound guidance versus only 61% with the traditional technique. Moreover, 25% of patients randomized to the ultrasound-assisted technique completely avoided the procedure due to either the absence of ascitic fluid or too little ascitic fluid for aspiration. Two more patients in this group did not receive paracentesis after performance of bedside ultrasound, which revealed a large cystic mass in the left lower quadrant of one patient and a ventral hernia in the other, both of which were mistaken for ascitic fluid and in which performance of paracentesis would have been potentially disastrous.33
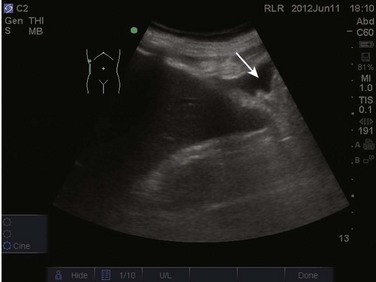
A low-frequency curved array transducer is preferred. As with the traditional blind technique, the urinary bladder should be decompressed and the patient should be lying supine. Ascites will appear as anechoic fluid within the peritoneal cavity and often loops of bowel will be seen floating within this fluid (Fig. 83.13). Ultrasonographic guidance assists in determining the amount and location of ascitic fluid while mapping the most appropriate point of entry and puncture angle. Measurement of abdominal wall thickness can be performed to determine puncture depth. The location of the urinary bladder, bowel, solid organs, and abdominal wall vasculature may all be visualized for avoidance. Such intra-abdominal structures should be visualized in real time throughout the respiratory cycle to ensure they do not cross into the anticipated needle path. Once an appropriate fluid pocket has been determined, it should be visualized in at least two perpendicular planes to ensure avoidance of critical structures. An estimate of the abdominal wall thickness should be made, as well as the depth of the fluid pocket until critical structures such as bowel or bladder are encountered. Once the site has been mapped and marked, needle puncture may occur. Paracentesis involving small volumes may be better performed with real-time ultrasound guidance, allowing direct visualization of the needle entering the peritoneal space. Most larger volume paracentesis may be performed with mapping of the puncture site and needle with ultrasound guidance, although the actual needle puncture occurs without real-time ultrasound visualization.
The “FAST” Examination
The focused assessment with sonography for trauma (FAST) examination has been used by trauma surgeons for decades to identify intra-abdominal fluid.34 The identification of free fluid—hemoperitoneum or ascites—in the abdomen may also be essential in the critical care setting. Localization of ascitic fluid for paracentesis and hemoperitoneum in the setting of persistent or undifferentiated hypotension may prove beneficial in the ICU.
The FAST examination is based on the principle that in a supine patient, free intraperitoneal fluid will accumulate in the most dependent regions of the peritoneal cavity. The most dependent areas in the male and female are the rectovesical pouch and pouch of Douglas, respectively. Free intraperitoneal fluid in the right upper quadrant will accumulate in Morison’s pouch, but fluid in the left upper quadrant will accumulate in the left subphrenic space and splenorenal recess. A prospective study that compared diagnostic peritoneal lavage, CT scanning, and abdominal ultrasound showed an accuracy of 93% for abdominal ultrasound.35 Moreover, the time required to perform such an examination averages less than 3 minutes.36
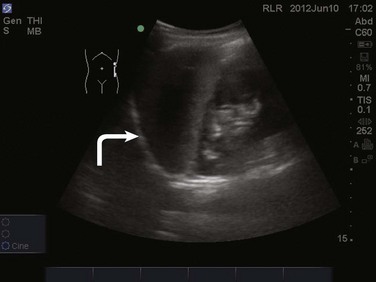
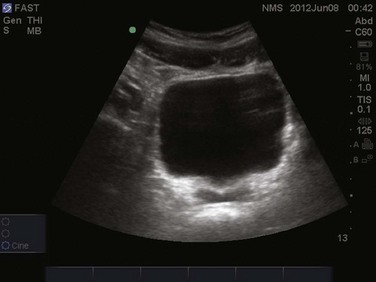
The FAST examination is performed with either the low-frequency phased array or curvilinear probe. The basic views of the intra-abdominal assessment of the FAST examination include Morison’s pouch, left lateral longitudinal, and pelvic views.34 Starting with Morison’s pouch, in the supine patient, the probe is placed in the right midaxillary line at the level of the lower ribs. The right hemidiaphragm, liver, and right kidney should be visualized (Figs. 83.14 and 83.15). Free fluid in Morison’s pouch will be appreciated as an anechoic area (Fig. 83.16). Massive hemoperitoneum may be rapidly diagnosed with this single view with a sensitivity of 82% and accuracy of 91%.37 Next, the left side is evaluated by placing the probe in the posterior axillary line at the level of the lower ribs. The left hemidiaphragm, spleen, and left kidney can all be identified from this view (Fig. 83.17). Free fluid can be appreciated as an anechoic stripe in the subphrenic space and splenorenal recess. Lastly, the pelvic view is obtained by placing the probe in a midline transverse position just above the pubic symphysis. A fluid-filled urinary bladder appears as well-circumscribed anechoic fluid with posterior acoustic enhancement (Fig. 83.18). A longitudinal view can also be obtained by rotating the probe 90 degrees clockwise. In female patients, the uterus may be seen posterior to the urinary bladder and free fluid may be appreciated in the pouch of Douglas. In male patients, the prostate may be seen posterior to the urinary bladder and free fluid may be appreciated in the rectovesical pouch. The FAST examination does have its limitations, with the patient’s body habitus greatly affecting the quality of the images obtained. Moreover, ultrasound is capable of identifying free fluid in the abdomen, but it cannot accurately distinguish ascites from hemoperitoneum. Last, ultrasound is not sensitive for the identification of free fluid in the retroperitoneum.
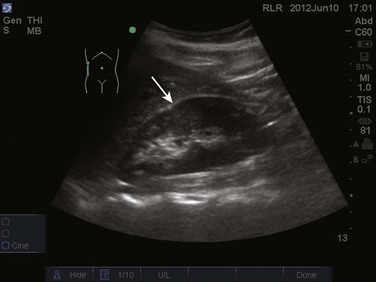
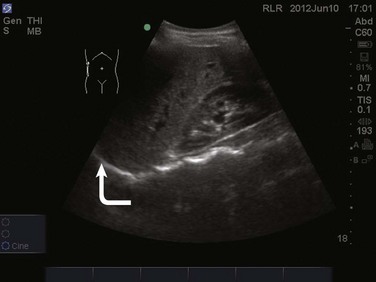
Figure 83.15 Visualization of the right hemidiaphragm (curved arrow), seen as a hyperechoic line located cranial to the liver.
Abdominal Aorta
The abdominal aorta may also be imaged by ultrasonography to diagnose both an abdominal aortic aneurysm (AAA) and dissection. Unexplained hypotension, syncope, dizziness, or cardiac arrest may be caused by a ruptured aneurysm. The prevalence of AAAs is relatively common, ranging from 2% to 5% in adults over the age of 50.38–42 Bedside ultrasonography in the detection of AAA is highly sensitive, specific, and accurate.43,44
The abdominal aorta extends from the level of the diaphragm at approximately the twelfth thoracic vertebra down to its bifurcation into the common iliac arteries around the level of the umbilicus. The aorta can be best visualized with a curvilinear probe, either longitudinal or transverse. Generally the patient will be positioned supine, but if obesity or bowel gas obstructs the images, the patient may be moved into a decubitus position. Starting transverse in the epigastrium with the probe marker to the patient’s right, the abdominal aorta is seen lying superiorly and slightly to the left of the patient’s spine. The vertebral body appears as a bright hyperechoic structure with posterior shadowing (Fig. 83.19). The most proximal branch seen on ultrasound is the celiac trunk branching off anteriorly, followed by the superior mesenteric artery (SMA) approximately 1 to 2 cm distally ( Video 83.4). Continuing caudally, the renal arteries can be appreciated branching off laterally just distal to the SMA. The inferior mesenteric artery and paired gonadal arteries may be difficult to image on bedside ultrasonography. The inferior vena cava (IVC) should also be appreciated coursing to the right of the aorta (Fig. 83.20). Turning the probe 90 degrees clockwise allows the aorta to be viewed in the longitudinal plane (Fig. 83.21). Often, the celiac trunk and SMA can be visualized branching from the anterior aspect of the aorta (see Video 83.4). Tilting the probe slightly to the patient’s right will place the IVC in view. Care must be taken not to confuse the IVC for the aorta.
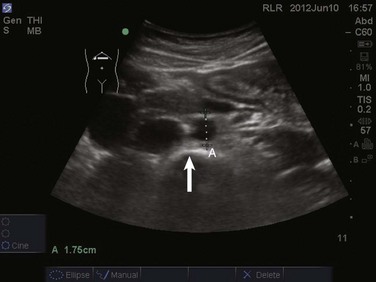
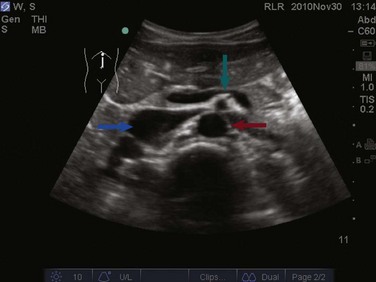
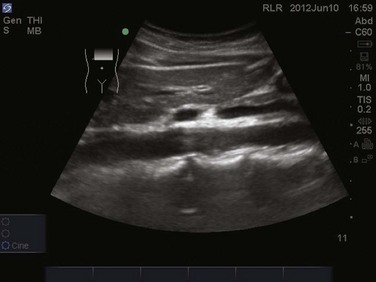
Figure 83.21 A longitudinal view of the abdominal aorta.
Measurements of the abdominal aorta should be taken in the anteroposterior diameter in the transverse orientation. The calipers should be placed on the outer wall to outer wall. Measurements in the longitudinal orientation may lead to underestimation if the image plane is obtained tangentially. Diameters greater than 3 cm are considered to be abnormal (Fig. 83.22). Although the large majority of dissections start in the thoracic aorta, those that extend to the abdominal aorta can be appreciated on abdominal ultrasonography. An echogenic linear flap can be visualized in the abdominal aorta (Fig. 83.23). If appreciated, further imaging modalities should be performed to assess the thoracic aorta.
Renal Ultrasonography
Acute renal failure is a common diagnosis encountered in those who are critically ill. In the critical care setting, acute renal failure has a mortality rate of 20% to 30%, which increases with each additional organ system involved.45 Evaluation of acute renal failure begins with determining if the cause is prerenal, postrenal, or intrinsic. Bedside ultrasound can quickly determine if postrenal causes are present, demonstrating a large distended urinary bladder or hydronephrosis.46–48
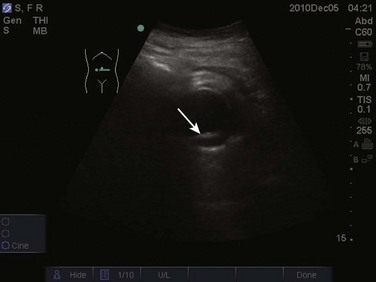
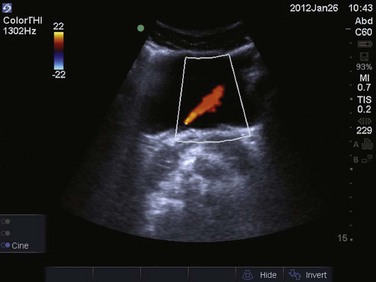
Imaging of the urinary bladder is performed with a curvilinear probe, with the probe marker toward the patient’s right in transverse orientation, and with the probe marker toward the patient’s head in longitudinal orientation. The probe should be placed just superior to the pubic symphysis. A quick visual assessment of urinary bladder size can be determined. Bladder volume can also be estimated by using the formula width × depth × length × 0.75. A postvoid residual volume greater than 100 mL is consistent with urinary retention.49 If no ureteral obstruction is present, one can appreciate ureteral flow jets visualized intermittently near the trigone of the urinary bladder. This intermittent flow of urine from the ureter into the urinary bladder is best visualized with the use of color Doppler (Fig. 83.24). If urinary retention is present, the kidneys should next be evaluated for the presence of hydronephrosis. Studies have shown that bedside sonographic evidence of hydronephrosis correlates well with findings on intravenous pyelogram and CT scanning.37,50 On ultrasound imaging, the kidney parenchyma appears slightly hypoechoic compared to the adjacent liver or spleen. The renal sinus typically appears hyperechoic owing to its high fat content. The collecting system is generally not well visualized with ultrasound unless some degree of hydronephrosis is present.51
Ultrasonographically, hydronephrosis is visualized as dilation of the collecting system, which appears dark and anechoic. It can be further classified as mild, moderate, or severe. As the severity worsens, the dilation of the renal pelvis increases, the individual calyces become less distinct, and thinning of the renal cortex can be appreciated52 (Fig. 83.25). Imaging of the right kidney begins with the probe placed in the anterior axillary line, at the subcostal margin. The patient may be lying supine or in the left lateral decubitus position. Once the kidney is identified, slight tilting or sweeping of the probe medially and laterally should be performed to visualize the kidney in its entire longitudinal axis. Turning the probe horizontally to obtain transverse views, sweeping and tilting superiorly and inferiorly, should then be performed. Similarly, when imaging the left kidney, the patient should be placed in either a supine or right lateral decubitus position. The probe should be placed in the posterior axillary line at the subcostal margin and both subcostal and intercostal images may be obtained. Again the probe should be swept or tilted throughout the entire longitudinal axis and then turned 90 degrees to obtain transverse imaging. Normal kidneys measure approximately 9 to 12 cm in length and 4 to 5 cm in width.53 Typically, small, atrophic, and hyperechoic kidneys are indicative of chronic renal failure. Enlarged kidneys often suggest an acute process, such as infection, renal vein thrombosis, and rejection.54
Deep Venous Thrombosis Ultrasonography
Venous thromboembolic disease is a common entity encountered in the critical care setting. Despite prophylaxis in the critically ill, the incidence of deep venous thrombosis (DVT) remains around 10% in such populations.55 Critically ill patients are susceptible to the development of venous thromboembolism from an increased prevalence of risk factors such as immobility, indwelling central venous catheters, cardiac failure, dehydration, and inflammatory states.55,56 Many studies have shown that an abbreviated physician-performed bedside compression ultrasound scan may be highly accurate in the diagnosis of proximal lower extremity DVT.57–60 A two-point compression study performed in the emergency department using portable ultrasonography showed a 100% sensitivity and 99% specificity in the diagnosis of proximal lower extremity DVT when compared to lower extremity duplex ultrasonography performed in a radiology department.58 The efficiency of physician-performed bedside ultrasound is a great advantage in the critical care setting. The average time for completion of bedside DVT ultrasound was 3.5 minutes, compared to 37 minutes, the average time for completion of formal venous ultrasonography.57 This latter time does not take into account transport of critically ill patients to the radiology department or the possibility that the test may be delayed until an ultrasonography technician is available.
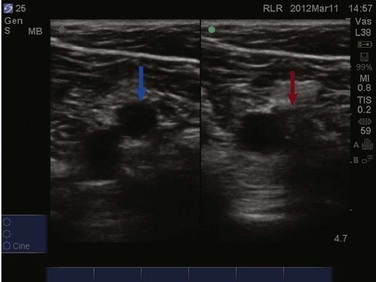
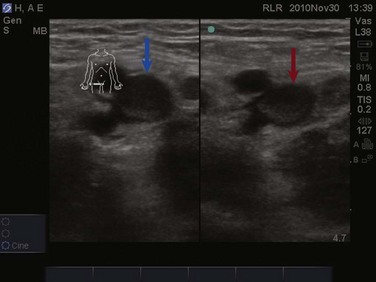
The examination for lower extremity DVT is performed with a high-frequency linear transducer. Images can be obtained with the patient supine, the leg externally rotated, and the knee slightly bent. Veins are best visualized at maximal distention, which is achieved by placing the bed in reverse Trendelenburg positioning at 30 to 45 degrees so that pooling of the venous vasculature occurs, enhancing visualization. The examination begins with visualization of the common femoral vein just beneath the inguinal ligament (Fig. 83.26). In most instances the vein will be easily distinguished from the artery; however, color or pulse wave Doppler may be used to help differentiate the vessels. With color Doppler, arterial flow will appear more pulsatile. In pulse wave Doppler, an arterial waveform will show rapid acceleration and deceleration, and a venous waveform will show continuous flow even during diastole. Once the common femoral vein is identified proximally, downward pressure should be applied to the transducer and the vein should collapse completely (Fig. 83.27). Concern for venous thromboembolism occurs if enough pressure is applied to the transducer to cause deformation of the artery without complete collapse of the vein (Fig. 83.28). The transducer should then be moved approximately 1 cm distally with sequential compression until the common femoral vein is seen branching into the superficial and deep branches. Imaging and compression should continue for 1 to 2 cm beyond this point.
The examination then moves to the popliteal region, where the probe is placed in the popliteal fossa. Identification of the popliteal artery and vein should occur with complete compression of the popliteal vein. Be aware that the popliteal vein may be duplicated and both veins must collapse on examination. Again, sequential compression at approximately 1-cm intervals should occur while moving distally to the trifurcation of the popliteal vein. Proximal DVTs are those located at or above the popliteal vein and imaging of the calf veins is generally not performed in bedside ultrasonography for DVT. While imaging the deep veins of the lower extremity, thrombus may be visualized as echogenic material within the lumen of the vessels under examination. Often this depends both on the age of the thrombus and the quality of the images. Remember, an acute thrombus may not be directly visualized within the lumen because it likely has the same echogenicity as blood.56 Lastly, upper extremity DVT accounts for approximately 18% of all venous thromboembolic disease.61 Bedside ultrasonography for the diagnosis of upper extremity DVT is possible but is technically more involved than for lower extremity imaging. The examination will not be discussed further in this chapter.
Vascular Access
Central venous catheterization is a common procedure performed in the ICU, with an estimated 5 million central venous lines placed annually in the United States. Central venous access is often essential for volume resuscitation, hemodynamic monitoring, vasopressor therapy, and frequent blood sampling.62 Traditionally, central venous catheterization was performed with a blind technique, using external anatomic landmarks to assist in vessel location.
Use of Doppler ultrasound for localization of the internal jugular vein in central venous catheterization has been described since 1984.63 A meta-analysis evaluating both real-time or Doppler assisted ultrasound guidance in central venous cannulation demonstrated that ultrasound guidance significantly decreased catheter placement failure by 64% when compared to standard landmark techniques. Likewise, the use of ultrasound decreased complications during placement by 78% and decreased the need for multiple needle passes by 40%.62 Common complications of central venous cannulation include carotid artery puncture, neck or mediastinal hematomas, brachial plexus injury, and pneumothorax.64 Studies evaluating the anatomic variation of the internal jugular vein using two-dimensional ultrasound show that the position of the internal jugular vein was outside the path predicted by external landmark techniques in 5.5% to 12% of cases.65,66
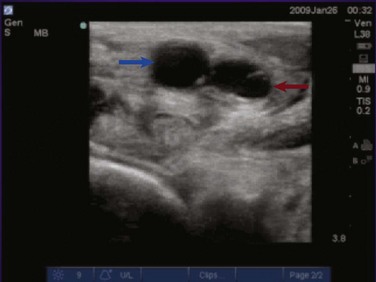
Veins and arteries are easily identified with ultrasound. A 7.5- to 10-MHz linear array transducer should be used for vessel imaging. Blood vessels appear black, or anechoic, owing to complete transmission of ultrasound waves. Arteries are pulsatile and difficult to compress with the ultrasound transducer. Veins are nonpulsatile, are easily compressed with the ultrasound transducer, and will distend when the patient performs a Valsalva maneuver or is placed in the Trendelenburg position.67 The vessel can be viewed in either the longitudinal/long-axis approach or transverse/short-axis approach (Figs. 83.29 to 83.31). The transverse, short-axis approach has been shown to be easier for novices to learn.68 In the short-axis view, however, the tip of the needle must remain in axis with the ultrasound beam in order to be visualized.
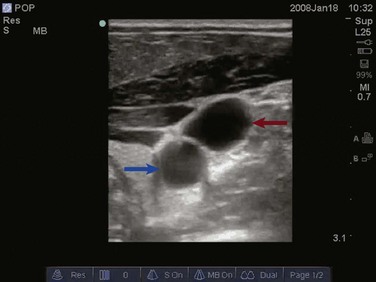
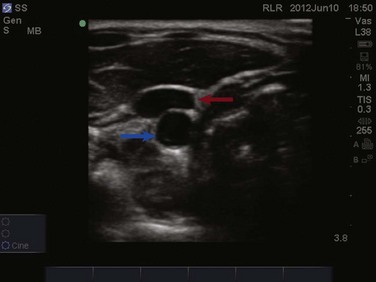
Figure 83.30 Visualization of the internal jugular vein (red arrow) lying directly over the common carotid artery (blue arrow).
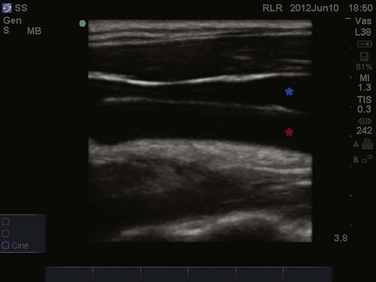
Figure 83.31 Longitudinal imaging of the internal jugular vein (blue star) lying anterior to the common carotid artery (red star).
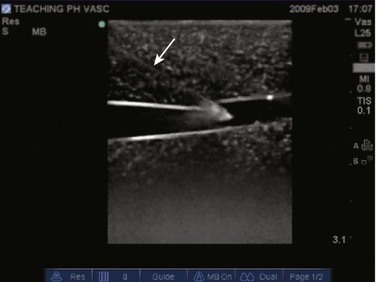
The dynamic approach uses direct ultrasound guidance to visualize the needle puncturing the vessel in real time (Fig. 83.32). The patient should be prepped in the usual sterile fashion, and the ultrasound transducer should be placed into a sterile transducer cover, and sterile ultrasound gel should be used throughout the procedure. Ultrasound gel must be placed both inside the sterile cover contacting the probe and outside the sterile cover contacting the patient’s skin. Holding the transducer in the nondominant hand and the introducer needle in the dominant hand, the operator can visualize the needle tip puncturing the appropriate vessel. The transducer should then be placed down while the guidewire is inserted. Once the guidewire is placed, ultrasound should be used to confirm placement of the wire in the appropriate vessel to avoid inadvertently dilating an artery or soft tissue structures. Needle guidance devices, which attach onto the ultrasound transducer, can be used in the dynamic approach to control needle trajectory.69 This choice is a technical consideration and is based on operator preference. A static approach may also be used in which the vessel is located using ultrasound guidance to confirm predicted landmark anatomy. The ultrasound transducer is then put down, the patient is prepped in the usual fashion, and the vessel is cannulated without real-time ultrasound imaging. Ultrasound guidance may also be used for arterial or peripheral vein puncture. Arterial puncture of the femoral, axillary, or radial arteries is commonly performed with ultrasound guidance. Similarly, venous access of the deeper cephalic, basilic, and brachial veins can be obtained using ultrasound to assist in visualization.69
References
1. Bouhemad, B, Zhang, M, Lu, Q, Rouby, JJ. Clinical review: Bedside lung ultrasound in critical care practice. Crit Care. 2007; 11(1):205.
2. Yu, CJ, Yang, PC, Chang, DB, Luh, KT. Diagnostic and therapeutic use of chest sonography: Value in critically ill patients. AJR Am J Roentgenol. 1992; 159(4):695–701.
3. Soldati, G, Sher, S. Bedside lung ultrasound in critical care practice. Minerva Anestesiol. 2009; 75(9):509–517.
4. Lichtenstein, DA. Should lung ultrasonography be more widely used in the assessment of acute respiratory disease? Expert Rev. Respir Med. 2010; 4(5):533–538.
5. Graat, ME, Kröner, A, Spronk, PE, et al. Elimination of daily routine chest radiographs in a mixed medical-surgical intensive care unit. Intensive Care Med. 2007; 33(4):639–644.
6. Oba, Y, Zaza, T. Radiography in the intensive care unit: Meta-analysis. Radiology. 2010; 255(2):386–395.
7. Krivopal, M, Shlobin, OA, Schwartzstein, RM. Utility of daily routine portable chest radiographs in mechanically ventilated patients in the medical ICU. Chest. 2003; 123(5):1607–1614.
8. Peris, A, Tutino, L, Zagli, G, et al. The use of point-of-care bedside lung ultrasound significantly reduces the number of radiographs and computed tomography scans in critically ill patients. Anesth Analg. 2010; 111(3):687–692.
9. Ouellet, JF, Ball, CG, Panebianco, NL, et al. Sonographic diagnosis of pneumothorax. J Emerg Trauma. Shock. 2011; 4(4):504–507.
10. Lichtenstein, DA. Ultrasound in the management of thoracic disease. Crit Care Med. 2007; 35(5 Suppl):S250–S261.
11. Ma, OJ, Mateer, JR, Blaivas, M. Emergency Ultrasound, 2nd ed. New York: McGraw Hill; 2008.
12. Lichtenstein, DA, Mezière, G, Lascols, N, et al. Ultrasound diagnosis of occult pneumothorax. Crit Care Med. 2005; 33(6):1231–1238.
13. Ball, CG, Kirkpatrick, AW, Feliciano, DV. The occult pneumothorax: What have we learned? Can J Surg. 2009; 52(5):E173–179.
14. Chan, SS. Emergency bedside ultrasound to detect pneumothorax. Acad Emerg Med. 2003; 10(1):91–94.
15. Dulchavsky, SA, Schwarz, KL, Kirkpatrick, AW, et al. Prospective evaluation of thoracic ultrasound in the detection of pneumothorax. J Trauma. 2001; 50(2):201–205.
16. Lichtenstein, DA, Menu, Y. A bedside ultrasound sign ruling out pneumothorax in the critically ill: Lung sliding. Chest. 1995; 108(5):1345–1348.
17. Barillari, A, Kiuru, S. Detection of spontaneous pneumothorax with chest ultrasound in the emergency department. Intern Emerg Med. 2010; 5(3):253–255.
18. Lichtenstein, DA, Lascols, N, Mezière, G, et al. Ultrasound diagnosis of alveolar consolidation in the critically ill. Intensive Care Med. 2004; 30(2):276–281.
19. Lichtenstein, DA, Mezière, GA, Laguueyte, JF. A-lines and B-lines: Lung ultrasound as a bedside tool for predicting pulmonary artery occlusion pressure in the critically ill. Chest. 2009; 136(4):1014–1020.
20. Lichtenstein, DA, Mezière, GA, Seitz, J. The dynamic air bronchogram: A lung ultrasound sign of alveolar consolidation ruling out atelectasis. Chest. 2009; 135(6):1421–1425.
21. Volpicelli, G, Mussa, A, Garofalo, G, et al. Bedside lung ultrasound in the assessment of alveolar-interstitial syndrome. Am J Emerg Med. 2006; 24(6):689–696.
22. Lichtenstein, DA, Goldstein, I, Mourgeon, E, et al. Comparative diagnostic performances of auscultation, chest radiography, and lung ultrasonography in acute respiratory distress syndrome. Anesthesiology. 2004; 100(1):9–15.
23. Lichtenstein, D, Mézière, G, Biderman, P, et al. The comet-tail artifact. An ultrasound sign of alveolar-interstitial syndrome. Am J Respir Crit Care Med. 1997; 156(5):1640–1646.
24. Mattison, LE, Coppage, L, Alderman, D, et al. Pleural effusions in the medical ICU: Prevalence, causes, and clinical implications. Chest. 1997; 111(4):1018–1023.
25. Roch, A, Bojan, M, Michelet, P, et al. Usefulness of ultrasonography in predicting pleural effusions > 500 mL in patients receiving mechanical ventilation. Chest. 2005; 127(1):224–232.
26. Mayo, PH, Goltz, H, Tafreshi, M, et al. Safety of ultrasound-guided thoracentesis in patients receiving mechanical ventilation. Chest. 2004; 125(3):1059–1062.
27. Barnes, TW, Morgenthaler, TI, Olson, EJ, et al. Sonographically guided thoracentesis and rate of pneumothorax. J Clin Ultrasound. 2005; 33(9):442–446.
28. Lichtenstein, DA, Hulot, JS, Rabiller, A, et al. Feasibility and safety of ultrasound-aided thoracentesis in mechanically ventilated patients. Intensive Care Med. 1999; 25(9):955–958.
29. Nicolaou, S, Talsky, A, Khashoggi, K, et al. Ultrasound-guided interventional radiology in critical care. Crit Care Med. 2007; 35(5 Suppl):S186–S197.
30. Beaulieu, Y, Marik, PE. Bedside ultrasonography in the ICU: Part 2. Chest. 2005; 128(3):1766–1781.
31. Duncan, DR, Morgenthaler, TI, Ryu, JH, et al. Reducing iatrogenic risk in thoracentesis: Establishing best practice via experiential training in a zero-risk environment. Chest. 2009; 135(5):1315–1320.
32. Bard, C, Lafortune, M, Breton, G. Ascites: Ultrasound guidance or blind paracentesis? Can Med Assoc J. 1986; 135(3):209–210.
33. Nazeer, SR, Dewbre, H, Miller, AH. Ultrasound-assisted paracentesis performed by emergency physicians vs. the traditional technique: A prospective, randomized study. Am J Emerg Med. 2005; 23(3):363–367.
34. Jehle, D, Guarino, J, Karamanoukian, H. Emergency department ultrasound in the evaluation of blunt abdominal trauma. Am J Emerg Med. 1993; 11(4):342–346.
35. Liu, M, Lee, CH, P’eng, FK. Prospective comparison of diagnostic peritoneal lavage, computed tomographic scanning, and ultrasonography for the diagnosis of blunt abdominal trauma. J Trauma. 1993; 35(2):267–270.
36. Thomas, B, Falcone, RE, Vasquez, D. Ultrasound evaluation of blunt abdominal trauma: Program implementation, initial experience, and learning curve. J Trauma. 1997; 42(3):384–388.
37. Lameire, N, Van, Biesen, Vanholder, R. Acute renal failure. Lancet. 2005; 365(9457):417–430.
38. Scott, RA, Ashton, HA, Kay, DN. Routine ultrasound screening in management of abdominal aortic aneurysm. Br Med J. 1988; 296(6638):1709–1710.
39. Phelan, MP, Emerman, CL. Focused aortic ultrasound to evaluate the prevalence of abdominal aortic aneurysm in ED patients with high-risk symptoms. Am J Emerg Med. 2006; 24(2):227–229.
40. Ashton, HA, Buxton, MJ, Day, NE, et al. The Multicentre Aneurysm Screening Study (MASS) into the effect of abdominal aortic aneurysm screening on mortality in men: A randomised controlled trial. Lancet. 2002; 360(9345):1531–1539.
41. Lederle, FA. Ultrasonographic screening for abdominal aortic aneurysms. Ann Intern Med. 2003; 139(6):516–522.
42. Lederle, FA, Johnson, GR, Wilson, SE, et al. The aneurysm detection and management study screening program: Validation cohort and final results. Aneurysm Detection and Management Veterans Affairs Cooperative Study Investigators. Arch Intern Med. 2000; 160(10):1425–1430.
43. Tayal, VS, Graf, CD, Gibbs, MA. Prospective study of accuracy and outcome of emergency ultrasound for abdominal aortic aneurysm over two years. Acad Emerg Med. 2003; 10(8):867–871.
44. Kuhn, M, Bonnin, RL, Davey, MJ. Emergency department ultrasound scanning for abdominal aortic aneurysm: Accessible, accurate, and advantageous. Ann Emerg Med. 2000; 36(3):219–223.
45. Coleman, BG. Ultrasonography of the upper genitourinary tract. Urol Clin North Am. 1985; 12(4):633–644.
46. Mainprize, TC, Drutz, HP. Accuracy of total bladder volume and residual urine measurements: Comparison between real-time ultrasound and catheterization. Am J Obstet Gynecol. 1989; 160(4):1013–1016.
47. Rosen, CL, Brown, DF, Sagarin, MJ, et al. Ultrasonography by emergency physicians in patients with suspected ureteral colic. J Emerg Med. 1998; 16(6):865–870.
48. Watkins, S, Bowra, J, Sharma, P, et al. Validation of emergency physician ultrasound in diagnosing hydronephrosis in ureteric colic. Emerg Med. 2007; 19(3):188–195. [Aust].
49. Barozzi, L, Valentino, M, Santoro, A, et al. Renal ultrasonography in critically ill patients. Crit Care Med. 2007; 35(5):S198–S205.
50. Kiely, EA, Hartnell, GG, Gibson, RN, et al. Measurement of bladder volume by real-time ultrasound. Br J Urol. 1987; 60(1):33–35.
51. Ireton, RC, Krieger, JN, Cardenas, DD, et al. Bladder volume determination using a dedicated, portable ultrasound scanner. J Urol. 1990; 143(5):909–911.
52. Noble, VE, Brown, DF. Renal ultrasound. Emerg Med Clin North Am. 2004; 22(3):641–659.
53. Bradnt, TD, Neiman, HL, Dragowski, MJ, et al. Ultrasound assessment of normal renal dimensions. J Ultrasound Med. 1982; 1(2):49–52.
54. Chan, H. Noninvasive bladder volume measurement. J Neurosci Nurs. 1993; 25(5):309–312.
55. Marik, PE, Andrews, L, Maini, B. The incidence of deep venous thrombosis in ICU patients. Chest. 1997; 111(3):661–664.
56. Blaivas, M. Ultrasound in the detection of venous thromboembolism. Crit Care Med. 2007; 35(5 Suppl):S224–S234.
57. Blaivas, M, Lambert, MJ, Harwood, RA, et al. Lower-extremity doppler for deep venous thrombosis—Can emergency physicians be accurate and fast? Acad Emerg Med. 2000; 7(2):120–126.
58. Crisp, JG, Lovato, LM, Jang, TB. Compression ultrasonography of the lower extremity with portable vascular ultrasonography can accurately detect deep venous thrombosis in the emergency department. Ann Emerg Med. 2010; 56(6):601–610.
59. Burnside, PR, Brown, MD, Kline, JA. Systematic review of emergency physician-performed ultrasonography for lower-extremity deep vein thrombosis. Acad Emerg Med. 2008; 15(6):493–498.
60. Kory, PD, Pellecchia, CM, Shiloh, AL, et al. Accuracy of ultrasonography performed by critical care physicians for the diagnosis of DVT. Chest. 2011; 139(3):538–542.
61. Mustafa, S, Stein, PD, Patel, KC. Upper extremity deep venous thrombosis. Chest. 2003; 123(6):1953–1956.
62. Randolph, AG, Cook, DJ, Gonzales, CA, et al. Ultrasound guidance for placement of central venous catheters: A meta-analysis of the literature. Crit Care Med. 1996; 24(12):2053–2058.
63. Legler, D, Nugent, M. Doppler localization of the internal jugular vein facilitates central venous cannulation. Anesthesiology. 1984; 60(5):481–482.
64. Denys, BG, Uretsky, BF, Reddy, PS. Ultrasound-assisted cannulation of the internal jugular vein. A prospective comparison to the external landmark-guided technique. Circulation. 1993; 87(5):1557–1562.
65. Denys, BG, Uretsky, BF. Anatomical variations of internal jugular vein location: Impact on central venous access. Crit Care Med. 1991; 19(12):1516–1519.
66. Slama, M, Novara, A, Safavian, A, et al. Improvement of internal jugular vein cannulation using an ultrasound-guided technique. Intensive Care Med. 1997; 23(8):916–919.
67. Hatfield, A, Bodenham, A. Portable ultrasound for difficult central venous access. Br J Anaesth. 1999; 82(6):822–826.
68. Blaivas, M, Brannam, L, Fernandez, E. Short-axis versus long-axis approaches for teaching ultrasound-guided vascular access on a new inanimate model. Acad Emerg Med. 2003; 10(12):1307–1311.
69. Maecken, T, Grau, T. Ultrasound imaging in vascular access. Crit Care Med. 2007; 35(5 Suppl):S178–S185.
[/level-membership-for-critical-care-medicine-category][not-level-membership-for-critical-care-medicine-category]83
Bedside Ultrasonography in the Critical Care Patient
Lung Ultrasonography
Lung ultrasonography is a valuable tool in the assessment of critically ill patients. The diagnostic accuracy of using ultrasound in the lung to establish the presence of pneumothorax, pleural effusion, lung consolidation, and alveolar-interstitial syndrome has been well established.1 Lung ultrasonography can be rapidly performed at the bedside and has been shown to significantly aid in the management of critical patients.2 Lung computed tomography (CT) remains the gold standard for thoracic imaging in the critical care setting, despite its major drawbacks (radiation, cost, transportation), even though portable chest radiography is the most common diagnostic imaging modality.2–4 Although portable chest radiographs are routinely performed in the ICU, multiple studies have shown limited diagnostic accuracy, with the elimination of routine chest radiographs having no adverse effect on length of stay, readmission, and mortality rates.5–7 Routine use of bedside lung ultrasound in the ICU has been shown to significantly reduce the number of both chest radiographs and CT scans obtained.8
Technique and Equipment
In normal lung, ultrasound waves are reflected off gas-filled structures, limiting the visualization of lung structures beyond the pleura.1 The diagnosis of lung disease by ultrasound largely relies on the detection of ultrasound artifacts. To examine the thorax, a high-frequency linear transducer (5-12 MHz) is best used to visualize the relatively superficial pleural line. Lower frequency microconvex and convex transducers (2-5 MHz) can be used to scan the deeper lung parenchyma.9 Supine positioning is most commonly utilized in the ICU, and lateral decubitus positioning may assist in the visualization of the dorsal aspects of the lower lobes. To perform lung ultrasonography the transducer should be placed in a longitudinal axis, between two ribs. In this view the pleural interface can be seen as a hyperechoic horizontal line approximately 0.5 cm deep, relative to the anterior border of the ribs1,10 (Fig. 83.1). This image of the ribs and pleural line is the basic landmark in lung sonography and is often referred to as the bat sign.10,11
Pneumothorax
Pneumothorax, defined as a collection of air between the visceral and parietal pleural layers, has a frequency of approximately 6% in the ICU setting.12 Although screening for pneumothorax with supine anteroposterior (AP) chest radiography is still common in the critical care setting, sensitivities for the diagnosis of pneumothorax average 50%.13 The sensitivity for diagnosis of pneumothorax by lung ultrasound has been shown to be greater than 95% in multiple large prospective studies.14 Moreover, lung ultrasound for pneumothorax can be completed in an average of 2 to 3 minutes, significantly faster than obtaining a portable chest radiograph or transport to CT scan.15 The examination should begin with the transducer placed longitudinally at the midclavicular line at the level of the second to third intercostal space. Sequential movement of the transducer inferior and lateral across multiple rib interspaces will allow for a comprehensive examination of the pleura.9 This approach should then be repeated on the opposite hemithorax.
Focusing on the pleural line in real time, a sliding type of motion of the visceral and parietal pleura can be observed. This dynamic motion is termed lung sliding, and can be seen in normal lung ultrasound (Video 83.1). In the presence of a pneumothorax, air is trapped between the visceral and parietal pleural layers and the dynamic motion of lung sliding will not be detected (Video 83.2). The presence of lung sliding alone has a 100% negative predictive value in the diagnosis of pneumothorax.16 However, the absence of lung sliding does not rule in the diagnosis of pneumothorax. A number of conditions can result in the absence of lung sliding such as massive atelectasis, acute respiratory distress syndrome (ARDS), pleural adhesions, and severe fibrosis.9,10 M-mode and power Doppler may be useful when lung sliding is difficult to visualize on real-time B-mode imaging. M-mode analysis of normal lung tissue displays the “seashore sign,” a characteristic linear wave pattern representing the motionless chest wall, and below the pleural line a granular pattern represents normal lung motion17 (Fig. 83.2). M-mode analysis of a pneumothorax demonstrates the “stratosphere sign,” a characteristic appearance of exclusively linear lines10 (Fig. 83.3). Power Doppler will depict motion along the pleural interface, corresponding to normal lung sliding (Fig. 83.4). In the presence of a pneumothorax, no Doppler signal will be detected along the pleural surface. The visualization of the lung point may also be used in the diagnosis of pneumothorax, having a specificity of 100%. The lung point represents the area on the chest wall where normal lung sliding is again appreciated, corresponding to the lateral edge of the pneumothorax (Fig. 83.5). This confirms the absence of visualization of lung sliding was not due to technical errors in lung ultrasound, but rather the presence of pneumothorax.10
Figure 83.5 M-mode ultrasound imaging of the lung point, correlating with the lateral edge of the pneumothorax.
Two linear artifacts arising from the pleural line are key to the evaluation of pneumothorax by lung ultrasound, A and B lines. A lines are a reverberation artifact of the parietal pleura, represented as horizontal lines in a repetitive pattern (Fig. 83.6). B lines, or comet tails, are described as vertical lines extending the length of the screen, which erase A lines and move with lung sliding12 (Fig. 83.7). In lung ultrasound, the appreciation of only one B line indicates normal apposition of the parietal and visceral pleura and rules out pneumothorax at that location.9 Because A lines arise from the parietal pleura, their presence can be appreciated in both normal lung and pneumothorax. The absence of lung sliding with the presence of A lines has a sensitivity of 95% and specificity of 94% in the diagnosis of pneumothorax.12
Lung Consolidation
Alveolar consolidation, seen in pulmonary edema, bronchopneumonia, lung contusion, and lobar atelectasis, results in the loss of lung aeration replaced by fluid, allowing for ultrasound transmission and imaging.1 As the ratio of lung tissue to air increases, lung hepatization appears on ultrasound imaging, with the lung parenchyma taking a hepatic tissue-like appearance3 (Fig. 83.8). Consolidated lung adjacent to the pleura will permit the transmission of ultrasound waves. A prospective clinical study in a medical ICU setting showed that 98% of alveolar consolidations abutted the pleura, allowing for ultrasound assessment. The deep border of alveolar consolidations will typically have an irregular appearance, sometimes referred to as the shred sign, unless the entire lobe is involved.10 Using CT as the gold standard, ultrasound has a 90% sensitivity and 98% specificity in the diagnosis of alveolar consolidation.18 Air bronchograms can be visualized within consolidated lung as bright highly reflective echogenic lines.21 Dynamic air bronchograms move centrifugally during inspiration and can typically be seen in pneumonia, as opposed to static air bronchograms of atelectasis.19
Alveolar-Interstitial Syndrome
Alveolar-interstitial syndrome is a common entity in the ICU, caused acutely by a variety of conditions, including ARDS, acute pulmonary edema, and interstitial pneumonia.20 Interstitial edema precedes alveolar edema and may be difficult to discern on chest radiograph. Interstitial edema can be visualized on lung ultrasound by demonstrating three or more B lines located between two ribs, defined as lung rockets21 (Fig. 83.9 and Video 83.3). B lines 7 mm apart correspond to thickened interlobular septa and extravascular lung volume, but B lines 3 mm apart or less correspond to alveolar edema and a ground-glass appearance of the lung.22 In an acutely dyspneic patient, the detection of lung rockets allows the intensivist to immediately differentiate acute pulmonary edema from chronic obstructive pulmonary disease (COPD). Lung rockets are also unusual in the presence of pulmonary embolism.10 It is important to remember that B lines may be isolated or confined laterally in the last intercostal space in normal healthy lung.23
Pleural Effusion
The prevalence of pleural effusion is approximately 60% in the ICU setting.24 Pleural effusion may arise from a variety of conditions, most commonly heart failure, atelectasis, pneumonia, and volume overload. Portable supine chest radiography has poor sensitivity and specificity in the diagnosis of a pleural effusion, but lung ultrasound outperforms both chect radiography and clinical examination. Lung ultrasound can help differentiate pleural effusions from infiltrate or atelectasis, with a sensitivity of 92% and specificity of 93%.22 Pleural effusions appear as an anechoic area in dependent lung regions (Figs. 83.10 and 83.11). Transudative fluid appears echo-free, and exudative fluid may contain small echogenic debris. In intercostal imaging, pleural effusions will be bordered laterally by rib shadows, superiorly by the parietal pleural line, and inferiorly by the lung line. M-mode analysis demonstrates a decrease in the interpleural distance with inspiration, known as the sinusoid sign10 (Fig. 83.12). Lung ultrasound can also help estimate volume of pleural fluid. An anteroposterior diameter greater than 5 cm measured at the lung base or fifth intercostal space predicts a pleural effusion fluid volume of greater than 500 mL.25
Figure 83.11 Left-sided pleural effusion (star).
Thoracentesis
The utilization of ultrasound to determine needle placement in thoracentesis has been shown in multiple studies to significantly decrease complication rates, especially that of pneumothorax.26–28 Localization of fluid above the diaphragm should be the first objective, avoiding mistaking peritoneal for pleural fluid.28 Once pleural fluid is visualized, the transducer should be moved one interspace above and below to evaluate the extent of the effusion.29 The chest should be scanned in both the longitudinal and cross-sectional plane and the positions of the heart, diaphragm, and liver/spleen determined. Next, an interpleural measurement (parietal pleura to visceral pleura) of at least 1.5 cm during inspiration should be obtained to allow for safe needle puncture. The potential site of needle puncture should be observed throughout the entire respiratory cycle to evaluate for the appearance of lung, heart, liver, or spleen in the projected needle path.28 After a safe site has been identified, the skin should be marked and disinfected. It is essential the patient remain in the same position as when the ultrasonography was performed.30 Real-time guidance is not necessary for needle puncture, but needle insertion should occur within minutes of ultrasound marking.31
Abdominal Ultrasonography
Paracentesis
Paracentesis is a commonly performed procedure in the critical care setting. Bedside ultrasonography prior to every paracentesis improves both the safety and efficacy of this procedure.32,33 An emergency department study comparing ultrasound-assisted paracentesis versus traditional blind technique showed a 95% success rate with ultrasound guidance versus only 61% with the traditional technique. Moreover, 25% of patients randomized to the ultrasound-assisted technique completely avoided the procedure due to either the absence of ascitic fluid or too little ascitic fluid for aspiration. Two more patients in this group did not receive paracentesis after performance of bedside ultrasound, which revealed a large cystic mass in the left lower quadrant of one patient and a ventral hernia in the other, both of which were mistaken for ascitic fluid and in which performance of paracentesis would have been potentially disastrous.33
A low-frequency curved array transducer is preferred. As with the traditional blind technique, the urinary bladder should be decompressed and the patient should be lying supine. Ascites will appear as anechoic fluid within the peritoneal cavity and often loops of bowel will be seen floating within this fluid (Fig. 83.13
[/not-level-membership-for-critical-care-medicine-category]
