Chapter 1 Basic Principles of Ultrasound
Overview
Nature has long recognized and appreciated the perceptual gift of echolocation, which manifests in the biologic marvels of bats and whales, creatures that use echoes to map space in darkness and deep water, areas where sight is uninformative. The ability possessed by these creatures to experience the world directly through echolocation will always remain foreign to humans. We cannot replicate the vocal, auditory, and particularly the cortical adaptations required for this type of experience, so we must settle for a surrogate, which is the use of reflected sound energy to manufacture a visual representation of anatomic space. For an in-depth discussion of echolocation and other unique sensory experiences in nonhuman mammals, Howard Hughes’ award winning book Sensory Exotica is highly recommended.1
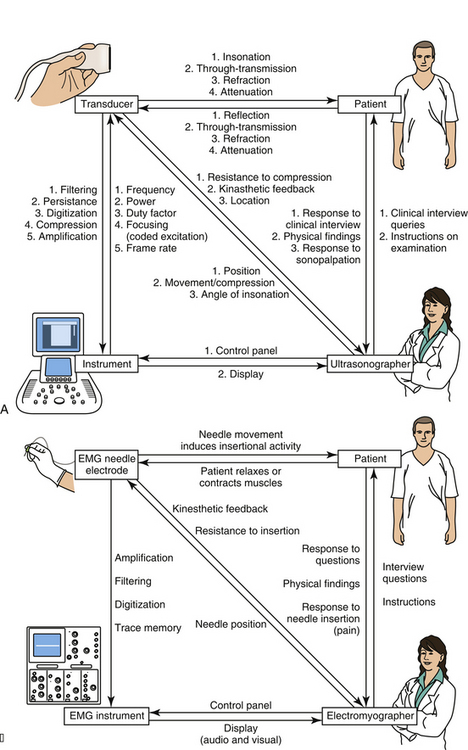
Almost everyone who is using this textbook will have already had some experience with ultrasound, but even for the experienced ultrasonographer, it is helpful to begin with a review of instrumentation as a means of explaining how an ultrasound image is created. The discussion begins with a description of how to get started generating images with an instrument, followed by discussions of the transducer and its elements, the behavior of sound and echoes in human tissue, and how the ultrasound instrument regulates the transducer and translates echoes into an image. In parallel with these descriptions are some brief comparisons of ultrasound with electrodiagnostic technology. Neuromuscular pathology is largely corroborated, not by other imaging modalities, but by electrodiagnostic findings, so an appreciation of this technology is of value. Further, many readers have considerable experience with electrodiagnosis, and this will help them appreciate the mechanics of ultrasound. There are also some parallel discussions on the nature of human perception and how that also determines display characteristics of ultrasound instrumentation (Fig. 1.1).
Getting Started: Obtaining an Image
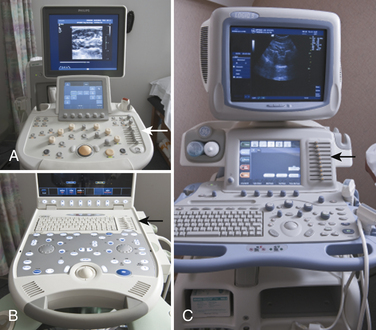
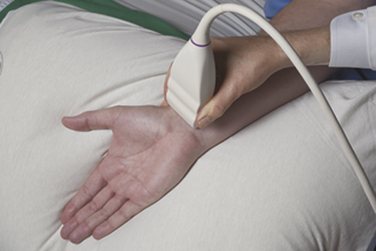
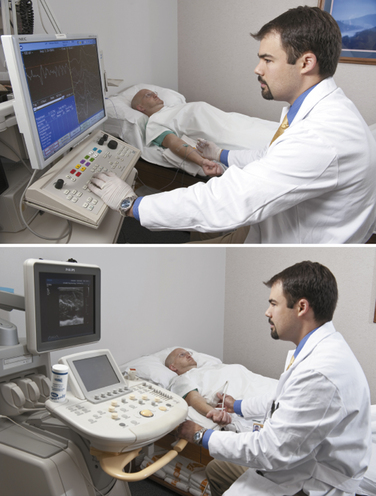
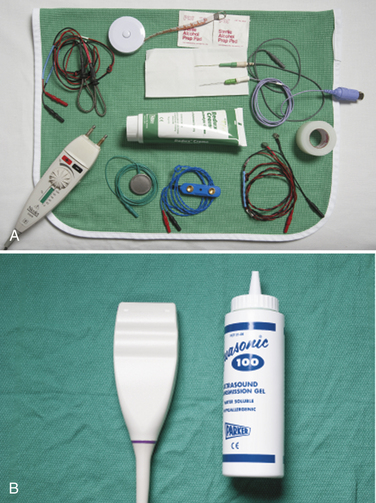
Ultrasound instruments have an impressive array of switches, dials, and buttons that can be daunting to the novice (Fig. 1.2). Even finding the on/off button to the instrument, which is invariably in a covert location to avoid inadvertent deactivation, adds to the challenge. Once the instrument is turned on, however, users quickly find that the instrument is quite intuitive and can be quickly put to use. The first step is to identify the active transducer on the instrument and then to coat it with coupling gel. It can then be placed over the wrist as shown in Figure 1.3. Note that every linear array transducer has a marking on one side, which corresponds to a marking on the display screen. The marking on the display should always be in the upper left corner of the screen, and the probe should be positioned such that the marker on the probe is pointed cephalad to the patient for sagittal imaging and to the ultrasonographer’s left side for cross-sectional imaging. This will produce images that are oriented in the same fashion as computed tomography (CT) or magnetic resonance imaging (MRI). However, it should be noted that this convention has not been routinely followed in neuromuscular imaging, so not all of the older images in this text are oriented in this fashion. In particular, sagittal imaging of the median nerve at the wrist frequently has been depicted in the opposite fashion in the literature, with the left side of the display screening showing the distal portion of the wrist, but that is an undesirable orientation, based on ultrasound convention, and should be avoided.2 See Box 1.1 for other general considerations when performing neuromuscular ultrasound.
Box 1.1 General Considerations for Neuromuscular Ultrasound
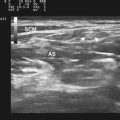
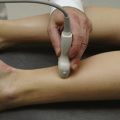
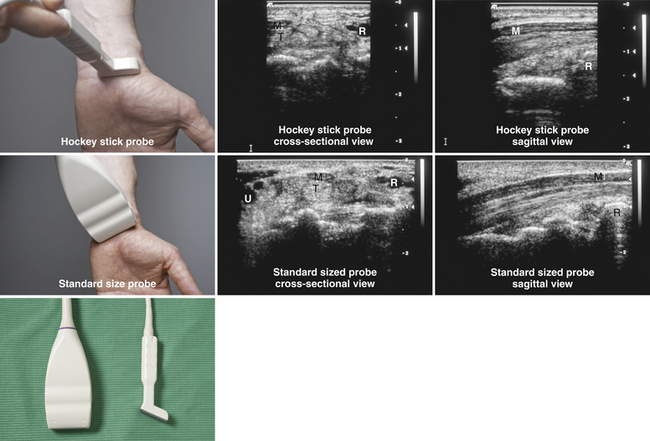
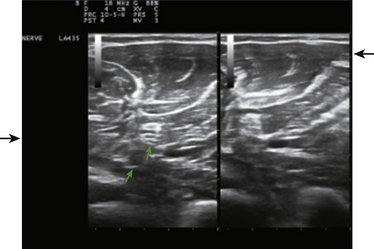
When imaging the wrist, the base of the palm should rest comfortably on the patient’s forearm or other supported structure. An image of the contents of the carpal tunnel, and possibly the radial and/or ulnar artery should appear. The width of the image corresponds to the footprint of a linear probe (Fig. 1.4) or the radial angles of the probe if it is curved (see Fig. 4.2 and Fig 4.14). The coupling gel, in addition to enhancing sound penetration, allows the probe to slide left or right or distal or proximal to find the optimal image of the tissue in the neighborhood of the initial contact of the probe. The probe can also, with slight pressure, be angled proximally or distally. In general, structures are viewed with the probe perpendicular to the skin surface, but angular adjustments are of considerable interest as is discussed later. No more pressure than necessary should be used to scan; excessive pressure may deform structures of interest and can be tiring to the ultrasonographer and uncomfortable for the patient (Fig. 1.5). To help others orient to an image, it can help to include a recognizable landmark as well (vascular bifurcation, bone edge, etc.).
Several simple adjustments can be made to change the display once the desired image is obtained. One knob on the ultrasound instrument panel adjusts the depth of the field of view.3 The depth should be sufficient to encompass the structure(s) of interest. The display screen is calibrated to indicate depth and serves as a useful reference in images for publication (see Fig. 1.4). The zoom feature of an instrument allows the user to focus in on the detail of interest, expanding it to encompass the screen with a slight improvement in resolution. Unlike MRI and CT, which are designed to automatically record standard body slices, ultrasound requires the operator to scan using multiple probe positions and angles and operating controls to capture the most informative two-dimensional (2D) images for documentation. Greater depth of field (low magnification) and zoom (higher magnification) are analogous to lens power on a microscope—lower magnification is useful for orientation and screening for abnormalities, and higher magnification is used to capture the essence of the pathologic change. If the pathology is diffuse, lower magnification (greater depth of field, as in the case of diffuse muscle pathology) may be preferred.
The brightness of the image can be controlled by the power and gain dials on the instrument.3 The power dial controls the amount of sound energy transmitted to the tissue and the gain dial the amplification of the sound echoes that return. These dials have similar but not identical functions and need to be set to optimally display the structures of interest. The dials have an analogy with photography: The power dial in this case controls the strength of the flash, and the gain dial in essence controls the film speed (with faster, e.g., more sensitive, film speeds being equivalent to increased gain). In electrodiagnosis, the power dial controls stimulus intensity4, and gain is used to display the amplitude of the nerve conduction study response. In both ultrasound and electrodiagnosis, excessive intensities do little to enhance the outcomes of the study.
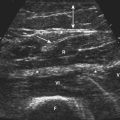
The focal zone, typically indicated by horizontal marker(s) on the display screen, helps with resolution.3 The level of focal zones (which are horizontal) should encompass the structures of interest (Fig. 1.6). The freeze button on the instrument will stop the real-time action of the machine and display a single frame. Most instruments store (in an adjustable fashion) several seconds of data at any given time, so it is possible, once an image is frozen, to rewind slowly through multiple previous frames to capture the optimal image for storage. Of interest, the rewind and replay features of ultrasound instruments have been an industry standard for many years, yet this simple function has only recently become available on electromyography (EMG) instruments. Any frozen image can be saved for later viewing, and a variety of postprocessing capabilities for analysis and labeling are present on many instruments as well.
The Transducer
Piezoelectric elements convert electrical energy into a pulse of sound wave energy and then converts the resulting sound wave echoes back into electrical energy.3 An array of piezoelectrical elements creates the sound energy needed to generate echoes, and the electrical signals elicited by their return to the probe characterizes the remarkable function.of the ultrasound transducer—the device placed on the skin to deliver and receive sound pulses. It is helpful to contrast an ultrasound transducer with the contact elements used in electrodiagnosis. EMG and nerve conduction studies (NCS) electrodes are of much simpler construction because they record and carry electrical signals without the need of converting to a different type of energy. For nerve conduction studies, there is a pair of electrodes for delivering electrical energy and a pair for recording it.4 These electrodes consist of exposed metal in rings, disks, or needles (Fig. 1.7). Once electrical signals are obtained, either directly in electrodiagnostic instruments, or indirectly with an ultrasound transducer, the signals are filtered and amplified by the respective instrument to generate a display for interpretation. At this point, both instruments convert electrical energy into light energy to create an image. In electrodiagnosis the display is of a single point of constant intensity that varies in vertical displacement (amplitude) over time, whereas in ultrasound the image is a 2D sea of points that vary in brightness over time. In EMG there is conversion of the display into sound energy as well. Sound is typically part of the display in ultrasound only with Doppler blood flow studies. As would be expected from their more complex design elements, ultrasound transducers are significantly more expensive and more fragile than electrodiagnostic electrodes.
EMG textbooks often devote several pages to describing the unique features of EMG electrodes because subtle differences in structure can lead to minor, but argued over, differences in recording characteristics (see Fig. 1.7).4 With ultrasonography the function of the transducer is more complex than a simple recording electrode and intimately linked to the instrument, so ultrasonographers tend to fixate less on the predictable consequences of minor design variations and more on figuring out the best way to create an optimal image with the technology at hand. The following discussion of transducers serves to highlight their limitations and possibilities in evaluating patients with neuromuscular disease.
Compound Structure
An ultrasound probe actually contains an array of multiple tiny component piezoelectric transducers each providing a single line of ultrasound data (Fig. 1.8). By seamlessly stitching together each of these lines of data, the display creates a 2D image in the same way that old television screens created images from parallel lines of display.3 Ultrasound transducers come in many shapes. When using ultrasound to study the heart it helps to have a curved surface so that when the probe is placed against the ribs, it is able to scan a larger tissue area through a narrow aperture.2 Internal probes for vaginal, rectal, and esophageal imaging have shapes that conform to the anatomic requirements of their use.3 At the greatest extreme, intravascular ultrasound probes can be used to examine arterial walls.5 All involve different arrays of transducers or a motorized transducer or set of transducers. For neuromuscular imaging, the most commonly used probe is a linear array probe because most imaging planes are compatible with this shape. A hockey stick probe, which is a linear probe with a smaller footprint and extended handle, is sometimes useful for imaging around bony surfaces, such as the medial epicondyle.
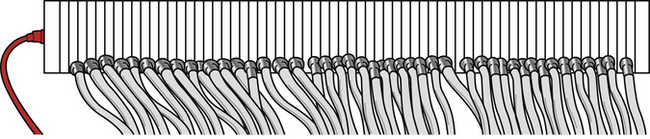
Fig. 1.8 A drawing of an ultrasound transducer that has had the impedance matching material and cover removed. Note the multiple transducer elements, each with its own electrical contact. The thickness of the ultrasound power cord (see Fig. 1.7) reflects the fact that most transducers need wiring for hundreds of elements.
Miniaturization with Piezoelectricity
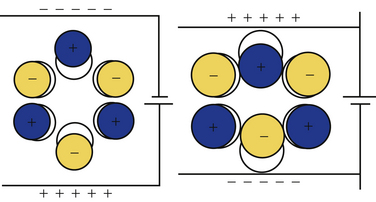
The critical principle underlying ultrasound transducers is piezoelectricity, a property inherent in different types of special materials.3 This phenomenon was first described in quartz crystals. Whereas noncrystalline quartz contains a disordered arrangement of silicon dioxide molecules, quartz crystals have an orderly lattice that is determined by the electrostatic charges of the individual molecules, which incidentally have an asymmetric polar configuration. Application of a current across this lattice leads to absorption of energy, changes in electron orbits, and consequently shape changes in the underlying crystal (Fig. 1.9). This abrupt dimensional change creates a sound pulse. The application of mechanical stress to a quartz crystal, in a reverse fashion, causes an electrical current, making this material ideal for use in phonograph pickup needles or ultrasound transducers.
Currently, lead zirconate titanate,3 a piezoelectric ceramic, is used for ultrasound transducers. Although this chemical is not naturally piezoelectric, when it is heated to more than approximately 350° C in an electromagnetic field, the molecules can quickly be induced to assume a dipole-driven lattice that confers piezoelectric properties. When cooled, the application of a voltage across this material causes it to thicken or thin as the suspended molecules turn their dipoles toward or away from the electrostatic charge. This shape change, in a small wafer of material, generates the sound pulses used in modern ultrasound transducer probes. These small wafers can be arrayed in a linear fashion, each with its own separate wiring, to create the typical ultrasound transducer.
The Transducer Shell
The casing of the ultrasound probe holds a number of elements including the individual transducers, the wiring to these transducers, and several layers of material.3 Note that the cable that connects the transducer to the instrument is quite thick (see Fig. 1.4) because it contains both inputs and outputs to the hundreds of miniature transducers that make up a typical linear array transducer. Damping material is placed at the base of the transducer to help control the duration of the sound pulses emitted by the probe. Shorter sound pulses are associated with better resolution. Piano strings use dampers to enhance a staccato effect of a key strike; when these are raised by engaging the sostenuto pedal, the string vibration is prolonged, causing sounds and notes to slur together. As such, the damper material enhances the discrimination provided by pulsed sound.
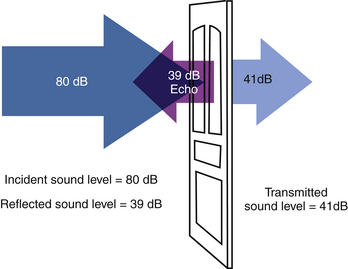
Between the contact face of the probe and the underlying transducer array, matching layers are inserted.3 These help reduce the impedance mismatch of the transducer and the skin, a phenomenon further aided by the use of coupling gel. These steps enhance through-transmission of sound into the body, and without these steps more than 80% of the sound would be reflected back to the transducer at the skin surface. A more detailed discussion of acoustic impedance matching can be found elsewhere.6
Sound Pulse Technology
At its simplest, echolocation involves a single sound pulse, followed by an evaluation of the timing and intensity of any returning echoes.1 Bats use their vocal cords to emit short pulses of sound to create echoes. Humans, ill-equipped for this task, can shout into a deep well and infer from the delay of the sound return something about its depth, and by the quality of the sound something about the reflecting materials in the well. If there are smooth stone sides and a water reservoir at the bottom, a sharp crisp echo will return. If instead moss covers the walls and leaves coat the bottom, a muffled softer sound will be heard.
Ultrasound relies also on single sound pulses to create an echo trace.3 The sound is produced by the transducer element, the sound penetrates soft tissues, and as the sound passes through the body, tissue interfaces at different levels create multiple echoes of different intensities. At each interface, some sound is reflected and some is transmitted. The echoes return at different times to the transducer element, which converts them to a trace signal. The latencies of the echoes provide information about spatial relations (depth of the reflective surface), and the intensity of the echoes provides information about the types of reflecting surfaces.
Humans primarily use sight to map space, and this is why ultrasound data are displayed as an image. Most vision is based on a source that bathes a scene with a constant flow of light energy, such as the sun or a light bulb. This contrasts with ultrasound, which maps space with pulsed sound; its equivalent would be a fast-pulsing strobe light. An echo is a reflection of an entire sound pulse, so the shorter the pulse, the less likely an echo will return during the pulse itself, and the less likely that early and late components of sequential pulses will interfere with each other.3 Typically a B-mode ultrasound pulse is 2 to 3 cycles of sound energy in duration, and at 10 MHz, this takes about 0.2 to 0.3 μs. Of interest, bat calls are of much longer duration: 0.2 to 100 μs, but their calls cover much greater distances, perhaps 50 meters or more. Appropriately, call duration shortens, improving localization, as a bat approaches a target of culinary interest, such as a moth.
Ultrasound transducers emit many pulses of sound per second, which constitutes the pulse repetition frequency.3 It can be thought of as similar to the frame rate on a video camera, and it is of importance in determining the temporal resolution in an image. Duty factor is a term that calculates the percentage of time the transducer is actually emitting pulses, which is substantially shorter than the time it spends receiving echoes. The total energy emitted by a transducer correlates directly with the duty factor and determines certain physical effects such as tissue heating.
Sound: Fundamental Principles and Its Behavior in Tissue
Speed of Sound
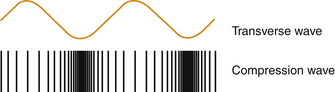
Sound is a traveling pressure wave. Unlike an ocean wave, in which the direction of the amplitude (vertical) is out of plane with the direction of travel (horizontal), sound waves consist of alternating compressions and rarefactions of molecules in the medium through which it travels (Fig. 1.10). Such changes can be measured by pressure, density, or particle vibration, all of which can be considered acoustic variables.3 As with any wave, sound has intrinsic detectable wavelengths, periods, and frequencies, all of which are interrelated. The speed of sound propagation, however, is not a property of the type of sound energy, but rather of the medium of transmission. Sound propagation speed is related to stiffness of a tissue, or more precisely, hardness. As such, it travels slowly in easily compressed gases, more rapidly in fluids and body tissues, and fastest in solids. An intuitive sense of sound propagation is readily derived from experience with a Slinky, a toy originally constructed of a wound coil of flexible metal (Fig. 1.11). Mechanical energy creates standing waves of alternating rarefactions and compressions of successive spirals of the coil; these waves travel faster if the coil is tightly wound with harder metal. Tightly wound Slinky toys travel down steps faster than less tightly wound and looser versions (e.g., plastic).
The variation of sound propagation in different materials is of significance both generally and clinically. An approaching train can be detected sooner by putting one’s ear to the rail than by listening through air for the sound it makes. On average, sound travels about four times faster through metal than through human soft tissue, which is minimally faster than through sea water, and in turn about four times faster than in air. The hardest substance known to man, diamond, also conducts sound the fastest at 12,000 m/s (Table 1.1).
| Material | Velocity (m/s) |
|---|---|
| Air | 331 |
| Fat | 1450 |
| Water (50° C) | 1540 |
| Human soft tissue | 1540 |
| Brain | 1541 |
| Liver | 1549 |
| Kidney | 1561 |
| Blood | 1570 |
| Muscle | 1585 |
| Lens of eye | 1620 |
| Tendon | 1650 |
| Ice | 3152 |
| Skull bone | 4080 |
| Brass | 4490 |
| Aluminum | 6400 |
| Diamond | 12,000 |
Ultrasound Range Finding
A key goal of ultrasound is an accurate representation of spatial characteristics of human tissues. To measure depth (range), ultrasound relies on the timing of the return echoes.3 As mentioned above, ultrasound makes a number of assumptions to calculate depth. It assumes that sound travels in a straight line from the transducer to the target and back, that enough echoes are reflected back to the transducer from relevant tissue structures to be captured and measured, and that the speed of sound in soft tissue is sufficiently consistent across tissues to generate an accurate measurement. In general these observations hold true, and particularly for the more superficial structures studied in neuromuscular ultrasound. In a fashion similar to an F-wave when performing electrodiagnostic studies,4 an echo reflects a round trip of sound from the transducer to the structure of interest, and back again to the transducer. All ultrasound instruments assume that sound travels through tissues at a constant rate of 1540 m/s, and images from echoes are constructed based on this calculation. It may be easier to understand this number expressed differently: for each centimeter of depth, the average round trip travel time for an echo in human soft tissue is 13 μs.3
The width on an ultrasound image represents the summed thickness of the individual transducer elements within a linear ultrasound probe (see Figs. 1.4 and 1.8).3 In some ways width measures in tissue may be slightly more accurate than depth measurements in that they do not assume constant sound speed in tissue. However, because width measures do not take refraction of sound into account, there can be distortion of width as sound passes through tissue layers of different sound transmission speeds, if these are oblique to the angle of insonation (see oblique echoes later).
For practical purposes, the variation of sound speed is rarely important. However, if someone is measuring the depth to the sacrum in two patients, one with minimal body fat and one with 7.5 cm of fat over the gluteus maximus (not unusual in obese patients as measured by EMG needle length), there would be a subtle effect. Ultrasound travels slower through fat than through the “average” human tissue, and as such, ultrasound tends to overestimate the thickness of a fat layer by about 6% (1541/1450), and underestimate the thickness of muscle by about 3% (1541/1585) (see Table 1.1).
It would be tempting to speculate that the speed of sound in nerves would be somewhat less than that of average human tissue because of its high fat content, but at this time this value is unknown. However, the speed of ultrasound in brain is 1541 m/s, and most nerves are sufficiently thin as to make any special adjustments for size moot. Special techniques, using ultrasound radiofrequency analysis for measuring body tissue and fat thickness may be of value for addressing questions of this type.7
Discrepancies in sound transmission speed affect area and volume measurements more than linear measurements because area is related to the square, and volume the cube, of the linear measurement. This may account for some of the slight variation in estimated thickness of muscle or fat by ultrasound and by other imaging modalities such as MRI or CT. At this time, standard volume measurements are not routinely calculated for muscle or nerve, but they are for internal organs based on a set of standard linear measures from 2D ultrasound. The kidneys,8 for example, use the product of 0.5{A-P diameter} × {transverse diameter} × {height} to produce a fairly reliable estimate of kidney volume. Adjustments for variations in speed of sound in neuromuscular tissue could be incorporated into mathematical models of this type when it becomes routine to calculate volumetric measurements.
Another factor that influences sound speed in tissue is temperature. This is most striking for fat—the warmer the temperature, the slower the sound speed—but the reverse holds true in other tissues, although to a lesser degree.9 In general, temperature effects are of limited significance during routine imaging. Of interest, there is some evidence that fat in humans simultaneously exists in solid, liquid, and melting phases, perhaps with a key transitional phase occurring at 35° C.10
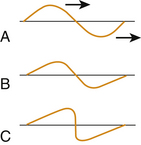
The Relationship Between Propagation and Harmonics
In practice, the propagation speed of a wave is not even. As the wave travels through any medium, its higher pressure component travels faster than its lower pressure component, so its progress through space is somewhat nonlinear.3,9 As a result, the wave acquires superimposed higher frequency harmonic components that increase over the distance covered (Fig. 1.12). Harmonic frequencies consist of multiples of the original or fundamental frequency of the sound. The concept is of clinical relevance in situations in which the primary frequency creates problematic artifacts. For example, sometimes when imaging deeper structures through ribs, there is less artifact with harmonic frequencies, and analyzing return echoes only at these higher frequencies may enhance the imaging of deep structures.
Attenuation
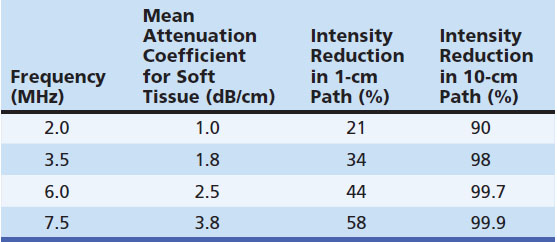
Attenuation refers to the reduction of sound intensity as it passes through tissue. Some of this energy is lost through reflection or backscatter, but the majority is lost through absorption of the sound energy.3,9 The degree of attenuation can be measured in several ways and is expressed as decibels (dB) of sound energy attenuated over distance (dB/cm). A number of factors influence attenuation and backscatter. For example, attenuation is frequency dependent, such that higher sound frequencies are dissipated through distance much quicker than lower frequencies (Table 1.2).3 Sounds in the audible range show similar properties, which is why blaring music in a passing car is heard primarily in lower-pitched base tones, and why thunder from distant lightning is a low-pitched rumble, whereas a nearby lightning strike has a high-pitched and ominous crack. The most critical principle explained by this phenomenon is that higher-frequency ultrasound has a lower effective depth of penetration for imaging than lower frequency.2,3,9
Each body tissue attenuates sound to a different degree (Table 1.3). The relationship between frequency and absorption in a given tissue is typically linear over standard ultrasound frequencies, with an increase in attenuation with higher frequencies. The slope of this effect, however, varies between different tissues10,11 and across species. In fact, the attenuation coefficient itself may not be entirely uniform for the same tissue in a different location in the same individual. For some tissues, such as tendon and skeletal and cardiac muscle, the attenuation coefficient nearly doubles if the tissue is imaged in a plane parallel to the direction of muscle (tendon) fibers as compared with a cross-sectional image.12 One might imagine how sound energy might be redistributed more easily among cellular molecules from insonating a small cross section of hundreds of muscle fibers, than insonating a few muscle fibers along their entire length.
Table 1.3 Attenuation Coefficients of Biologic Substances (at 1 MHz)
| Material | α(dB / cm) |
|---|---|
| Water | 0.0022 |
| Amniotic fluid | 0.0053 |
| 4.5% albumin | 0.019 |
| Blood | 0.18 |
| Fat | 0.63 |
| Brain | 0.85 |
| Liver | 0.94 |
| Kidney | 1.0 |
| Bone | 20 |
| Lung | 41 |
The phenomenon of absorption is critical for therapeutic applications of ultrasound. As sound energy is absorbed by tissue, it is converted to heat. Ultrasound therapy was introduced to the specialty of physical medicine and rehabilitation many years ago, specifically for this purpose. Because sound energy is more readily absorbed by tendons, ligaments, and bones, it is a means of providing direct heating to deep structures that are vulnerable to common musculoskeletal injuries3,13 and often the last to be warmed by surface heating. (Refer to other sources for further information about this type of therapeutic ultrasound.14–19) However, it should be noted that with increasing amounts of insonated energy, additional safety precautions are needed.20
One of the most interesting theoretic applications of ultrasound energy is the ability to activate microencapsulated drug release with an ultrasound beam.21–25 Microencapsulated drugs injected intravenously circulate throughout the entire body, but the capsules release the drug only in tissues being actively insonated, thereby significantly enhancing concentration at the target site. This approach can be used to quite selectively deliver drug to a tumor, for example, while minimizing its distribution in other healthier tissues. Other interventional applications of insonation and local microcavitation, such as enhanced healing of bone injury26–29 or as a tool to possibly facilitate muscle regeneration are under active study.29
Echo Behavior
Perpendicular Echoes and Acoustic Impedance
As sound energy courses through tissue it creates echoes. The simplest scenario to consider is one that involves a perpendicular incidence of the direction of the ultrasound sound wave to a smooth interface of two layers of tissues (Fig. 1.13). A significant portion of sound energy is transmitted and continues in the same direction. However, the reflected energy at this interface reflects back in the opposite direction directly toward the transducer.3 The amount of reflected energy is proportional to the difference of acoustic impedance of the two layers; the greater the difference, the greater the reflected energy. When looking through water at a jellyfish, the change in acoustic impedance between air and the surface of the water is much greater than that between water and the surface of the jellyfish. As such, the air-water boundary is much easier to discern than the water-jellyfish boundary, because more light is reflected at the former. The ratio of reflected to incident energy is the intensity reflection coefficient. The ratio of the transmitted energy to the incident is the intensity transmission coefficient. The sum of these two ratios is one (an assumption that assumes that there is very little if any absorption of sound energy at that particular barrier). Acoustic impedance, measured in rayls, relates to the speed of transmission of ultrasound in a particular tissue or layer. More thorough discussions of the complex topic of acoustic impedance, both characteristic and specific, can be found elsewhere.3,30–31
Oblique Echoes
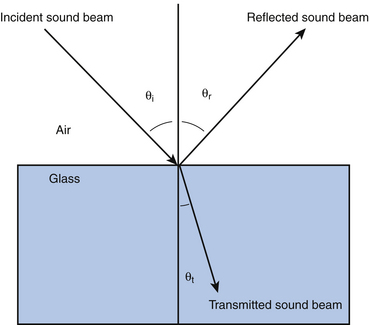
If the angle of incident sound is oblique, and the boundary is smooth, the angle of incidence and angle of reflection (compared to perpendicular) are equal—a phenomenon analogous to a pool ball ricochet.3,30–31 The angle of transmission is also related to acoustic impedance. If the deeper layer conducts sound faster than the superficial layer, the sound bends toward the boundary, and if it is slower, sound bends toward the perpendicular. These are examples of refraction (Fig. 1.14).
Scattering
Of course, smooth boundaries are not the rule in biologic tissues. Rough boundaries and heterogeneous materials tend to cause multidirectional transmission of incident sound (scattering) and reflection (backscattering).3,30–31 Most light reflectors are not smooth; a flashlight aimed at a wall can provide a diffuse dim light for a room because of its backscatter (Fig. 1.15). Fog, an example of heterogeneous materials in air, causes both scattering of transmitted light and backscattering of reflected light, which is why headlights set on high beam in fog are not the advantage they are in clear weather. Speckle is a consequence of the random backscattering of sound pulses in an imaged plane of tissue. These waves can interfere positively or negatively with each other or with waveforms that have been reflected perpendicularly back to the transducer, causing random decrements and enhancements of brightness, or speckle.
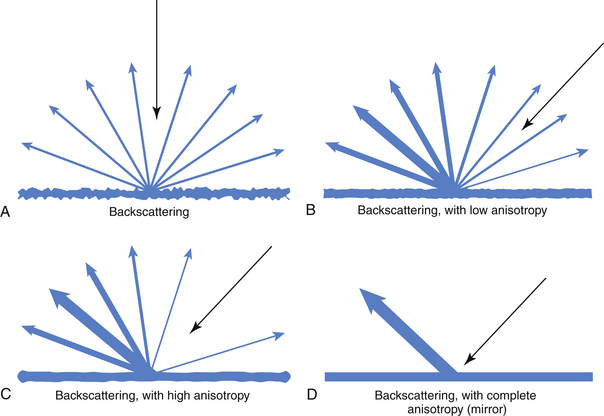
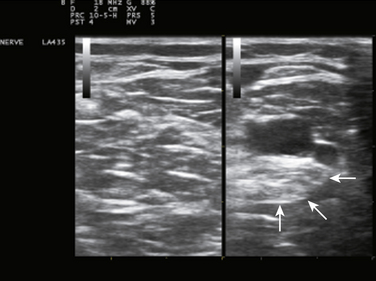
Fig. 1.15 This figure shows how structures with no (A), mild (B, as in nerve), marked (C, as in tendon), and complete (D) anisotropy reflect incident energy, showing an inverse relationship of backscattering to inherent anisotropy (structures with high anisotropy have little backscatter; see Fig. 1.23 for comparison).
Contrast Agents
Ultrasound contrast agents are examples of small heterogeneous materials that can be injected into tissues and cause a local increase in the echogenicity of tissue vasculature with multiple backscattered echoes. Unlike radiographic contrast agents (intravenous pyelography dye) or MRI contrast agents (gadolinium) that work in solution and can demonstrate leakage of contrast into perfused tissues, the echogenicity of ultrasound contrast agents is based on their reflective properties, which means that they must be particulate, too large to cross capillary gaps, and too small and too pliable to obstruct blood flow. Typically these consist of microbubbles of gas encapsulated within a lipid or protein.22,32,33 As such, they can demonstrate areas of increased blood flow within tissue, but not areas of capillary leakage. Of interest, unlike other contrast agents, intravascular adhesion and retention of microbubbles may occur in areas of vascular wall inflammation.32,33 Thus vascular wall changes that lead to fibrinogen or platelet adhesion and clot formation may be more sensitively detected by certain types of ultrasound contrast agents than by soluble contrast materials used in MRI and CT. It is possible that ultrasound contrast may find new applications in neuromuscular disorders such as inflammatory muscle or nerve disease.
Focusing
Ultrasound beams can be focused in one dimension to minimize beam width (the width of the sound out of plane with the image created).3,30,31 This type of focus is different than optical focusing, which occurs in three dimensions, a property readily demonstrated with paper, a magnifying glass, and bright sunlight. The end result of ultrasound focusing, like optical focusing, is enhanced resolution. By narrowing the width of the sound, there is a reduction in the out-of-plane averaging that takes place within an image, and therefore resolution is improved. For imaging focal swelling in a nerve in a cross-sectional image, this property is of value because it allows for more precise identification of the point of maximal enlargement of the cross-sectional area of the nerve. Focusing can be done by shaping the array in a convex fashion, phasing the sound wave pulses of the individual elements in the transducer and by careful study of the natural focusing that follows any sound beam. Multiple focal zones can be obtained in some images, but this requires that different pulses are used for different focal distances, which therefore reduces the frame rate (see temporal resolution).
For the ultrasonographer, the optimal focus of the ultrasound beam is often illustrated on screen by a small arrow to the right of the image (see Fig. 1.6). It points to the depth where the image quality is typically optimal, and can be adjusted in terms of depth and in terms of how thick the band of focus is. When measuring small structures, such as nerves, it is important to optimize the focus to the appropriate depth. For example, when following the median nerve from the wrist through the forearm, several changes in focal depth are necessary to optimize the image of the nerve as it passes under the flexor digitorum superficialis and then the pronator teres.34 Novice clinicians frequently forget to adjust the focal zone, an error that makes following a nerve as it approximates the surface or dives beneath muscles more challenging. More detailed discussions of probe design and focusing are available elsewhere.3,30,31
Resolution
The goal of ultrasound is optimizing resolution of structures of interest. An objective test of this ability can be provided by a phantom, which is conceptually similar to an eye chart. A phantom is any type of tissue model that can be scanned.3 Such items often are agar filled, with suspended smaller objects that simulate tissue structures that can be readily imaged with ultrasound, and different designs are available for purchase. The ability to resolve such smaller items (either objects in the phantom or letters on an eye chart) is a measure of resolution. A phantom can be used to compare resolution of different transducers and different instruments.
Temporal resolution in ultrasound refers to the ability of ultrasound to discriminate quick motions in tissue.3 Higher frame rates allow for better imaging of motion and smoother definition of it. Higher temporal resolution involves narrower focuses and reduction of persistence and averaging of images. The latter provide a means of controlling random artifacts such as speckle, but tend to reduce temporal resolution. Because the quality of a static image is easily compared with MRI or CT, there is a bias to design ultrasound instruments to maximize static image quality. Interventional/vascular radiologists and clinical subspecialists have provided much of the impetus for real-time motion and blood flow detection. Given the complexity and flexibility of ultrasound instrumentation, enhancements in temporal resolution are not only possible but may be critical for studying subtle quick movements, such as fibrillation potentials in muscle,35 and adaptive instrument design may be of future value.
Ultrasound Instrument Function: Driving the Transducer and Image Display
Efferent Ultrasound Functions: Beam Formers, Pulsers, Coded Excitation, Amplifiers, and Transmit/Receive Functions
The efferent functions of ultrasound instruments are simpler than its afferent functions and begin with the beam former.3,33,34 The generation of a sound pulse requires several devices. The first is a pulser that takes power line electricity and translates it into brief pulses of voltage. The device is not dissimilar to the stimulator on an EMG machine, which delivers single or multiple timed pulses of voltage or amperage of a set duration. In the ultrasound instrument, however, this is somewhat more complex. Ultrasound probes consist of arrays of piezoelectric transducer elements, and each element receives a separate input from the pulser (one per scan line). As such, an ultrasound instrument’s pulser operates hundreds of channels, rather than the single or dual stimulator systems found in most electrodiagnostic instruments (see Fig. 1.8). To further complicate the process, for the purposes of multiple focusing and image enhancement there are often coded timing variations (coded excitation) in the order in which the transducers are activated. Thus a series of pulse delay switches are automatically built into the instrument.
In tandem with the pulser is the amplifier, which determines the intensity of the insonated sound. Once the pulse sequences are ready for relaying to the transducer, there is a final gate. This is a transmit/receive switch in the instrument that following each pulse sequence automatically switches off the emit (efferent) function of the transducer and turns on its receive (afferent) function, so it can analyze returning echoes. The transducer is in the receive mode the vast majority of the time—typically 99.0% to 99.9% of the time—although more emit time is required for Doppler imaging. Pulse duration, sequencing, and on/off time cycles are preset based on the type of imaging (Doppler versus B-mode), transducer type, focusing, and imaging depth used. Direct operator control is usually restricted, however, to only modulating the amplitude of the emitted signal.
Amplifiers and Time Gain Compensation
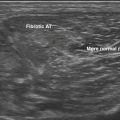
After the piezoelectric elements convert returning echoes into electrical impulses, they need to be amplified to create a display. Most instruments also contain a time gain compensation panel to modify the process when needed by the ultrasonographer. The echogenicity of unmodified distant echoes is much less than that of near echoes. This is because of the attenuation of ultrasound energy as it passes through tissue, both in transmission to the target and in reflection back to the transducer. As such, instruments are all designed to amplify later echoes based on a standard estimate of the degree of soft tissue attenuation (see Tables 1.1 and 1.2). However, some tissues cause more or less absorption of sound than the predetermined average, and in these cases, prudent adjustment of near and far gain on the time gain compensation panel can result in a more representative image of the structures of interest.3 Alternatively, adjustments are sometimes helpful for reducing noise from certain irrelevant layers in an ultrasound image. The time gain compensation panel (see Fig. 1.2), has a characteristic display control, and it controls the degree of amplification at different depth layers. Adjustments to this panel are most helpful when imaging through tissues that excessively attenuate sound, such as fibrous tissue, or fail to attenuate it, like cystic or vascular structures (Figs. 1.16 and 1.17).
Filters
Ultrasound instruments also use filters to enhance images. As mentioned, attenuation is frequency dependent, with higher frequency signals being disproportionately attenuated as sound traverses a distance. Also, sounds emitted by a transducer have a modest range or bandwidth of frequencies. As echoes return from deeper structures in tissue, the highest-frequency sounds are attenuated more than the lowest-frequency sounds in this bandwidth. As such, the ratio of high frequency noise to high-frequency signal is increased in deeper tissues. Many instruments selectively filter out more high-frequency sounds from the bandwidth for returning echoes of increasing latency, such as the ones from deeper layers.3 This graded use of the filter with depth improves the signal-to-noise ratio. Harmonic imaging can also be useful. As indicated, sometimes harmonics of the insonated frequency are less subject to distortion than the fundamental frequency, and this can be used to advantage in certain types of ultrasound imaging.
Persistence
Persistence is a form of image averaging over time in ultrasound that improves spatial resolution. This removes random speckle (the unpredictable echo changes that result from the positive or negative interference of backscattered sound), and other artifacts. However, as persistence increases, temporal resolution decreases.3 Instruments that appear to be ideal because of simplified panel configurations have more preset and unalterable imaging features. Such preset configurations may emphasize persistence and stability of an image, and therefore temporal resolution may be sacrificed. If the need of an instrument is to detect rapid tissue or needle movement, more setting flexibility may be helpful.
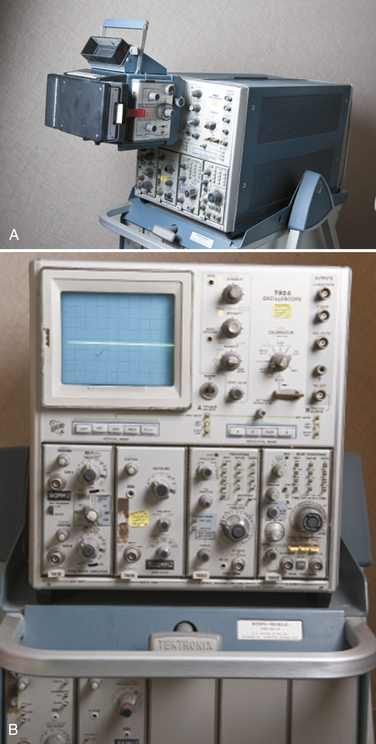
Amplitude (A)-Mode Imaging
Both EMG and ultrasound began with the use of oscilloscopes3,4 (Fig. 1.18) using a standard A-mode display. In A-mode a single line of ultrasound data only is displayed, with the X axis representing echo latency (which corresponds to distance or depth) and the Y axis representing echogenicity (e.g., echointensity amplitude). This should be familiar because it is the typical display for EMG or NCS, where the X axis is latency and the Y axis is amplitude of the electrical signal (voltage). For an electromyographer it can be puzzling to understand how ultrasound evolved into a real-time 2D image, while EMG has remained as a single real-time linear display. With ultrasound, a change in amplitude comes from an echo, which is generated by a fixed anatomic structure in a distinct spatial and temporal relation to the transducer’s incident sound pulse. With electrodiagnosis, a change in amplitude comes from measurable progressive ion movements along the length of excitable tissues within any radius of the recording electrodes. Although it is possible to triangulate bioelectrical signals and to localize them accordingly, this is complex and not routinely performed with electrodiagnostic instruments. The key difference is that in ultrasound, amplitude variations (echoes) occur in a temporal pattern determined by the location of the reflecting anatomic structure, which immediately lends itself to spatial display. In electrodiagnosis, spatial relationships can only be inferred.
Compression
Displaying amplitude as brightness instead of vertical displacement is somewhat more problematic than one might expect. The human eye can readily distinguish subtle variations in height but distinguishes variations in light intensity poorly by comparison. Further, although there is a direct linear relationship between measured and perceived height, the relationship between measured and perceived brightness is exponential36 and intuitively much less clear. A simple experiment helps clarify this. In the dark, a single flashlight has a substantial effect on the ability to see, an effect that is far from doubled by the addition of a second flashlight. In fact, it is not clear exactly how many flashlights would be needed to double the perceived intensity of ambient light. As a result, to represent brightness on a display screen in a proportionate way, it cannot simply be linear; it must be an exponential increase. Furthermore, the increase needs to be adjusted to compensate for any pupillary constriction that accompanied the increased brightness. Not surprisingly, there are no simple formulas for doing this in such a way as to provide the same intuitive sense of proportion of height and amplitude as in A-mode. Of interest, the formulas used for determining how amplitude is translated into brightness vary from manufacturer to manufacturer and instrument to instrument, and are often empirically determined by image aesthetics of select tissues of the manufacturer’s choice.
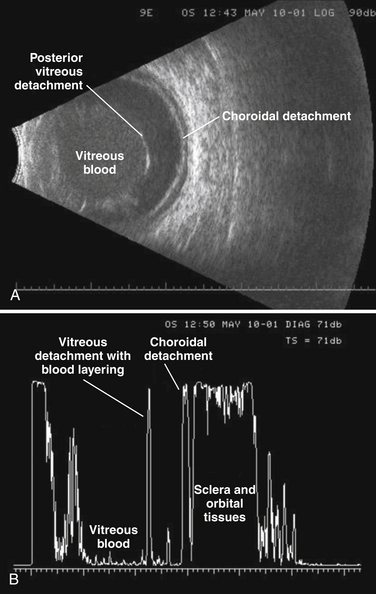
A-mode is commonly used in ultrasound of the eye and orbit.37 The technique provides a more quantitative approach to assessing echogenicity. It not only provides an accurate assessment of reflective strength from structures within the eye but also a means of comparing reflective strength from a known ocular structure (such as the posterior scleral wall) and that of an unknown mass within the eye. Unlike B-mode gray scale parameters, A-mode amplitude to decibel ratios (compression metrics) are standardized across different instruments and manufacturers in ophthalmology ultrasound devices. There remain problems, however, with ceiling effects of the display as apparent in Figure 1.19. At this time, A-mode is not routinely available on most commonly used nonophthalmology instruments.
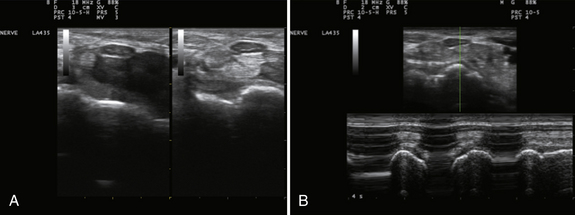
M-Mode Imaging
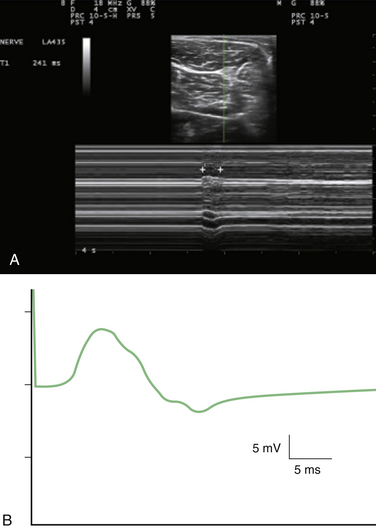
M-mode is useful for measuring latency changes in moving tissue. This technique depends on selecting a single channel of information from B-mode ultrasound and displaying how it changes over time (Fig. 1.20).3 This display is more like an electrocardiogram (ECG) tracing, with the time base measured in tenths of seconds. This technique can be used to measure muscle contraction or fasciculation contraction time.35 It should be noted that electrodiagnostic techniques measure the duration of the muscle action potential, which is a surface membrane–only event lasting on the order of 10 ms, whereas ultrasound measures actual mechanical contraction and relaxation time, on the order of 200 to 300 ms.
Digital Conversion
All modern ultrasound instruments use analog digital conversion to display signals. This permits averaging for persistence as well as for interpolation or smoothing.3 Such adjustments can affect perceived echogenicity. Some instruments provide user control of these functions, and adjusting these controls may help enhance imaging of different types of structures.
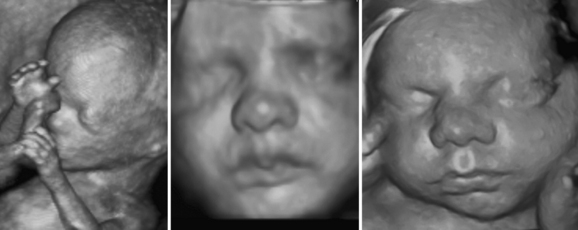
3D and 4D Imaging
With computer-based technology, 2D images can be reconstructed into 3D and 4D images. The technique is at its most dramatic when creating realistic videos of fetal facial expressions and movement. The presence of a face surrounded by amniotic fluid is an ideal environment for the technology (Fig. 1.21).3 In clinical practice, however, most ultrasound imaging is still done in 2D planes (although technically this is really 3D imaging—depth, width, and time). Video is not routinely included in most published ultrasound papers and 3D images are relatively uncommon. As such, readers of the literature do not routinely find such images other than as online supplements.38 At this time little has been published on the use of 3D imaging in nerve or muscle.
Color Doppler
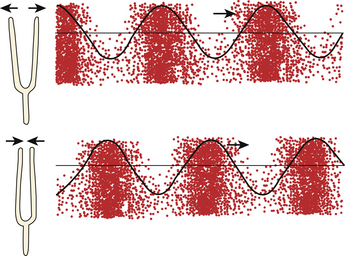
Many ultrasound instruments have the capacity to demonstrate tissue movement and blood flow using the Doppler effect.3 The Doppler effect is a change of the frequency of sound energy by a moving object, familiar as the increasing pitch of a train whistle as a train approaches (and its decreasing frequency as it recedes). Returning echoes demonstrate a similar effect, and Doppler principles are used to generate the timing mechanisms of automatic sliding glass door openers.
The physics of ultrasound Doppler are complex and its details are beyond the scope of this text because at this time few papers have been published on blood flow or tissue motion in nerve or muscle. Nonetheless, this is an area of likely growth in the field of neuromuscular ultrasound. Initially much of the focus of color Doppler was on the detection of abnormal vascular blood flow, for the purpose of identifying critical occlusion or pending occlusion of major vessels. For the purpose of neuromuscular ultrasound, it turns out that most of the information is coded by 2D dimensional color-flow Doppler or Doppler power displays. When examining tissue, such as nerve, for increased blood flow, it is often helpful to use power Doppler imaging. This type of imaging is less subject to noise contamination, and is better for detecting slow flow and looking at smaller or deeper vessels than spectral Doppler imaging. The results of Doppler power displays are mainly qualitative and may vary somewhat across instruments. Nonetheless, these displays provide a simple and reliable means for assessing for the presence or absence of changes in tissue vascularity. Of interest, ultrasound color allows for information coding in terms of hue and saturation in addition to brightness (luminance), and color displays therefore allow for coding of useful information not available from simple gray scale imaging. Future Doppler technology may assist in the assessment of muscle contraction and nerve movement. Readers wishing to explore color Doppler imaging in greater detail may find Frederick Kremkau’s textbook a useful starting point.3
Image Storage and Manipulation
Many modern instruments can store a final image and allow postprocessing manipulations.3 At their simplest these include annotation (arrows and text) and distance measurements, but many instruments can further alter the display by changing other features such as gray scale and compression. Such properties are useful for record keeping and research.
Quantifying Ultrasound Findings
Spatial Dimensions of Tissue
Ultrasound instruments are ideal for measuring spatial variables such as thickness, width, depth, area, and volume. Edge-to-edge resolution with ultrasound is more precise than that obtained with CT or MRI, and all instruments are designed to make measuring spatial parameters simple and quick. In practical use a few simple linear measures of structures such as the kidneys can be used to estimate kidney volume based on formulas established in cadaveric studies,8 but similar formulas have yet to be developed for muscle or nerve. A few caveats are warranted with linear measures: The first is that depth measurements are based on the speed of sound in tissue, and this varies slightly among different types of tissue. Width measurements depend on the assumption that ultrasound waves are transmitted through tissue in a straight line, yet refraction does occur when sound crosses planes of tissue with different acoustic impedance (such as muscle and fat). In calculating volumes, any linear errors of measurement are magnified by multiplying width, length, and depth, which should be corrected for if comparing ultrasound volume measurements with CT or MRI. Measurement error in ultrasound therefore is minor and, to some extent, predictable. Understanding ultrasound physics can be useful in addressing such minor errors if clinically indicated.
Quantifying Tissue Movement
Although ultrasound provides accurate estimates of the movement of blood in the cardiovascular system readily and quickly,3 solid tissue movement is not easily calculated39 This does not necessarily imply that tissue movement is more difficult to measure than blood movement, but rather reflects the years of engineering invested in ultrasound technology for studying hemodynamics. Although ultrasound-based calculations of blood flow are not exact measurements they are reliable enough surrogates to be used routinely in clinical decision making. Nerves and muscles move, including fasciculations, fibrillations, nerve subluxation, and nerve sliding, and standard ways to measure these movements have yet to be developed. Descriptive rating scales are occasionally used and can be reliable even if they are not fully validated. Research in this area is progressing, however, and in the future more quantitative measures of muscle and nerve movement may become standardized using technology such as color tissue Doppler imaging.
Quantifying Echogenicity
Since Heckmatt and Dubowitz40 described the increased echogenicity of affected muscles in Duchennes muscular dystrophy 30 years ago, investigators have been intent on finding ways to measure echogenicity. Despite the substantial improvements in instrumentation in these three decades, quantifying echogenicity remains problematic. The reasons for this relate to the tension between the use of ultrasound to optimize image aesthetics and the use of ultrasound to measure physical parameters of insonated tissue. Antiglare sunglasses are a useful analogy. These reduce apperception of total light intensity (glare) in one’s environment for the benefit of enhancing the ability to see objects within it; a trade-off most users feel is worthwhile. A similar trade-off has been made with current ultrasound instrumentation, but such an approach has drawbacks.
Ultrasound instruments are designed to maximize tissue recognition and diagnosis. Recognition is defined as an awareness that something perceived has been perceived before (e.g., recognition). This definition is similar to what we typically mean by diagnosis, in which it is implied that we have seen a similar disease pattern before. Although it would seem that quantifying the physical aspects of one’s environment would go hand in hand with recognizing it or perceiving it, in fact, they are by no means equivalent. This distinction is a focus of an entire field, Gestalt psychology, which explores the nature of recognition. In the world of human experience, quantifiable aspects of sensation are separate from the more subjective aspects of perception:
Ultrasound instruments have been designed to maximize perceptual discrimination, not pure sensory discrimination. This process, by design, sacrifices accurate representation of tissue echogenicity if it detracts from accurate perception. In like manner, human eyes sacrifice brightness discrimination by the design of the pupillary reflex, which constricts or dilates the pupil to minimize the distracting effects of changes in ambient illumination. Further, some quantifiable visual variables are of greater importance than others in daily life. For example, size discrimination is, in general, of greater importance than brightness discrimination. A 10-fold variation in brightness of the environment, which happens commonly because of relative cloud cover, does little to influence behavior, but a 10-fold variation in the size of a nearby primate demands immediate attention (Fig. 1.22).

Different ultrasound instruments use different algorithms to relate display brightness to echogenicity, and these are not standardized across instruments. Only in A-mode instruments used for ophthalmologic examinations has there been an attempt by manufacturers to adhere to an imaging standard in this regard. Of course, brightness is also easily manipulated by angle of insonation (see Tissue Anisotropy, as follows), gain or power settings, time gain compensation settings, and selection of transducer frequencies. Further complicating the display of brightness is the influence that tissue parameters have on brightness display; thicker layers of fat, skin, or overlying tissues by necessity will alter the intensity of echoes returning from a deep structure, and it is difficult to compensate accurately for such effects. Given the multiplicity of these variables, the display of echogenicity has been used to primarily enhance resolution rather than as a measure of the intensity of reflected echoes.
Of interest, the amplitude/intensity problem has a parallel in electrodiagnosis. The changes in the amplitude of electrically recorded signals from nerve or muscle tend to convey much less information than do changes in their temporal profile. For example, the placement of surface or needle electrodes has profound effects on amplitude.4 Slight movements of surface electrodes may change the recorded compound muscle action potentials by 50% or more, and slight EMG needle movements lead to even more profound motor unit action potential changes. Such movements have relatively little effect on latencies, conduction velocities, durations or interpotential intervals,4 parameters, free of such random variation, that are more likely to convey meaningful information regarding pathology than signal amplitudes. Furthermore, selection of different filter settings, thickness of intervening skin and fat, or even directional changes in needle electrodes, all have profound influences on recorded amplitudes in a fashion not dissimilar to that seen with ultrasound. Electrodiagnostic instruments are designed to measure amplitudes (intensity) more precisely than ultrasound instruments, but in fact, even when amplitude is measured accurately, it is not as informative as temporal data.
Artifacts
Tissue Anisotropy
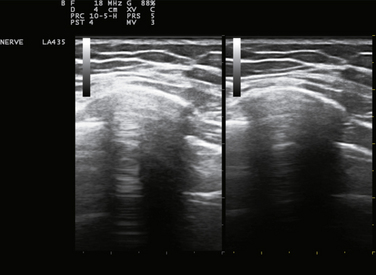
Tissue anisotropy can create an apparent artifact, but actually, it turns out to be a rather valuable aspect of ultrasound imaging. Each tissue is different in terms of how it reflects light. Some create much more backscatter3 (Fig. 1.23; also see Fig. 1.15) and some act more like mirrors, reflecting almost all the incident sound at an angle equal to the angle of incidence in reference to a central axis. Tissues that have high levels of backscattering have low anisotropy and tend to look the same regardless of the angle of incident sound, whereas tissues that act more like a pure reflector and have high anisotropy look much brighter when the transducer is perpendicular and much darker when it is not. Unlike routine MR or CT images in which the directional source of imaging energy is relatively constant, with ultrasound subtle changes in the angle of incidence of the transducer reveal variations in anisotropy in tissue (see Fig. 3.4), can help distinguish different types of adjacent tissues, such as tendon (high anisotropy) and nerve (low anisotropy). This relationship is demonstrated in Figure 1.23. Skilled ultrasonographers use these shifts in transducer angle to provide valuable eye-hand feedback that not only helps interrogate tissue but also interprets what is reflected back.
Shadowing
Other artifacts result from signal attenuation. A classic example occurs with calcified tissues, such as calcific arteries. These tissues do not transmit any sound and either reflect it back to the transducer or backscatter it in other directions. As such, no returning echoes are seen deep to the calcific tissue, but instead a shadow appears with linear edges.3 Shadows are useful because few changes in tissue are dense enough to cause them to appear, and they immediately draw attention to pathology (see Fig. 1.16).
Enhancement
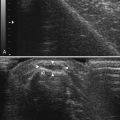
Enhancement is the inverse of shadowing. Some structures, for example cysts, generate no echoes and transmit virtually all the sound energy that is directed through them (see Table 1.2). This tends to make the structures immediately deep to the cyst appear brighter.3 This is because the instrument is programmed to expect a certain loss of sound energy as it passes through tissue, and when this does not occur, the default mechanism of the instrument displays the result as distal enhancement. Recognition of this phenomenon is useful in drawing conclusions about the tissue superficial to the enhancement. Increased echogenicity deep to a structure raises the possibility that it is a cyst or vascular structure (see Fig. 1.17). Color flow Doppler is often helpful in distinguishing between static fluid in a cyst and slow flowing blood, as in the case of arteriovenous malformations or pseudoaneurysms. This distinction is best made before performing a needle aspirate of a suspected cystic lesion.
Other Artifacts
Reverberation artifact occurs when the transducer or some superficial tissue structure acts as a sound reflector (Fig. 1.24).3 The effect, like looking into a three-way mirror, causes multiple equally spaced images of a reflection to appear. These have a naturally artifactual appearance and are generally easy to recognize. Other artifacts occur but generally are self evident. Like their counterpart of optical illusions studied by psychologists, understanding ultrasound artifacts can enhance practical appreciation of the mechanics of ultrasound display.
Practical Considerations Regarding Neuromuscular Ultrasound
Service and Training
For novice users in particular, but for all users, access to service and the stability and quality of ultrasound representatives are considerations in selecting an instrument. For physicians in large group practices or academic centers, there is often an ultrasound manufacturer that already has an institutional presence, and this is a good place to start when looking at instruments. An established representative tends to be available and in a strong position to discount the instrument or to provide attractive lease or used equipment options. The representative also provides a standard for comparing other potential vendors (and representatives). An unsatisfactory representative can lead to difficulties that negate many technical advantages available on an instrument, so this aspect of equipment purchase should not be overlooked. It should be noted that relatively few representatives at this time understand the nature of neuromuscular ultrasound, and educating them will help them demonstrate aspects of the instrument that are most relevant to neuromuscular patients.
Training EMG Technologists in Ultrasound
The American Association of Neuromuscular and Electrodiagnostic Medicine (AANEM) is working on standards of training suitable for physicians who wish to perform neuromuscular ultrasound.42
Safety
Ultrasound is the safest imaging modality in use, and there are few, if any, reports of any physical harm resulting from the technique.3 It is the standard imaging procedure for looking at the fetus. The theoretic risk of ultrasound relates to its ability to heat tissues. Of tissue, perhaps the most vulnerable to ultrasound is the eye.43–45 With even very brief bursts of high-intensity ultrasound, cataracts may be induced. Imaging the optic nerve or eye requires that the ultrasonographer be well versed in the proper instrumentation for the procedure and its risks. Temperature probes or hydrophones are available to measure heat increases in tissue and ambient sound energy for those wishing to quantify thermal effects of ultrasound imaging.
Who Should Acquire an Ultrasound Instrument?
This book highlights the role of ultrasound in the evaluation of a variety of common neuromuscular disorders. Any physician who practices electrodiagnostic medicine, or who sees patients with common neuromuscular problems, is likely to improve the care of patients by acquiring an instrument and learning how to use it. Not only is it useful for identifying neuromuscular pathology, it also has the potential to identify musculoskeletal pathology in those with normal electrodiagnostic studies. Those with a responsibility for educating students or residents will find that the instrument significantly enhances their appreciation of local anatomy and stimulates an interest in pathology. The experience at the author’s academic electrodiagnostic laboratory has shown that ultrasound has helped residents learn electrodiagnosis in a more flexible and less rote manner, and enhances their ability to participate in interventional procedures such as botulinum toxin or steroid injections. The ability to have ready access to the instrument while seeing patients who might benefit from imaging, and the presence of a suitable amount of time and inclination for a physician to master the learning curve are critically important (Fig. 1.25). Given the growing quality of imaging instruments and rapid growth of imaging technology, it is likely that imaging will occupy an increasingly important role in the diagnosis and management of patients in the future, and experience with ultrasound will be invaluable in promoting better use and interpretation of more sophisticated imaging technologies such as positron emission tomography (PET), MRI, or CT. Given the current price and advantages of ultrasound imaging equipment, those interested in neuromuscular imaging would be ill-advised to delay incorporating this technology into their clinical practice.
Conclusion
Like EMG, ultrasound is an active, interrogatory technology. There is something fundamentally different about looking at a frozen image on a screen and actually performing a study in real time. In part, this is because of the motion of the transducer and kinesthetic feedback involved in holding it, elements that contribute to our ability to inform vision. The image that we see when performing ultrasound is more than just a series of brighter and darker pixels on our retina, it’s a cortically derived reconstruction of space reconstructed from a series of multiple angles and movements of the transducer and of tissue. Studies of how humans view a complex structure, such as the face, reveal that it is composed of a mosaic of multiple eye movements taking in not just an image, but multiple close-ups and wide angle views of the finished whole.46 Felipe Fernandez-Armesto,47 in Truth, A History and Guide for the Perplexed uses a lyrical metaphor in this regard that expresses the process eloquently. Although he talks about viewing the past, the language describes seeing with ultrasound as well:
In fact, ultrasound imaging is just that, reconstructing a multidimensional concept from many viewpoints. Unlike CT or MRI in which these viewpoints are predetermined and based only on static images, ultrasound provides a freehand look at mobile structures from whatever perspectives the ultrasonographer chooses. Those wishing to couple this freedom with their wit and imagination are those who will contribute most to the care of their patients and the evolution of the field.
1. Hughes H.C. Sensory exotica. In a world beyond human experience. Boston: MIT Press; 2001.
2. Brandt W.E. The core curriculum: ultrasound. Philadelphia: Lippincott, Williams & Wilkins; 2001.
3. Kremkau F.W. Diagnostic ultrasound: principles and instruments. St. Louis: Saunders; 2002.
4. Kimura J. Electrodiagnosis in diseases of nerve and muscle: principles and practice. New York: Oxford; 2001.
5. Lee J.T., Fang T.D., White R.A. Applications of intravascular ultrasound in the treatment of peripheral occlusive disease. Semin Vasc Surg. 2006;19:139-144.
6. Papadakis E.P. Ultrasonic instruments and devices: reference for modern instrumentation. San Diego, Calif: Academic Press; 1999.
7. Ng J., Rohling R., Lawrence P.D. Automatic measurement of human subcutaneous fat with ultrasound. IEEE Trans Ultrason Ferroelectr Freq Control Soc. 2009;56:1642-1653.
8. Grant M., Baxter P.S.S. Ultrasound of the urogenital system. New York: Thieme; 2006.
9. Duck F.A., Baker A.C., Starrit S.H. Ultrasound in medicine. London: Institute of Physics (IOP); 1998.
10. Maruvada S., Shung K.K., Wang S.H. High-frequency backscatter and attenuation measurements of selected bovine tissues between 10 and 30 MHz. Ultrasound Med Biol. 2000;26:1043-1049.
11. Bushong S.C., Archer B.R. Diagnostic ultrasound. St. Louis: Mosby Yearbook; 1991.
12. Christopher Rowland Hill JCBGH. Physical principles of medical ultrasonics. Hoboken, NJ: Wiley; 2004.
13. Draper D.O., Quillen W.S. Therapeutic modalities in rehabilitation. New York: McGraw-Hill; 2005.
14. Al-Kurdi D., Bell-Syer S.E., Flemming K. Therapeutic ultrasound for venous leg ulcers. Cochrane Database Syst Rev. (1):2010. CD001180
15. Baba-Akbari S.A., Flemming K., Cullum N.A., Wollina U. Therapeutic ultrasound for pressure ulcers. Cochrane Database Syst Rev. 3, 2006. CD001275
16. Baker K.G., Robertson V.J., Duck F.A. A review of therapeutic ultrasound: biophysical effects. Phys Ther. 2001;81:1351-1358.
17. Laing S.T., McPherson D.D. Cardiovascular therapeutic uses of targeted ultrasound contrast agents. Cardiovasc Res. 2009;83:626-635.
18. Robertson V.J., Baker K.G. A review of therapeutic ultrasound: effectiveness studies. Phys Ther. 2001;81:1339-1350.
19. Speed C.A. Therapeutic ultrasound in soft tissue lesions. Rheumatology (Oxford). 2001;40:1331-1336.
20. Batavia M. Contraindications for superficial heat and therapeutic ultrasound: do sources agree? Arch Phys Med Rehabil. 2004;85:1006-1012.
21. Karshafian R., Bevan P.D., Williams R., et al. Sonoporation by ultrasound-activated microbubble contrast agents: effect of acoustic exposure parameters on cell membrane permeability and cell viability. Ultrasound Med Biol. 2009;35:847-860.
22. Stride E. Physical principles of microbubbles for ultrasound imaging and therapy. Cerebrovasc Dis. 2009;27 2(Suppl)):1-13.
23. O’Neill B.E., Vo H., Angstadt M., et al. Pulsed high intensity focused ultrasound mediated nanoparticle delivery: mechanisms and efficacy in murine muscle. Ultrasound Med Biol. 2009;35:416-424.
24. Liu H.L., Chen W.S., Chen J.S., et al. Cavitation-enhanced ultrasound thermal therapy by combined low- and high-frequency ultrasound exposure. Ultrasound Med Biol. 2006;32:759-767.
25. Pitt W.G., Husseini G.A., Staples B.J. Ultrasonic drug delivery: a general review. Expert Opin Drug Deliv. 2004;1:37-56.
26. Busse J.W., Kaur J., Mollon B., et al. Low intensity pulsed ultrasonography for fractures: systematic review of randomised controlled trials. BMJ. 2009;338:b351.
27. Lerner A., Stein H., Soudry M. Compound high-energy limb fractures with delayed union: our experience with adjuvant ultrasound stimulation (exogen). Ultrasonics. 2004;42:915-917.
28. Nussbaum E. The influence of ultrasound on healing tissues. J Hand Ther. 1998;11:140-147.
29. Rantanen J., Thorsson O., Wollmer P., et al. Effects of therapeutic ultrasound on the regeneration of skeletal myofibers after experimental muscle injury. Am J Sports Med. 1999;27:54-59.
30. Hoskins P. Diagnostic ultrasound: physics and equipment. London: Greenwich Medical; 2002.
31. Szabo T.L. Diagnostic ultrasound imaging inside out. Burlington, Mass: Elsevier; 2004.
32. Zhao S., Kruse D.E., Ferrara K.W., Dayton P.A. Selective imaging of adherent targeted ultrasound contrast agents. Phys Med Biol. 2007;52:2055-2072.
33. Zheng H., Kruse D.E., Stephens D.N., et al. A sensitive ultrasonic imaging method for targeted contrast microbubble detection. Conf Proc IEEE Eng Med Biol Soc. 2008:5290-5293.
34. Walker F.O. Neuromuscular ultrasound. Neurol Clin. 2004;22:563-590.
35. van Baalen A., Stephani U. Fibration, fibrillation, and fasciculation: say what you see. Clin Neurophysiol. 2007;118:1418-1420.
36. Stevens S.S. On the psychophysical law. Psychol Rev. 1957;64:153-181.
37. Byrne S.F., Green R.L. Ultrasound of the eye and orbit. Philadelphia: Mosby; 2002.
38. Marek T., Zelizko M., Kautzner J. Images in cardiovascular medicine: real-time 3-dimensional transesophageal echocardiography imaging: adult patent ductus arteriosus before and after transcatheter closure. Circulation. 2009;120:e92-e93.
39. Coppieters M.W., Hough A.D., Dilley A. Different nerve-gliding exercises induce different magnitudes of median nerve longitudinal excursion: an in vivo study using dynamic ultrasound imaging. J Orthop Sports Phys Ther. 2009;39:164-171.
40. Heckmatt J.Z., Dubowitz V., Leeman S. Detection of pathological change in dystrophic muscle with B-scan ultrasound imaging. Lancet. 1980;1:1389-1390.
41. Gibson J.J. The useful dimensions of sensitivity. Amer Psychol. 1963;18:1-15.
42. Walker F.O., Alter K.E., Boon A.J. Qualifications for practitioners of neuromuscular ultrasound: position statement of the American Association of Neuromuscular and Electrodiagnostic Medicine. Muscle Nerve. 2010;42:442-444.
43. Silverman R.H., Lizzi F.L., Ursea B.G., et al. Safety levels for exposure of cornea and lens to very high-frequency ultrasound. J Ultrasound Med. 2001;20:979-986.
44. Coleman D.J., Lizzi F.L., Jakobiec F.A. Therapeutic ultrasound in the production of ocular lesions. Am J Ophthalmol. 1978;86:185-192.
45. Barnett S.B., Rott H.D., Ter Haar G.R., et al. The sensitivity of biological tissue to ultrasound. Ultrasound Med Biol. 1997;23:805-812.
46. Kano F., Tomonaga M. How chimpanzees look at pictures: a comparative eye-tracking study. Proc Biol Sci. 2009;276:1949-1955.
47. Fernandez-Armesto F. Truth, a history and guide for the perplexed. New York: St. Martin’s Press; 1997.