[level-membership-for-neurosurgery-category]
1 Autoregulation and Hemodynamics in Human Cerebrovascular Disease
Normal cerebral hemodynamics and energy metabolism
Normal Values of CBF and CMR
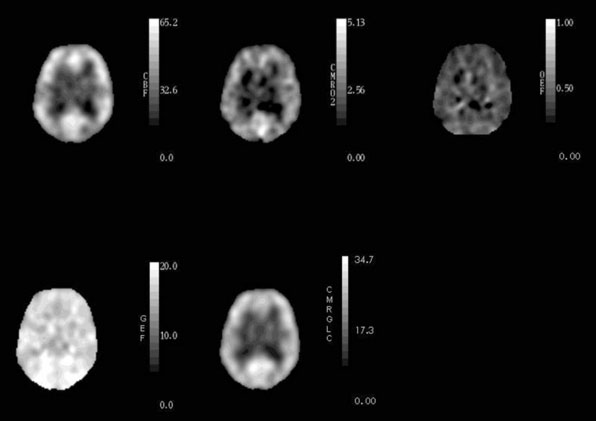
Healthy young adults have an average whole-brain cerebral blood flow (CBF) of approximately 46 ml 100g−1 min−1, cerebral metabolic rate of oxygen (CMRO2) of 3.0 ml 100g−1 min−1 (134 μmol 100g−1 min−1), and cerebral metabolic rate of glucose (CMRglc) of 25 μmol 100g−1 min−1.1–4 The CMRO2/CMRglc molar ratio of 5.4 is lower than the value of 6.0 expected for complete glucose oxidation due to the production of a small amount of lactate by glycolysis that occurs even with abundant oxygen supply.1,3,5 CBF in gray matter (80 ml 100g−1 min−1) is approximately four times higher than in white matter (20 ml 100g−1 min−1).6 Under normal physiological conditions, regional CBF is closely matched to the resting regional metabolic rate of the tissue.7,8 Thus CMRO2 and CMRglc are also higher in gray matter than in white matter. Because of this relationship between regional flow and metabolism, the fraction of blood-borne glucose and oxygen extracted is relatively constant throughout the brain (Figure 1–1). The oxygen extraction fraction (OEF) is normally 30% to 40%, indicating that oxygen supply is two to three times greater than oxygen demand. The glucose extraction fraction (GEF) is normally about 10%.8,9
Many studies report that CBF declines from the third decade onward.10–13 The change in metabolic rate for oxygen and glucose with age is less clear, with several studies showing a decrease 10,12,14–16 and others showing no change.17–19 Studies that have corrected for brain atrophy show lesser or absent changes in CBF, CMRO2, and CMRglc in the remaining tissue with increasing age.15,20–22 Our own data corrected for brain atrophy from 23 normal subjects, ages 23 to 71 years, show no significant change in CBF or CMRO2, but a significant decline in CMRglc of 4% to 5% per decade.
Control of CBF
Regional CBF (rCBF) is regulated by rCPP and the regional cerebrovascular resistance (rCVR):

When there is a primary reduction in the metabolic demand of brain cells, such as that caused by hypothermia or barbiturates, arterial resistance vessels constrict to produce a comparable decline in CBF and thus little or no change in OEF or GEF.23–25 With normal physiological increases in neuronal activity, vessels dilate, producing an increase in regional CBF that is accompanied by an increase in regional CMRglc of similar magnitude, but with little or no increase in regional CMRO2.26–28 Acute changes in arterial pCO2 cause proportional changes in CBF. The mechanism for the change in CBF is a change in CVR produced by vasodilation with increased pCO2 and vasoconstriction with decreased pCO2.29 With prolonged hyperventilation, CBF returns toward normal values over a period of several hours.30 The effects of changes in arterial pO2 on the cerebral circulation show a threshold effect, different from the proportional changes seen with changes in pCO2. CBF does not increase until arterial pO2 is below about 30 to 50 mm Hg.31,32 A significant reduction in hemoglobin saturation and hence in arterial oxygen content (CaO2) does not occur until arterial pO2 falls to about 50 to 60 mm Hg, indicating that it is primarily CaO2 and not pO2 that determines CBF.31,33,34 Reductions in CaO2 due to anemia cause vasodilation and compensatory increases in CBF, whereas the increase in CaO2 with polycythemia is associated with a decrease in CBF.34 Acute changes in CaO2 produce less of an increase in CBF than do chronic changes.35,36 Hematocrit is an important determinant of viscosity, and thus viscosity and CaO2 often vary together. It is unlikely that viscosity is an important determinant of CBF under most circumstances, however. Increases in blood viscosity induce compensatory vasodilation to maintain cerebral oxygen delivery (CBF x CaO2).37–39 When pre-existing vasodilation impairs the ability of vessels to dilate further to changes in viscosity, this compensatory mechanism may be exhausted.40 Thus increases in CBF brought about by hemodilution, if they are simply reciprocal responses to changes in arterial oxygen content, will not increase cerebral oxygen delivery and may even decrease it.41
In contrast to the relationship of CBF to oxygen supply and demand, the balance between glucose supply and demand has little effect on CBF. Severe reductions in blood glucose down to 1.1 to 2.2 mmol/L produced modest but significant increases in CBF of 12% to 23%.42–46 This CBF response to severe hypoglycemia likely does not represent a compensatory mechanism to maintain glucose delivery to the brain since a blood glucose level of 2 mmol/L is well below the level at which brain dysfunction and counter-regulatory hormone response occur.47 Furthermore, increases in CBF do not increase blood:brain glucose transport.48,49
Response of CBF to Changes in Cerebral Perfusion Pressure
Changes in CPP over a wide range have little effect on CBF.50 When CPP decreases, vasodilation of the small arteries or arterioles reduces CVR. When CPP increases, vasoconstriction of the small arteries or arterioles increases CVR.51,52 This compensatory mechanism is known as autoregulation.50 In most studies, the limits of autoregulation in normal normotensive subjects are from approximately 70 to 150 mm Hg.50,53 Strandgaard determined that the lower limit of autoregulation was 25 mm Hg below the resting BP in normotensive subjects.54 A contrasting viewpoint has been offered by Schmidt et al., who proposed a new computer method for assessing the lower limit of autoregulation.55 In this study, the lower limit in normotensive volunteers was only 85 mm Hg (11 mm Hg higher than that calculated from the conventional method) and at times was virtually identical to the baseline blood pressure. Within the limits of autoregulation, a 10% decrease in mean arterial pressure produces only a slight (2% to 7%) decrease in regional CBF.56,57 When CPP is reduced below the lower limit of autoregulation, more marked reductions in CBF occur. When the cerebral blood vessels are already dilated in response to some other stimulus, they are less able to dilate in response to reduced CPP. Therefore, the autoregulatory response is attenuated or lost in the setting of pre-existing hypercapnia, anemia, or hypoxemia.58,59
Chronic hypertension shifts both the lower and upper limits of autoregulation to higher levels. The average value of the lower limit of autoregulation in 13 poorly controlled hypertensive patients, ages 49 to 64, (113 ± 17 mm Hg) and 9 well-controlled hypertensives, ages 42 to 66, (96 ± 17 mm Hg) was elevated compared to 10 normotensive controls, ages 41 to 81 (73 ± 9 mm Hg).54 For all three groups combined, the lower limit of autoregulation was 70% to 80% of the resting MAP (r = 0.80). In another study, the lower limit was 88% to 89% of resting MAP (r = 0.81) for 19 normotensive and hypertensive subjects.55 Prolonged effective antihypertensive treatment may lead to a re-adaptation of autoregulation towards normal in some cases, but there are almost no data on this subject.54 Because of this upward shift of the lower limit, acute reductions in MAP or CPP that would be safe in normotensive subjects may precipitate cerebral ischemia in patients with chronic hypertension.60
These observations of the effect of changes in CPP on CBF were made by changing MAP or ICP over minutes, then measuring CBF at the new stable pressure. Recently, these responses have been termed “static cerebral autoregulation” to differentiate them from measurements of cerebral blood flow velocity with Doppler in response to more rapid and less marked fluctuations in MAP or ICP, termed “dynamic cerebral autoregulation.”61 The relationship between static and dynamic autoregulation is not clear. Abnormalities of dynamic cerebral autoregulation may be associated with normal or abnormal static autoregulation.62,63
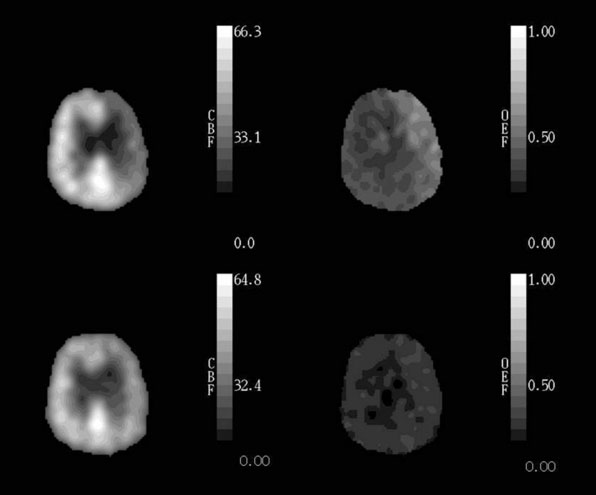
When CPP falls below the autoregulatory limit and the maximum compensatory vasodilatory capacity of the cerebral circulation has been exceeded, CBF will decline markedly with further reductions in CPP. A progressive increase in OEF occurs as CBF falls and oxygen metabolism is maintained (Figure 1–2).64–66 OEF may increase by a factor of 2 or even more from its normal value of 30% to 40%.65 When the increase in OEF is maximal and is no longer adequate to supply the energy needs of the brain, further reductions in CPP disrupt normal cellular metabolism, produce clinical evidence of brain dysfunction, and, if prolonged, will cause permanent damage.
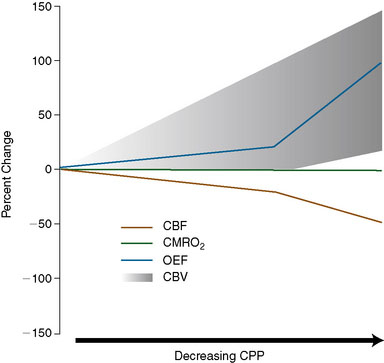
Cerebral blood volume (CBV) is the volume of circulating blood in cerebral vessels. CBV is composed of arterial, capillary, and venous segments. Veins account for some 80% to 85% of CBV, arteries 10% to 15%, and capillaries less than 5%.67,68 Arteries are the most responsive to autoregulatory changes in CPP, veins respond less and capillaries even less.69,70 During experimental reductions in CPP, it is often possible to measure an increase in CBV that is presumed to be due to autoregulatory vasodilation.71–73 However, this increase in CBV to reduced CPP is not always evident (Figure 1–2),66,74 and a decrease in CBV in response to severe reductions in CPP has even been observed.75 Failure to demonstrate increased CBV in the setting of reduced CPP has been attributed to various possible mechanisms, including differential vasodilatory capacity of different vascular beds, passive collapse of vessels due to low intraluminal pressures, small vessel vasospasm, and re-setting of vascular tone in response to reduced metabolic demands.76 The CBF/CBV ratio (or its reciprocal, the vascular mean vascular transit time, MTT) has been proposed to be a more sensitive indicator of reduced CPP than CBV alone.66,77 Although it may be more sensitive, it is not reliable because it may decrease in conditions with low CBF and normal CPP, such as hypocapnia.78,79
Cerebral hemodynamic effects of arterial occlusive disease
Hemodynamic Effect of Arterial Stenosis
Stenosis of the carotid artery produces no hemodynamic effect until a critical reduction of 60% to 70% in vessel lumen occurs. Even with this or greater degrees of stenosis, distal CPP is variable and may even remain normal with stenosis exceeding 90%.80 This is because hemodynamic effect of carotid artery stenosis depends not only on the degree of stenosis but also on the adequacy of the collateral circulation. Vascular imaging techniques such as angiography or Doppler ultrasonography can identify the presence of these collateral vessels, but not necessarily the adequacy of the blood supply they provide.81
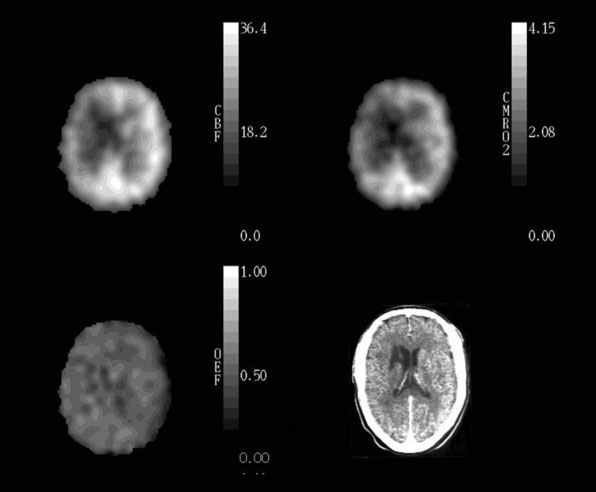
In patients with cerebrovascular disease, determining the hemodynamic effects of arterial stenosis or occlusion is of potential value in predicting the subsequent stroke risk or for choosing preventative therapy. Measurement of rCBF alone is inadequate for this purpose. Normal rCBF may be found when rCPP is reduced but rCBF is maintained by autoregulatory vasodilation of distal resistance vessels. Second, rCBF may be low when rCPP is normal, such as when the metabolic demands of the tissue are reduced by previous ischemic damage or by the destruction of afferent or efferent fibers by a remote lesion (Figure 1–3).65
Methods to Measure the Hemodynamic Effects of Large Artery Occlusive Disease
Three strategies are commonly used clinically to determine the local cerebral hemodynamic status. The first relies on measurement of rCBF at baseline and again after a vasodilatory stimulus, such as CO2 inhalation, breath holding, acetazolamide administration, or physiological activity (e.g., hand movement). An impairment in the normal increase of rCBF or Doppler blood flow velocity in response to the vasodilatory stimulus is assumed to reflect existing autoregulatory vasodilation due to reduced rCPP. Responses to vasodilatory stimuli have been categorized into three grades of hemodynamic impairment: (1) reduced augmentation (relative to contralateral hemisphere or normal controls), (2) absent augmentation (same value as baseline), and (3) paradoxical reduction in regional blood flow compared with baseline measurement. This last category, also known as the “steal” phenomenon, can only be identified with quantitative CBF techniques.82
The pattern of arteriographic collateral circulation to the MCA distal to an occluded carotid artery does not consistently differentiate those patients with poor cerebral hemodynamics (Table 1–1).74,81,83,84
Table 1–1 Arteriographic collateral patterns in Patients from St. Louis Carotid Occlusion Study.
| High OEF | Normal OEF | |
|---|---|---|
| Acomm | 27/32 | 26/30 |
| Pcomm | 6/13 | 13/18 |
| ECA-OA | 19/31 | 10/28 |
| ECA-Other | 3/29 | 6/28 |
| Cortical | 2/29 | 5/23 |
Three-Stage Classification System of Cerebral Hemodynamics
Based on the known physiological responses of CBF, CBV, and OEF to reductions in CPP, we proposed a three-stage sequential classification system for the regional cerebral hemodynamic status in patients with cerebrovascular disease.85 Stage 0 is normal with normal rCPP and normally matched regional CBF and CMRO2, such that rOEF is normal, rCBV and rMTT are not elevated and the rCBF response to vasodilatory stimuli is normal. Stage I hemodynamic compromise represents reduced rCPP, but is still above the lower autoregulatory limit. It is manifested by autoregulatory vasodilation of arterioles to maintain rCBF matched to rCMRO2. Consequently, rCBV and rMTT are increased and the rCBF response to vasodilatory stimuli is decreased, but rOEF remains normal. In Stage II hemodynamic failure, rCPP is below the lower autoregulatory limit. There is a decrease in CBF relative to rCMRO2 with increased OEF (Figure 1–4). This stage has also been termed “misery perfusion” by Baron et al.86,87 In all of these stages, rCMRO2 is preserved at a level that reflects the underlying energy demands of the tissue, but may be lower than normal due to the effects of previous tissue damage or deafferentation (Figure 1–3).65,88
Although the three-stage classification scheme is conceptually and practically useful, it is overly simplistic. First, as discussed above, increases in rCBV and rMTT are not reliable indices of reduced rCPP. Second, rCBF responses to different vasodilatory agents may be impaired or normal in the same patient.89–91 A normal vasodilatory response may occur in the setting of increased rCBV.92,93 Finally, according to the three-stage system, all patients with increased rOEF should have increased rCBV and poor response to vasoactive stimuli. However, this increase in rCBV is not always evident.76
Correlation of Large Artery Cerebral Hemodynamics with Stroke Risk
Stage I Hemodynamic compromise
Data on vasomotor reactivity to acetazolamide or hypercapnia (Stage I hemodynamic compromise) in predicting subsequent stroke have been inconsistent.83,94–101
Yonas and colleagues tested cerebrovascular reserve by paired rCBF measurements with the stable Xenon/CT and acetazolamide in 68 patients with carotid artery disease followed for a mean of 24 months.99 Patients were placed into two groups based on criteria for hemodynamic compromise of initial rCBF values less than 45 ml 100 g−1 min−1 and rCBF reduction after acetazolamide of more than 5%. This categorization was done retrospectively based on assessment of the characteristics of the patients who went on to develop stroke. There were two contralateral strokes in 27 patients with normal hemodynamics and eight ipsilateral strokes in 41 patients with hemodynamic compromise. In a subsequent report by these authors, 27 additional patients were included in an analysis of 95 patients with either stenosis of 70% or carotid artery occlusion.95 The patients were followed for a mean of 19.6 months. These patients were classified into two groups based only on a rCBF reduction of more than 5% to acetazolamide, different criteria than those used in the first study. From the data presented it is possible to determine that three of the five strokes that occurred in the additional 27 patients did so in patients who would not have met criteria for hemodynamic compromise in the first study. Only two of these five new strokes were in the hemodynamically compromised territory of the occluded vessel. Thus the previously retrospectively derived criteria for identifying patients at high risk failed when subjected to a prospective test on a new group of 27 patients.
Kleiser and Widder tested the cerebrovascular reserve capacity in 85 patients with internal carotid artery (ICA) occlusion using transcranial Doppler during normocapnia, hypercapnia, and hypocapnia.102 At the time of entry into the study, 46 patients were asymptomatic on the ipsilateral side of the occlusion. The patients were followed for a mean of 38 months. In the group with normal CO2 reactivity, four of 48 patients had an ipsilateral TIA or prolonged reversible ischemic neurological deficit, but none had a stroke. Six of 26 patients with diminished CO2 reactivity had an ipsilateral ischemic event (three [12%] strokes, three TIAs), and three patients had a contralateral event (two strokes, one TIA). In the group with exhausted CO2 reactivity, five of 11 patients (45%) had an ipsilateral stroke and one patient had an ipsilateral TIA. Two patients had a contralateral hemisphere stroke. Although this study found a significant association between CO2 reactivity of the cerebral circulation and ischemic events ipsilateral to an ICA occlusion, there was no significant relationship between prior symptoms and subsequent stroke risk. This is puzzling since the prognosis of asymptomatic carotid occlusion is relatively benign.103,104 The increased risk of contralateral stroke in the patients with a diminished or exhausted CO2 reactivity suggests that the groups were not matched for other stroke risk factors, and this may explain the differences observed. In a subsequent report by these authors, 86 patients with carotid artery occlusion were followed for variable periods of time.105 A stroke ipsilateral to an occluded ICA occurred in three of 26 patients with an exhausted CO2 reactivity, corresponding to an annual stroke rate of only 8% (mean follow-up time of 19 months), much lower in the first study. In 37 patients with diminished CO2 reactivity and 48 patients with normal CO2 reactivity, only one patient in each group developed an ipsilateral stroke (mean follow-up time of 31.7 months). In this second study, the number of asymptomatic patients is not given. The 86 patients in the second study were selected from 452 patients with ICA occlusion studied with transcranial Doppler cerebrovascular resistance studies. The criteria for selecting these 86 patients were not given.
Vernieri et al. have published a well-designed and well-executed prospective study of 65 patients with both symptomatic and asymptomatic carotid occlusion.97 Hemodynamic compromise was assessed by using transcranial Doppler measurement of middle cerebral artery (MCA) blood flow velocity during breath holding. Multivariate analysis found only older age and impaired Doppler velocity increase during breath holding to be associated with the subsequent risk of ipsilateral ischemic events (TIA and stroke). No separate analysis of symptomatic patients and no separate analysis of predictive value for stroke only was reported nor was any data on subsequent medical treatment.
Kuroda and colleagues enrolled 77 symptomatic patients in a prospective, longitudinal cohort study. All patients met inclusion criteria of cerebral angiography, no or localized cerebral infarction on MRI or CT, and no or minimal neurological deficit. Regional rCBF and regional cerebrovascular reactivity to CVR to acetazolamide were quantitatively determined by 133Xe SEPCT. During an average follow-up period of 42.7 months, 16 total and seven ipsilateral ischemic strokes occurred. Decreased cerebrovascular reactivity to acetazolamide alone did not predict the subsequent occurrence of stroke. Only the combination of decreased rCBF and decreased cerebrovascular reactivity identified those with a high annual risk for both total and ipsilateral stroke (35.6% and 23.7%, respectively). Kaplan-Meier analysis revealed that the risks of total and ipsilateral stroke in the 11 patients with this combination were significantly higher than in the 66 without (P < 0.0001 and P = 0.0001, respectively, log-rank test). Relative risk was 8.0 (95% confidence interval [CI], 1.9 to 34.4) for ipsilateral stroke and 3.6 (95% CI, 1.4 to 9.3) for total stroke.94
In addition to these reported positive associations, other studies with prospectively defined criteria have failed to demonstrate a relationship between the risk of subsequent stroke and Stage I hemodynamic compromise.96,106 We reported a longitudinal study of stroke risk in 21 medically treated patients with increased CBV/CBF ratios distal to a stenotic or occluded artery. No ipsilateral ischemic strokes occurred during the 1-year follow-up period.106 Yokota et al. derived criteria for abnormal acetazolamide SPECT CBF responses from a comparison of paired studies of PET OEF in 14 subjects and then used the SPECT criteria to study 105 patients with ischemic cerebrovascular events, minimal infarct on a CT scan, and unilateral occlusion or severe stenosis of the ICA or proximal MCA.96 Fifty-five patients had abnormal cerebral vasoreactivity response to acetazolamide and 50 patients had a normal response. Risk factors for stroke at entry were recorded and included in the final data analysis. The median follow-up period in the study was 32.5 months. During the follow-up period, 13 patients had a stroke, 11 died, 16 had surgical cerebral revascularization procedures (nine EC-IC bypasses and seven carotid endarterectomies), and 11 were lost to follow-up. There was no significant difference in the rate of subsequent stroke in the two groups. This was generally a well-planned, well-executed prospective study that addressed the possible impact of other risk factors in the largest study reported to date. A relatively large number of patients were censored from the study because of subsequent cerebrovascular surgery and loss to follow-up. Since the criteria used for separating patients into those with normal and abnormal cerebrovascular reactivity were based on a previous study that demonstrated complete congruence with PET measurements of OEF,92 the negative results of this study are puzzling in the light of two PET studies that both demonstrated a strong association between increased OEF and subsequent stroke (see following). As opposed to other studies comparing CBF response to vasodilatory stimuli and PET OEF, these investigators were able to identify a threshold that was 100% sensitive and 100% specific based on a study of both modalities in 14 patients. It is likely that this small sample of patients was not sufficient to really determine the relationship between the two modalities and the threshold chosen did not reliably correlate with PET OEF in the larger sample of 105 patients followed prospectively.
In 2002, Ogasawara and colleagues published a well-designed, well-executed prospective study of cerebrovascular reactivity (CVR) to acetazolamide using quantitative measurements of CBF with 133Xe inhalation and single-photon emission computed tomography.101 Seventy patients less than 70 years old with unilateral ICA or MCA occlusion were divided into two groups based on the regional CVR (rCVR) in the territory of the occluded artery. They were prospectively followed for a period of 24 months. Recurrent strokes occurred in eight of the 23 patients with reduced rCVR at entry and in three of 47 patients with normal rCVR (p = 0.0030 by Kaplan-Meier analysis). In a companion paper, these same authors directly compared two different methodologies: cerebral blood flow (CBF) percent change obtained quantitatively from xenon-133 (133Xe) SPECT as used in the initial report and asymmetry index (AI) percent change obtained qualitatively from N-isopropyl-p-[123I]-iodoamphetamine (IMP) SPECT. There was no significant difference in cumulative recurrence-free survival rates between patients with decreased AI percent change and those with normal AI percent change. This study demonstrated that, while decreased cerebrovascular reactivity to acetazolamide determined quantitatively by 133Xe SPECT is an independent predictor of the 5-year risk of subsequent stroke in patients with symptomatic major cerebral artery occlusion, the qualitative method using 123I-IMP SPECT was a poor predictor of the risk of subsequent stroke in this type of patient.100
Stage II Hemodynamic compromise (“misery perfusion”)
In contrast to the inconsistent data for Stage I hemodynamic impairment, two independent studies have demonstrated that Stage II hemodynamic failure, defined as increased OEF, is a powerful independent predictor of subsequent ipsilateral ischemic stroke.74,107,108
Yamauchi and colleagues from Kyoto, Japan reported a strong relationship between absolute measurements of increased cerebral OEF and the subsequent risk of recurrent stroke in a small longitudinal study.107 PET measurements were performed in 40 medically treated patients with symptomatic occlusion or intracranial stenosis of the internal carotid or middle cerebral arterial system treated medically. Patients were divided into two categories based on the mean hemispheric value of OEF in the symptomatic cerebral hemisphere: patients with normal OEF and those with increased OEF. At 1 year following the PET studies, five of seven patients with increased OEF had developed a stroke; four strokes were ipsilateral and one was contralateral. Four of 33 patients with normal OEF had developed a stroke. Two strokes were ipsilateral and two were contralateral. After the first year of follow-up, one ipsilateral stroke and one contralateral stroke occurred, both occurring in patients with normal OEF. This corresponds to a 2-year ipsilateral stroke rate of 57% in the high OEF group and 15% in the normal OEF group.108
The St. Louis Carotid Occlusion Study (STLCOS) was designed to test the hypothesis that increased OEF (Stage II hemodynamic failure) in the cerebral hemisphere distal to symptomatic carotid artery occlusion is an independent predictor of the subsequent risk of stroke in medically treated patients.74 This study was prospective and blinded, and addressed the possible effect of treatment and other risk factors for stroke. Fifteen hospitals within the St. Louis area collaborated to assist with recruitment for this study. Inclusion criteria were (1) occlusion of one or both common or internal carotid arteries demonstrated by contrast angiography, MR angiography, or carotid ultrasound; and (2) transient ischemic neurological deficits (including transient monocular blindness) or mild to moderate permanent ischemic neurological deficits (stroke) in the appropriate carotid artery territory. Exclusion criteria were (1) inability to give informed consent; (2) not legally an adult; (3) failure to meet the following functional standards—self-care for most activities of daily living (may require some assistance), some useful residual function in the affected arm or leg, language comprehension intact, motor aphasia mild or absent, able to handle own oropharyngeal secretions; (4) nonatherosclerotic conditions causing or likely to cause cerebral ischemia—carotid dissection, fibromuscular dysplasia, arteritis, blood dyscrasia, or heart disease as a source of cerebral emboli; (5) any morbid condition likely to lead to death within 5 years; (6) pregnancy; and (7) subsequent cerebrovascular surgery planned that might alter cerebral hemodynamics. Any subsequent cerebrovascular surgery after the initial PET caused the patient to be censored from the study at the time of surgery.
Regional OEF was measured by PET with the method of Mintun et al. using H215O, C15O, and O15O.109,110 When technical difficulties precluded collection of arterial time activity curves necessary to determine quantitative OEF, the ratio image of the counts in the unprocessed images of H215O and O15O was normalized to a whole brain mean of 0.40 and substituted for the quantitative OEF image. All images were then filtered with a three dimensional Gaussian filter to a uniform resolution of 16-mm, full-width, half maximum. For each subject, seven spherical regions of interest 19 mm in diameter were placed in the cortical territory of the MCA in each hemisphere using stereotactic coordinates based on skull X-ray measurements.85,111 If any portion of a region overlapped a well-demarcated area of reduced oxygen metabolism that corresponded to areas of infarction by CT or MRI, that region and the homologous contralateral region were excluded. The mean OEF for each MCA territory was calculated from the remaining regions and a left/right MCA OEF ratio was calculated. The maximum and minimum ratios from the 18 normal control subjects were used to define the normal range (0.914–1.082). A separate range of normal for H215O/O15O images was determined (0.934–1.062). Patients with left/right OEF ratios outside the normal range were categorized as having Stage II hemodynamic failure in the hemisphere with higher OEF. These categorizations were made without knowledge of the side of the carotid occlusion or of the clinical course of the patients since the initial PET study.
Of the 81 patients, 39 had Stage II hemodynamic failure (increased OEF) in one hemisphere and 42 did not. The two groups were well matched for most baseline risk factors, except that retinal symptoms were less common in Stage II subjects (3/39 vs 13/26). Arteriographic collateral circulation pattern did not permit distinction between the two groups (Table 1–1). Mean follow-up duration was 31.5 months. Twelve deaths occurred, six in each group. In the 39 Stage II subjects, 12 total and 11 ipsilateral strokes occurred. In the 42 subjects with normal OEF, there were three total and two ipsilateral strokes. The Kaplan-Meier estimates for the rates of subsequent stroke at 1 and 2 years are given in Table 1–2.
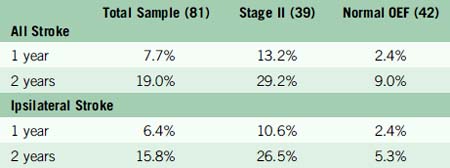
The rate of all stroke and ipsilateral ischemic stroke in Stage II subjects was significantly higher than in those with normal OEF (p = 0.005 and p = 0.004, respectively). After adjustment for 17 baseline patient characteristics and interval medical treatment, the relative risk conferred by Stage II hemodynamic failure was 6.0 (95% CI, 1.7–21.6) for all stroke and 7.3 (95% CI, 1.6–33.4) for ipsilateral stroke. No ipsilateral strokes occurred in those subjects whose most recent symptoms were more than 120 days or who had had retinal symptoms only. The results of medical treatment of Stage II patients were poor and comparable to those reported for medically treated patients with symptomatic severe carotid stenosis.112
In the STLCOS, 13 subjects were categorized based on a count-based method of OEF measurement because arterial blood samples could not be obtained. This method used a simple ratio of the counts in the H215O/O15O PET images. The ability of the count-based OEF ratio to predict subsequent stroke was examined. The 81 patients were divided into those with count-based OEF ratios outside the normal range and those with normal count-based OEF ratios. Fifty of the 81 patients with symptomatic carotid occlusion were identified as abnormal. All 13 ipsilateral ischemic strokes occurred in the 50 patients with increased count-based OEF (p = 0.002, sensitivity 100%, specificity 45.6%). Second, the count-based technique was compared directly to the quantitative method for predicting ipsilateral stroke. In this analysis, the image data of the 68 patients with arterial time activity curves was processed using both count-based and quantitative methods. Using the normal range of values, 31 of the 68 patients were identified as abnormal using quantitative OEF ratios. Seven ipsilateral ischemic strokes occurred in this group of 31 patients, compared to two strokes in the 37 patients with quantitative OEF ratios within the range of normal (p = 0.025, sensitivity 77.8%, specificity 59.3%). The count-based OEF ratio was less specific (specificity 45.7%) and more sensitive (sensitivity 100%) than the quantitative method. Forty-one patients were categorized as abnormal and all strokes occurred in this group (p = 0.0048). Comparison of the count-based OEF ratio to the quantitative OEF ratio for each of the 68 patients demonstrated no significant difference by paired t-test analysis (p = 0.299). The average absolute difference between count-based OEF and OEF ratios was 0.0345 (95% confidence limit = ±0.0091). Receiver operating curves were generated for both methods. The area under the receiver operating curve for the count-based OEF method (0.815) was greater than the quantitative OEF method (0.737), indicating superior accuracy.113 A subsequent analysis compared these two techniques that rely on asymmetries of OEF to the technique based on absolute OEF values used in the Kyoto study. All three methods were predictive of stroke risk in univariate analysis. Only the count-based method remained significant in multivariate analysis. The area under the ROC curve was greatest for the count-based ratio: 0.815 versus 0.769 (absolute) and 0.737 (ratios of absolute).114
At this time, it is not possible to identify a non-PET method for assessing OEF that has sufficient proven sensitivity and specificity to substitute for PET. The correlation between the CBF response to vasodilatory agents and increased OEF has been somewhat variable and inconsistent.92,93,115–124 In general, these studies have shown that measurements of vascular reactivity have high sensitivity but poor positive predictive value for identifying increased OEF123 Certain MR pulse sequences are sensitive to the amount of deoxyhemoglobin in blood (blood oxygen level dependent [BOLD]).125–127 They are commonly used to identify changes in the regional blood flow:metabolism ratio with physiologic brain activation, but their application to static measurements of brain oxygenation has proven more difficult. The signal contribution from nonvascular tissue and the effect of variation in CBV have made quantitative measurement of OEF difficult, although research in this area is being actively pursued.128–130 BOLD MRI measurements did not correlate well with PET measurements of OEF in patients with carotid occlusion in a previous study.131
Other Hemodynamic Classification Schemes
Nemoto and colleagues have postulated that patients who initially have CPP below the autoregulatory limit with increased OEF (Stage II hemodynamic failure) may suffer subsequent ischemic neuronal damage that reduces CMRO2 and normalizes OEF, but without any improvement in CPP. They refer to this as Stage III.121 The plausibility of this scenario is supported by PET studies that show evidence for selective neuronal necrosis in brain regions with low CMRO2 and normal OEF and the progressive development of selective neuronal necrosis in areas with initially high OEF.88,132 Nemoto and colleagues propose that, while these patients would look like Stage I hemodynamic compromise (impaired response to vasodilatory stimuli, normal OEF), their stroke risk would in fact be similar to that of Stage II patients due to the persistently low CPP.121 Thus according to this construct, there should be a group of patients with normal OEF and impaired vasoreactivity who are at high risk for stroke. This does not appear to be the case. In the STLCOS, none of the 13 ipsilateral strokes that occurred in follow-up of 3.1 years occurred in patients with increased CBV and normal OEF.76 The two patients with normal OEF who had ipsilateral strokes were among the eight patients with the highest OEF values in the normal OEF group of 41 subjects. Furthermore, in this cohort of patients, OEF was predictive of subsequent ipsilateral stroke as a continuous variable, indicating that the higher the OEF the higher the risk of stroke.114
Kuroda and colleagues have proposed a four-stage classification based on quantitative SPECT measurements of baseline CBF and cerebrovascular reactivity to acetazolamide or CO2: Type 1—normal baseline CBF and normal cerebrovascular reactivity; Type 2—normal baseline CBF and reduced cerebrovascular reactivity; Type 3—reduced baseline CBF and reduced cerebrovascular reactivity; and Type 4—reduced baseline CBF and normal cerebrovascular reactivity.88 Type 1 patients are considered to have a normal CPP because of a well-developed collateral circulation corresponding to Stage 0. Type 2 patients are believed to have moderately reduced CPP corresponding to Stage I. Type 3 patients are believed to have inadequate CPP to maintain a normal resting CBF corresponding to Stage II. Type 4 have reduced oxygen metabolism probably due to ischemia-related neuronal loss with normal hemodynamics corresponding to Stage 0.88,94 The value of this scheme lies in the identification of the high risk of stroke in Type 3 patients. This is based on a small study of only 11 subjects,94 and runs counter to the data from Yonas and colleagues who did not find that low baseline CBF in combination with reduced cerebrovascular reactivity was sensitive indicator of stroke risk.95,99 It also is at odds with the study by Ogasawara et al., who found that quantitative reduced cerebrovascular reactivity alone was sufficient to identify a high-risk group.101 Thus the value of a four-stage classification based on quantitative SPECT measurements of both baseline CBF and cerebrovascular reactivity instead of a two-stage system based on quantitative cerebrovascular reactivity alone remains to be established.
Randomized surgical revascularization trials based on hemodynamic criteria
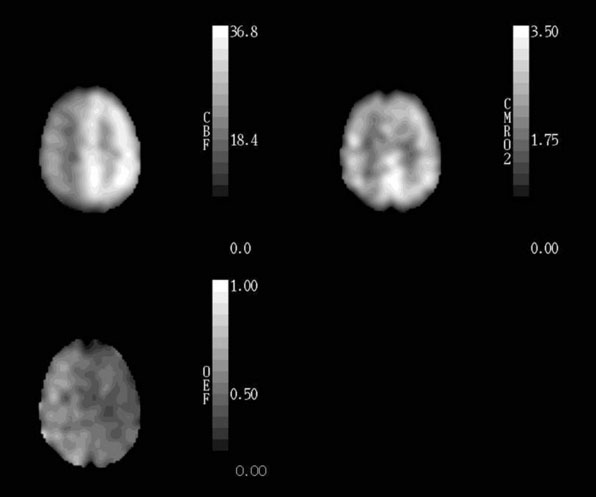
The findings of the Kyoto and St. Louis studies reawakened interest in extracranial-to-intracranial (EC-IC) bypass for stroke prevention, an approach that had largely been abandoned after the publication of the negative EC-IC Bypass Trial in 1985.133 The Kyoto and St. Louis studies demonstrated that Stage II hemodynamic failure (increased OEF) distal to a symptomatic occluded carotid artery is an independent predictor of subsequent ischemic stroke. As first demonstrated by Baron in 1981, EC-IC bypass surgery will return hemispheric OEF ratios to normal in patients with increased OEF distal to an occluded carotid artery (Figure 1–5).87,134–136 The implication of these data is that EC-IC bypass is the logical treatment for these patients with high OEF and high stroke risk on medical therapy. Why does this evidence suggest that EC-IC bypass should be effective in reducing stroke in patients with symptomatic carotid occlusion when the EC-IC Bypass Trial, a large, prospective, and randomized trial of EC-IC bypass versus aspirin in similar patients, failed to demonstrate a benefit? A mathematical simulation using the data from the STLCOS provides the explanation. In STLCOS, the 2-year rate for all stroke was 19% for this entire sample of medically treated patients. If surgery has the same 12.2% morbidity/mortality as in the EC-IC Bypass Trial and reduces the stroke rate in the high OEF patients to that of low OEF patients (9.0%), but does not change the stroke rate in low OEF patients, then the overall stroke rate in the operated group at 2 years will be 9.0% + 12.2% = 21.2%, slightly worse than the medical group. These simulated results at 2 years are remarkably similar to the 5-year results for carotid occlusion in the EC-IC Bypass Trial of 29% for the medical groups and 31% for the surgical group.133 This analysis underscores the importance of identifying a subgroup of patients at high risk who are likely to benefit and restricting surgery to them.
The Japanese EC-IC Bypass Trial (JET)
The Japanese EC-IC Bypass Trial (JET) uses the combination of reduced baseline CBF and reduced acetazolamide cerebrovascular reactivity measured with quantitative SPECT as eligibility criteria. This trial enrolled 196 patients with major cerebral artery occlusive disease from 1998 to 2002. A second interim analysis with data through January 2002 reported primary endpoints in 14 of 98 medically treated patients and five of 98 surgically treated patients (p = 0.046 by Kaplan-Meier analysis).137 Final results of the 2-year follow-up were due in 2004. However, to date, there has been no publication of the final results.
The Carotid Occlusion Surgery Study (COSS)
Final eligibility for randomization is based on fulfilling three different eligibility categories:
Initial clinical and vascular imaging criteria to determine PET eligibility
Inclusion criteria
Exclusion criteria
Arteriographic criteria
Intra-arterial catheter contrast arteriography documenting the following:
All patients are seen 30 days after randomization and at 3-month intervals after randomization for 2 years. At each follow-up examination a neurological history and exam tailored to identifying new stroke is performed. Current medications are recorded. NIHSS, Barthel Index, Rankin Scale, and Stroke Specific Quality of Life assessment are performed at every visit.138–141 Doppler examination to ensure graft patency is performed for all surgical patients.
Choice of long-term antithrombotic treatment is at the discretion of the participant’s personal physician. When deemed appropriate by the surgeon, participants randomized to surgical therapy will return to the antithrombotic treatment preferred by their physicians. Recommendations for antithrombotic treatment follow recommendations for antiplatelet treatment of atherothrombotic TIA of the Ad Hoc Committee on Guidelines for the Management of Transient Ischemic Attacks, Stroke Council, American Heart Association.142 Efficacy of risk factor intervention is measured at each return visit in the following ways:
1 Cohen P.J., Alexander S.C., Smith T.C., et al. Effects of hypoxia and normocarbia on cerebral blood flow and metabolism in conscious man. J Appl Physiol. 1967;23(2):183-189.
2 Madsen P.L., Holm S., Herning M., et al. Average blood flow and oxygen uptake in the human brain during resting wakefulness: A critical appraisal of the Kety-Schmidt technique. J Cereb Blood Flow Metab. 1993;13:646-655.
3 Gottstein U., Bernsmeier A., Sedlmeyer I. Der Kohlenhydratstoffweehsel des menschlichen Gehirns bei Schlafmittelvergiftung. Klin Wschr. 1963;41:943-948.
4 Scheinberg P., Stead E.A. The cerebral blood flow in male subjects as measured by the nitrous oxide technique: normal values for blood flow, oxygen utilization, glucose utilization and peripheral resistance, with observations on the effect of tilting and anxiety. J Clin Invest. 1949;28:1163-1171.
5 Glenn T.C., Kelly D.F., Boscardin W.J., et al. Energy dysfunction as a predictor of outcome after moderate or severe head injury: indices of oxygen, glucose, and lactate metabolism. J Cereb Blood Flow Metab. 2003;23(10):1239-1250.
6 McHenry L.C.Jr, Merory J., Bass E., et al. Xenon-133 inhalation method for regional cerebral blood flow measurements: normal values and test-retest results. Stroke. 1978;9(4):396-399.
7 Sette G., Baron J.C., Mazoyer B., et al. Local brain haemodynamics and oxygen metabolism in cerebrovascular disease. Positron emission tomography. Brain. 1989;112(Pt 4):931-951.
8 Baron J.C., Rougemont D., Soussaline F., et al. Local interrelationships of cerebral oxygen consumption and glucose utilization in normal subjects and in ischemic stroke patients: a positron tomography study. J Cereb Blood Flow Metab. 1984;4(2):140-149.
9 Lebrun-Grandie P., Baron J.C., Soussaline F., et al. Coupling between regional blood flow and oxygen utilization in the normal human brain. A study with positron tomography and oxygen 15. Arch Neurol. 1983;40(4):230-236.
10 Leenders K.L., Perani D., Lammertsma A.A., et al. Cerebral blood flow, blood volume and oxygen utilization. Normal values and effect of age. Brain. 1990;113(Pt 1):27-47.
11 Kety S.S. Human cerebral blood flow and oxygen consumption as related to aging. J Chron Dis. 1956;3:478-486.
12 Pantano P., Baron J.C., Lebrun-Grandie P., et al. Regional cerebral blood flow and oxygen consumption in human aging. Stroke. 1984;15(4):635-641.
13 Dastur D.K. Cerebral blood flow and metabolism in normal human aging, pathological aging, and senile dementia. J Cereb Blood Flow Metab. 1985;5(1):1-9.
14 Kuhl D.E., Metter E.J., Riege W.H., et al. The effect of normal aging on patterns of local cerebral glucose utilization. Ann Neurol. 1984;15(Suppl):S133-2137.
15 Marchal G., Rioux P., Petit-Taboue M.C., et al. Regional cerebral oxygen consumption, blood flow, and blood volume in healthy human aging. Arch Neurol. 1992;49(10):1013-1020.
16 Yamaguchi T., Kanno I., Uemura K., et al. Reduction in regional cerebral metabolic rate of oxygen during human aging. Stroke. 1986;17(6):1220-1228.
17 de Leon M.J., George A.E., Ferris S.H., et al. Positron emission tomography and computed tomography assessments of the aging human brain. J Comput Assist Tomogr. 1984;8(1):88-94.
18 Duara R., Margolin R.A., Robertson-Tchabo E.A., et al. Cerebral glucose utilization, as measured with positron emission tomography in 21 resting healthy men between the ages of 21 and 83 years. Brain. 1983;106(Pt 3):761-775.
19 Duara R., Grady C., Haxby J., et al. Human brain glucose utilization and cognitive function in relation to age. Ann Neurol. 1984;16(6):703-713.
20 Yoshii F., Barker W.W., Chang J.Y., et al. Sensitivity of cerebral glucose metabolism to age, gender, brain volume, brain atrophy, and cerebrovascular risk factors. J Cereb Blood Flow Metab. 1988;8(5):654-661.
21 Meltzer C.C., Cantwell M.N., Greer P.J., et al. Does cerebral blood flow decline in healthy aging? A PET study with partial-volume correction. J Nucl Med. 2000;41(11):1842-1848.
22 Ibanez V., Pietrini P., Furey M.L., et al. Resting state brain glucose metabolism is not reduced in normotensive healthy men during aging, after correction for brain atrophy. Brain Res Bull. 2004;63(2):147-154.
23 Astrup J., Sorensen P.M., Sorensen H.R. Oxygen and glucose consumption related to Na+-K+ transport in canine brain. Stroke. 1981;12(6):726-730.
24 Bering E.A.J., Taren J.A., McMurrey J.D., et al. Studies on hypothermia in monkeys, II. The effect of hypothermia on the general physiology and cerebral metabolism of monkeys in the hypothermic state. Surg Gynecol Obstet. 1956;102:134-138.
25 Nilsson L., Siesjo B.K. The effect of phenobarbitone anaesthesia on blood flow and oxygen consumption in the rat brain. Acta Anaesthesiol Scand Suppl. 1975;57:18-24.
26 Sokoloff L. Relationships among local functional activity, energy metabolism, and blood flow in the central nervous system. Fed Proc. 1981;40(8):2311-2316.
27 Fox P.T., Raichle M.E. Focal physiological uncoupling of cerebral blood flow and oxidative metabolism during somatosensory stimulation in human subjects. Proc Natl Acad Sci U S A. 1986;83(4):1140-1144.
28 Fox P.T., Raichle M.E., Mintun M.A., et al. Nonoxidative glucose consumption during focal physiologic neural activity. Science. 1988;241(4864):462-464.
29 Kety S.S., Schmidt C.F. The effects of altered arterial tensions of carbon dioxide and oxygen on cerebral blood flow and cerebral oxygen consumption of normal young men. J Clin Invest. 1948;27:484-492.
30 Raichle M.E., Posner J.B., Plum F. Cerebral blood flow during and after hyperventilation. Arch Neurol. 1970;23(5):394-403.
31 Shimojyo S., Scheinberg P., Kogure K., et al. The effects of graded hypoxia upon transient cerebral blood flow and oxygen consumption. Neurology. 1968;18(2):127-133.
32 Buck A., Schirlo C., Jasinksy V., et al. Changes of cerebral blood flow during short-term exposure to normobaric hypoxia. J Cereb Blood Flow Metab. 1998;18(8):906-910.
33 Lassen N.A. Cerebral blood flow and oxygen consumption in man. Physiol Rev. 1959;39:183-238.
34 Brown M.M., Wade J.P., Marshall J. Fundamental importance of arterial oxygen content in the regulation of cerebral blood flow in man. Brain. 1985;108(Pt 1):81-93.
35 Todd M.M., Wu B., Maktabi M., et al. Cerebral blood flow and oxygen delivery during hypoxemia and hemodilution: role of arterial oxygen content. Am J Physiol. 1994;267(5 Pt 2):H2025-H2031.
36 Mintun M.A., Lundstrom B.N., Snyder A.Z., et al. Blood flow and oxygen delivery to human brain during functional activity: theoretical modeling and experimental data. Proc Natl Acad Sci U S A. 2001;98(12):6859-6864.
37 Brown M.M., Marshall J. Regulation of cerebral blood flow in response to changes in blood viscosity. Lancet. 1985;1(8429):604-609.
38 Brown M.M., Marshall J. Effect of plasma exchange on blood viscosity and cerebral blood flow. Br Med J (Clin Res Ed). 1982;284(6331):1733-1736.
39 Paulson O.B., Parving H.H., Olesen J., et al. Influence of carbon monoxide and of hemodilution on cerebral blood flow and blood gases in man. J Appl Physiol. 1973;35(1):111-116.
40 Rebel A., Lenz C., Krieter H., et al. Oxygen delivery at high blood viscosity and decreased arterial oxygen content to brains of conscious rats. Am J Physiol Heart Circ Physiol. 2001;280(6):H2591-H2597.
41 Hino A., Ueda S., Mizukawa N., et al. Effect of hemodilution on cerebral hemodynamics and oxygen metabolism. Stroke. 1992;23(3):423-426.
42 Tallroth G., Ryding E., Agardh C.D. Regional cerebral blood flow in normal man during insulin-induced hypoglycemia and in the recovery period following glucose infusion. Metabolism. 1992;41(7):717-721.
43 Tallroth G., Ryding E., Agardh C.D. The influence of hypoglycaemia on regional cerebral blood flow and cerebral volume in type 1 (insulin-dependent) diabetes mellitus. Diabetologia. 1993;36(6):530-535.
44 Neil H.A., Gale E.A., Hamilton S.J., et al. Cerebral blood flow increases during insulin-induced hypoglycaemia in type 1 (insulin-dependent) diabetic patients and control subjects. Diabetologia. 1987;30(5):305-309.
45 Kerr D., Stanley J.C., Barron M., et al. Symmetry of cerebral blood flow and cognitive responses to hypoglycaemia in humans. Diabetologia. 1993;36(1):73-78.
46 Eckert B., Ryding E., Agardh C.D. Sustained elevation of cerebral blood flow after hypoglycaemia in normal man. Diabetes Res Clin Pract. 1998;40(2):91-100.
47 Boyle P.J., Nagy R.J., O’Connor A.M., et al. Adaptation in brain glucose uptake following recurrent hypoglycemia. Proc Natl Acad Sci U S A. 1994;91(20):9352-9356.
48 Chen J.L., Wei L., Acuff V., et al. Slightly altered permeability-surface area products imply some cerebral capillary recruitment during hypercapnia. Microvasc Res. 1994;48(2):190-211.
49 Chen J.L., Wei L., Bereczki D., et al. Nicotine raises the influx of permeable solutes across the rat blood-brain barrier with little or no capillary recruitment. J Cereb Blood Flow Metab. 1995;15(4):687-698.
50 Paulson O.B., Strandgaard S., Edvinsson L. Cerebral autoregulation. Cerebrovasc Brain Metab Rev. 1990;2(2):161-192.
51 MacKenzie E.T., Farrar J.K., Fitch W., et al. Effects of hemorrhagic hypotension on the cerebral circulation. I. Cerebral blood flow and pial arteriolar caliber. Stroke. 1979;10(6):711-718.
52 Symon L., Pasztor E., Dorsch N.W., et al. Physiological responses of local areas of the cerebral circulation in experimental primates determined by the method of hydrogen clearance. Stroke. 1973;4(4):632-642.
53 Strandgaard S., Olesen J., Skinhoj E., et al. Autoregulation of brain circulation in severe arterial hypertension. Br Med J. 1973;1(852):507-510.
54 Strandgaard S. Autoregulation of cerebral blood flow in hypertensive patients. The modifying influence of prolonged antihypertensive treatment on the tolerance to acute, drug-induced hypotension. Circulation. 1976;53(4):720-727.
55 Schmidt J.F., Waldemar G., Vorstrup S., et al. Computerized analysis of cerebral blood flow autoregulation in humans: validation of a method for pharmacologic studies. J Cardiovasc Pharmacol. 1990;15(6):983-988.
56 Dirnagl U., Pulsinelli W. Autoregulation of cerebral blood flow in experimental focal brain ischemia. J Cereb Blood Flow Metab. 1990;10:327-336.
57 Heistad D.D., Kontos H.E. Cerebral circulation. Shepherd J.T., Aboud F.M., editors. Handbook of physiology, Section 2, Vol. 3. Bethesda, MD: American Physiological Society, 1983;137-182. Pt. 1
58 Maruyama M., Shimoji K., Ichikawa T., et al. The effects of extreme hemodilutions on the autoregulation of cerebral blood flow, electroencephalogram and cerebral metabolic rate of oxygen in the dog. Stroke. 1985;16(4):675-679.
59 Haggendal E., Johansson B. Effect of arterial carbon dioxide tension and oxygen saturation on cerebral blood flow autoregulation in dogs. Acta Physiol Scand. 1965;66:27-53.
60 Ledingham J.G., Rajagopalan B. Cerebral complications in the treatment of accelerated hypertension. Q J Med. 1979;48(189):25-41.
61 van Beek A.H., Claassen J.A., Rikkert M.G., et al. Cerebral autoregulation: an overview of current concepts and methodology with special focus on the elderly. J Cereb Blood Flow Metab. 2008;28(6):1071-1085.
62 Dawson S.L., Panerai R.B., Potter J.F. Serial changes in static and dynamic cerebral autoregulation after acute ischaemic stroke. Cerebrovasc Dis. 2003;16(1):69-75.
63 Steiner L.A., Coles J.P., Johnston A.J., et al. Assessment of cerebrovascular autoregulation in head-injured patients: a validation study. Stroke. 2003;34(10):2404-2409.
64 Boysen G. Cerebral hemodynamics in carotid surgery. Acta Neurol Scand Suppl. 1973;52:3-86.
65 Powers W.J. Cerebral hemodynamics in ischemic cerebrovascular disease. Ann Neurol. 1991;29(3):231-240.
66 Schumann P., Touzani O., Young A.R., et al. Evaluation of the ratio of cerebral blood flow to cerebral blood volume as an index of local cerebral perfusion pressure. Brain. 1998;121(Pt 7):1369-1379.
67 Wiedeman M.P. Dimensions of blood vessels from distributing artery to collecting vein. Circ Res. 1963;12:375-378.
68 Hilal S.K. Cerebral hemodynamics assessed by angiography. Newton T.H., Potts D.G., editors. Radiology of the skull and brain. Angiography, vol. 2. St. Louis: CV Mosby Company, 1974;1049-1085. Book 1,
69 Auer L.M., Ishiyama N., Pucher R. Cerebrovascular response to intracranial hypertension. Acta Neurochir (Wien). 1987;84(3–4):124-128.
70 Kato Y., Auer L.M. Cerebrovascular response to elevation of ventricular pressure. Acta Neurochir (Wien). 1989;98(3–4):184-188.
71 Grubb R.L.Jr, Phelps M.E., Raichle M.E., et al. The effects of arterial blood pressure on the regional cerebral blood volume by x-ray fluorescence. Stroke. 1973;4(3):390-399.
72 Grubb R.L.Jr, Raichle M.E., Phelps M.E., et al. Effects of increased intracranial pressure on cerebral blood volume, blood flow, and oxygen utilization in monkeys. J Neurosurg. 1975;43(4):385-398.
73 Ferrari M., Wilson D.A., Hanley D.F., et al. Effects of graded hypotension on cerebral blood flow, blood volume, and mean transit time in dogs. Am J Physiol. 1992;262(6 Pt 2):H1908-H1914.
74 Grubb R.L.Jr, Derdeyn C.P., Fritsch S.M., et al. Importance of hemodynamic factors in the prognosis of symptomatic carotid occlusion. JAMA. 1998;280(12):1055-1060.
75 Zaharchuk G., Mandeville J.B., Bogdanov A.A.Jr, et al. Cerebrovascular dynamics of autoregulation and hypoperfusion. An MRI study of CBF and changes in total and microvascular cerebral blood volume during hemorrhagic hypotension. Stroke. 1999;30(10):2197-2204.
76 Derdeyn C.P., Videen T.O., Yundt K.D., et al. Variability of cerebral blood volume and oxygen extraction: stages of cerebral hemodynamic impairment revisited. Brain. 2002;125:595-607.
77 Gibbs J.M., Wise R.J., Leenders K.L., et al. Evaluation of cerebral perfusion reserve in patients with carotid-artery occlusion. Lancet. 1984;1(8372):310-314.
78 Powers W.J. Is the ratio of cerebral blood volume to cerebral blood flow a reliable indicator of cerebral perfusion pressure. J Cereb Blood Flow Metab. 1993;13(Suppl 1):S325.
79 Grubb R.L.Jr, Raichle M.E., Eichling J.O., et al. The effects of changes in PaCO2 on cerebral blood volume, blood flow, and vascular mean transit time. Stroke. 1974;5(5):630-639.
80 Sillesen H., Schroeder T., Steenberg H.J., et al. Doppler examination of the periorbital arteries adds valuable hemodynamic information in carotid artery disease. Ultrasound Med Biol. 1987;13(4):177-181.
81 Derdeyn C.P., Shaibani A., Moran C.J., et al. Lack of correlation between pattern of collateralization and misery perfusion in patients with carotid occlusion. Stroke. 1999;30(5):1025-1032.
82 Lassen N.A., Palvolgyi R. Cerebral steal during hypercapnia and the inverse reaction during hypocapnia observed with the 133 xenon technique in man. Scand J Clin Lab Invest. 1968;22(Suppl 102):13D.
83 Vernieri F., Pasqualetti P., Matteis M., et al. Effect of collateral blood flow and cerebral vasomotor reactivity on the outcome of carotid artery occlusion. Stroke. 2001;32(7):1552-1558.
84 Yamauchi H., Kudoh T., Sugimoto K., et al. Pattern of collaterals, type of infarcts, and haemodynamic impairment in carotid artery occlusion. J Neurol Neurosurg Psychiatry. 2004;75(12):1697-1701.
85 Powers W.J., Press G.A., Grubb R.L.Jr, et al. The effect of hemodynamically significant carotid artery disease on the hemodynamic status of the cerebral circulation. Ann Intern Med. 1987;106(1):27-34.
86 Baron J.C., Bousser M.G., Comar D., et al. Human hemispheric infarction studied by positron emission tomography and the 15O continuous inhalation technique. In: Caille J.M., Salamon G., editors. Computerized Tomography. New York: Springer-Verlag; 1980:231-237.
87 Baron J.C., Bousser M.G., Rey A., et al. Reversal of focal “misery-perfusion syndrome” by extra-intracranial arterial bypass in hemodynamic cerebral ischemia. A case study with 15O positron emission tomography. Stroke. 1981;12(4):454-459.
88 Kuroda S., Shiga T., Ishikawa T., et al. Reduced blood flow and preserved vasoreactivity characterize oxygen hypometabolism due to incomplete infarction in occlusive carotid artery diseases. J Nucl Med. 2004;45(6):943-949.
89 Kazumata K., Tanaka N., Ishikawa T., et al. Dissociation of vasoreactivity to acetazolamide and hypercapnia. Comparative study in patients with chronic occlusive major cerebral artery disease. Stroke. 1996;27(11):2052-2058.
90 Inao S., Tadokoro M., Nishino M., et al. Neural activation of the brain with hemodynamic insufficiency. J Cereb Blood Flow Metab. 1998;18(9):960-967.
91 Pindzola R.R., Balzer J.R., Nemoto E.M., et al. Cerebrovascular reserve in patients with carotid occlusive disease assessed by stable xenon-enhanced ct cerebral blood flow and transcranial Doppler. Stroke. 2001;32(8):1811-1817.
92 Hirano T., Minematsu K., Hasegawa Y., et al. Acetazolamide reactivity on 123I-IMP single photon emission computed tomography in patients with major cerebral artery occlusive disease: correlation with positron emission tomography parameters. J Cereb Blood Flow Metab. 1994;14(5):763-770.
93 Nariai T., Suzuki R., Hirakawa K., et al. Vascular reserve in chronic cerebral ischemia measured by the acetazolamide challenge test: comparison with positron emission tomography. AJNR Am J Neuroradiol. 1995;16(3):563-570.
94 Kuroda S., Houkin K., Kamiyama H., et al. Long-term prognosis of medically treated patients with internal carotid or middle cerebral artery occlusion: can acetazolamide test predict it? Stroke. 2001;32(9):2110-2116.
95 Webster M.W., Makaroun M.S., Steed D.L., et al. Compromised cerebral blood flow reactivity is a predictor of stroke in patients with symptomatic carotid artery occlusive disease. J Vasc Surg. 1995;21(2):338-344.
96 Yokota C., Hasegawa Y., Minematsu K., et al. Effect of acetazolamide reactivity on long-term outcome in patients with major cerebral artery occlusive diseases. Stroke. 1998;29(3):640-644.
97 Vernieri F., Pasqualetti P., Passarelli F., et al. Outcome of carotid artery occlusion is predicted by cerebrovascular reactivity. Stroke. 1999;30(3):593-598.
98 Klijn C.J., Kappelle L.J., van Huffelen A.C., et al. Recurrent ischemia in symptomatic carotid occlusion: prognostic value of hemodynamic factors. Neurology. 2000;55(12):1806-1812.
99 Yonas H., Smith H.A., Durham S.R., et al. Increased stroke risk predicted by compromised cerebral blood flow reactivity. J Neurosurg. 1993;79(4):483-489.
100 Ogasawara K., Ogawa A., Terasaki K., et al. Use of cerebrovascular reactivity in patients with symptomatic major cerebral artery occlusion to predict 5-year outcome: comparison of xenon-133 and iodine-123-IMP single-photon emission computed tomography. J Cereb Blood Flow Metab. 2002;22(9):1142-1148.
101 Ogasawara K., Ogawa A., Yoshimoto T. Cerebrovascular reactivity to acetazolamide and outcome in patients with symptomatic internal carotid or middle cerebral artery occlusion: a xenon-133 single-photon emission computed tomography study. Stroke. 2002;33(7):1857-1862.
102 Kleiser B., Widder B. Course of carotid artery occlusions with impaired cerebrovascular reactivity. Stroke. 1992;23(2):171-174.
103 Powers W.J., Derdeyn C.P., Fritsch S.M., et al. Benign prognosis of never-symptomatic carotid occlusion. Neurology. 2000;54(4):878-882.
104 Bornstein N.M., Norris J.W. Benign outcome of carotid occlusion. Neurology. 1989;39(1):6-8.
105 Widder B., Kleiser B., Krapf H. Course of cerebrovascular reactivity in patients with carotid artery occlusions. Stroke. 1994;25(10):1963-1967.
106 Powers W.J., Tempel L.W., Grubb R.L.Jr. Influence of cerebral hemodynamics on stroke risk: one-year follow-up of 30 medically treated patients. Ann Neurol. 1989;25(4):325-330.
107 Yamauchi H., Fukuyama H., Nagahama Y., et al. Evidence of misery perfusion and risk for recurrent stroke in major cerebral arterial occlusive diseases from PET. J Neurol Neurosurg Psychiatry. 1996;61(1):18-25.
108 Yamauchi H., Fukuyama H., Nagahama Y., et al. Significance of increased oxygen extraction fraction in five-year prognosis of major cerebral arterial occlusive diseases. J Nucl Med. 1999;40(12):1992-1998.
109 Mintun M.A., Raichle M.E., Martin W.R., et al. Brain oxygen utilization measured with O-15 radiotracers and positron emission tomography. J Nucl Med. 1984;25(2):177-187.
110 Videen T.O., Perlmutter J.S., Herscovitch P., et al. Brain blood volume, flow, and oxygen utilization measured with 15O radiotracers and positron emission tomography: revised metabolic computations. J Cereb Blood Flow Metab. 1987;7(4):513-516.
111 Powers W.J., Grubb R.L.Jr, Darriet D., et al. Cerebral blood flow and cerebral metabolic rate of oxygen requirements for cerebral function and viability in humans. J Cereb Blood Flow Metab. 1985;5(4):600-608.
112 Rothwell P.M., Eliasziw M., Gutnikov S.A., et al. Analysis of pooled data from the randomised controlled trials of endarterectomy for symptomatic carotid stenosis. Lancet. 2003;361(9352):107-116.
113 Derdeyn C.P., Videen T.O., Simmons N.R., et al. Count-based PET method for predicting ischemic stroke in patients with symptomatic carotid arterial occlusion. Radiology. 1999;212(2):499-506.
114 Derdeyn C.P., Videen T.O., Grubb R.L.Jr, et al. Comparison of PET oxygen extraction fraction methods for the prediction of stroke risk. J Nucl Med. 2001;42(8):1195-1197.
115 Hayashida K., Hirose Y., Tanaka Y. Stratification of severity by cerebral blood flow, oxygen metabolism and acetazolamide reactivity in patients with cerebrovascular disease. In: Ishii K., editor. Recent advances in biomedical imaging. Amsterdam: Elsevier; 1997:113-119.
116 Herold S., Brown M.M., Frackowiak R.S., et al. Assessment of cerebral haemodynamic reserve: correlation between PET parameters and CO2 reactivity measured by the intravenous 133 xenon injection technique. J Neurol Neurosurg Psychiatry. 1988;51(8):1045-1050.
117 Kanno I., Uemura K., Higano S., et al. Oxygen extraction fraction at maximally vasodilated tissue in the ischemic brain estimated from the regional CO2 responsiveness measured by positron emission tomography. J Cereb Blood Flow Metab. 1988;8(2):227-235.
118 Sugimori H., Ibayashi S., Fujii K., et al. Can transcranial Doppler really detect reduced cerebral perfusion states? Stroke. 1995;26(11):2053-2060.
119 Hasegawa Y., Minematsu K., Matsuoka H., et al. CBF Responses to Acetazolamide and CO2 for the Prediction of Hemodynamic Failure: A PET Study. Stroke. 1997;28(1):242.
120 Nemoto E.M., Yonas H., Chang Y. Stages and thresholds of hemodynamic failure. Stroke. 2003;34(1):2-3.
121 Nemoto E.M., Yonas H., Kuwabara H., et al. Identification of hemodynamic compromise by cerebrovascular reserve and oxygen extraction fraction in occlusive vascular disease. J Cereb Blood Flow Metab. 2004;24(10):1081-1089.
122 Imaizumi M., Kitagawa K., Oku N., et al. Clinical significance of cerebrovascular reserve in acetazolamide challenge -comparison with acetazolamide challenge H2O-PET and Gas-PET. Ann Nucl Med. 2004;18(5):369-374.
123 Yamauchi H., Okazawa H., Kishibe Y., et al. Oxygen extraction fraction and acetazolamide reactivity in symptomatic carotid artery disease. J Neurol Neurosurg Psychiatry. 2004;75(1):33-37.
124 Okazawa H., Tsuchida T., Kobayashi M., et al. Can the detection of misery perfusion in chronic cerebrovascular disease be based on reductions in baseline CBF and vasoreactivity? Eur J Nucl Med Mol Imaging. 2007;34(1):121-129.
125 Ogawa S., Lee T.M., Kay A.R., et al. Brain magnetic resonance imaging with contrast dependent on blood oxygenation. Proc Natl Acad Sci. 1990;87:9868-9872.
126 Ogawa S., Menon R.S., Tank D.W., et al. Functional brain mapping by blood oxygenation level-dependent contrast magnetic resonance imaging. Biophysical J. 1993;64:803-812.
127 Kwong K., Belliveau J.W., Chesler D.A., et al. Dynamic magnetic resonance imaging of human brain activity during primary sensory stimulation. Proc Natl Acad Sci U S A. 1992;89:5675-5679.
128 Fernandez-Seara M.A., Techawiboonwong A., Detre J.A., et al. MR susceptometry for measuring global brain oxygen extraction. Magn Reson Med. 2006;55(5):967-973.
129 He X., Yablonskiy D.A. Quantitative BOLD: mapping of human cerebral deoxygenated blood volume and oxygen extraction fraction: default state. Magn Reson Med. 2007;57(1):115-126.
130 An H., Lin W., Celik A., et al. Quantitative measurements of cerebral metabolic rate of oxygen utilization using MRI: a volunteer study. NMR Biomed. 2001;14:441-447.
131 Lin W., Derdeyn C.P., Celik A., et al. A Comparison of BOLD MRI and PET OEF Measurements on Patients with Carotid Artery Occlusion. Annual Meeting Society of Magnetic Resonance in Medicine. 1998;1155:1998.
132 Yamauchi H., Kudoh T., Kishibe Y., et al. Selective neuronal damage and chronic hemodynamic cerebral ischemia. Ann Neurol. 2007;61(5):454-465.
133 EC-IC Bypass Study Group. Failure of extracranial-intracranial arterial bypass to reduce the risk of ischemic stroke. Results of an international randomized trial. N Engl J Med. 1985;313(19):1191-1200.
134 Gibbs J.M., Wise R.J., Thomas D.J., et al. Cerebral haemodynamic changes after extracranial-intracranial bypass surgery. J Neurol Neurosurg Psychiatry. 1987;50(2):140-150.
135 Powers W.J., Martin W.R., Herscovitch P., et al. Extracranial-intracranial bypass surgery: hemodynamic and metabolic effects. Neurology. 1984;34(9):1168-1174.
136 Samson Y., Baron J.C., Bousser M.G., et al. Effects of extra-intracranial arterial bypass on cerebral blood flow and oxygen metabolism in humans. Stroke. 1985;16(4):609-616.
137 JET Study Group. Japanese EC-IC Bypass Trial (JET Study). Surg Cereb Stroke. 2002;30:434-437.
138 Brott T., Adams H.P.Jr, Olinger C.P., et al. Measurements of acute cerebral infarction: a clinical examination scale. Stroke. 1989;20(7):864-870.
139 Sulter G., Steen C., De Keyser J. Use of the Barthel index and modified Rankin scale in acute stroke trials. Stroke. 1999;30(8):1538-1541.
140 Williams L.S., Weinberger M., Harris L.E., et al. Development of a stroke-specific quality of life scale. Stroke. 1999;30(7):1362-1369.
141 Williams L.S., Weinberger M., Harris L.E., et al. Measuring quality of life in a way that is meaningful to stroke patients. Neurology. 1999;53(8):1839-1843.
142 Albers G.W., Hart R.G., Lutsep H.L., et al. AHA Scientific Statement. Supplement to the guidelines for the management of transient ischemic attacks: A statement from the Ad Hoc Committee on Guidelines for the Management of Transient Ischemic Attacks, Stroke Council, American Heart Association. Stroke. 1999;30(11):2502-2511.
[/level-membership-for-neurosurgery-category][not-level-membership-for-neurosurgery-category]
1 Autoregulation and Hemodynamics in Human Cerebrovascular Disease
Normal cerebral hemodynamics and energy metabolism
Normal Values of CBF and CMR
Healthy young adults have an average whole-brain cerebral blood flow (CBF) of approximately 46 ml 100g−1 min−1, cerebral metabolic rate of oxygen (CMRO2) of 3.0 ml 100g−1 min−1 (134 μmol 100g−1 min−1), and cerebral metabolic rate of glucose (CMRglc) of 25 μmol 100g−1 min−1.1–4 The CMRO2/CMRglc molar ratio of 5.4 is lower than the value of 6.0 expected for complete glucose oxidation due to the production of a small amount of lactate by glycolysis that occurs even with abundant oxygen supply.1,3,5 CBF in gray matter (80 ml 100g−1 min−1) is approximately four times higher than in white matter (20 ml 100g−1 min−1).6 Under normal physiological conditions, regional CBF is closely matched to the resting regional metabolic rate of the tissue.7,8 Thus CMRO2 and CMRglc are also higher in gray matter than in white matter. Because of this relationship between regional flow and metabolism, the fraction of blood-borne glucose and oxygen extracted is relatively constant throughout the brain (Figure 1–1). The oxygen extraction fraction (OEF) is normally 30% to 40%, indicating that oxygen supply is two to three times greater than oxygen demand. The glucose extraction fraction (GEF) is normally about 10%.8,9
Many studies report that CBF declines from the third decade onward.10–13 The change in metabolic rate for oxygen and glucose with age is less clear, with several studies showing a decrease 10,12,14–16 and others showing no change.17–19 Studies that have corrected for brain atrophy show lesser or absent changes in CBF, CMRO2, and CMRglc in the remaining tissue with increasing age.15,20–22 Our own data corrected for brain atrophy from 23 normal subjects, ages 23 to 71 years, show no significant change in CBF or CMRO2, but a significant decline in CMRglc of 4% to 5% per decade.
Control of CBF
Regional CBF (rCBF) is regulated by rCPP and the regional cerebrovascular resistance (rCVR):
When there is a primary reduction in the metabolic demand of brain cells, such as that caused by hypothermia or barbiturates, arterial resistance vessels constrict to produce a comparable decline in CBF and thus little or no change in OEF or GEF.23–25 With normal physiological increases in neuronal activity, vessels dilate, producing an increase in regional CBF that is accompanied by an increase in regional CMRglc of similar magnitude, but with little or no increase in regional CMRO2.26–28 Acute changes in arterial pCO2 cause proportional changes in CBF. The mechanism for the change in CBF is a change in CVR produced by vasodilation with increased pCO2 and vasoconstriction with decreased pCO2.29 With prolonged hyperventilation, CBF returns toward normal values over a period of several hours.30 The effects of changes in arterial pO2 on the cerebral circulation show a threshold effect, different from the proportional changes seen with changes in pCO2. CBF does not increase until arterial pO2 is below about 30 to 50 mm Hg.31,32 A significant reduction in hemoglobin saturation and hence in arterial oxygen content (CaO2) does not occur until arterial pO2 falls to about 50 to 60 mm Hg, indicating that it is primarily CaO2 and not pO2 that determines CBF.31,33,34 Reductions in CaO2 due to anemia cause vasodilation and compensatory increases in CBF, whereas the increase in CaO2 with polycythemia is associated with a decrease in CBF.34 Acute changes in CaO2 produce less of an increase in CBF than do chronic changes.35,36 Hematocrit is an important determinant of viscosity, and thus viscosity and CaO2 often vary together. It is unlikely that viscosity is an important determinant of CBF under most circumstances, however. Increases in blood viscosity induce compensatory vasodilation to maintain cerebral oxygen delivery (CBF x CaO2).37–39 When pre-existing vasodilation impairs the ability of vessels to dilate further to changes in viscosity, this compensatory mechanism may be exhausted.40 Thus increases in CBF brought about by hemodilution, if they are simply reciprocal responses to changes in arterial oxygen content, will not increase cerebral oxygen delivery and may even decrease it.41
In contrast to the relationship of CBF to oxygen supply and demand, the balance between glucose supply and demand has little effect on CBF. Severe reductions in blood glucose down to 1.1 to 2.2 mmol/L produced modest but significant increases in CBF of 12% to 23%.42–46 This CBF response to severe hypoglycemia likely does not represent a compensatory mechanism to maintain glucose delivery to the brain since a blood glucose level of 2 mmol/L is well below the level at which brain dysfunction and counter-regulatory hormone response occur.47 Furthermore, increases in CBF do not increase blood:brain glucose transport.48,49
Response of CBF to Changes in Cerebral Perfusion Pressure
Changes in CPP over a wide range have little effect on CBF.50 When CPP decreases, vasodilation of the small arteries or arterioles reduces CVR. When CPP increases, vasoconstriction of the small arteries or arterioles increases CVR.51,52 This compensatory mechanism is known as autoregulation.50 In most studies, the limits of autoregulation in normal normotensive subjects are from approximately 70 to 150 mm Hg.50,53 Strandgaard determined that the lower limit of autoregulation was 25 mm Hg below the resting BP in normotensive subjects.54 A contrasting viewpoint has been offered by Schmidt et al., who proposed a new computer method for assessing the lower limit of autoregulation.55 In this study, the lower limit in normotensive volunteers was only 85 mm Hg (11 mm Hg higher than that calculated from the conventional method) and at times was virtually identical to the baseline blood pressure. Within the limits of autoregulation, a 10% decrease in mean arterial pressure produces only a slight (2% to 7%) decrease in regional CBF.56,57 When CPP is reduced below the lower limit of autoregulation, more marked reductions in CBF occur. When the cerebral blood vessels are already dilated in response to some other stimulus, they are less able to dilate in response to reduced CPP. Therefore, the autoregulatory response is attenuated or lost in the setting of pre-existing hypercapnia, anemia, or hypoxemia.58,59
Chronic hypertension shifts both the lower and upper limits of autoregulation to higher levels. The average value of the lower limit of autoregulation in 13 poorly controlled hypertensive patients, ages 49 to 64, (113 ± 17 mm Hg) and 9 well-controlled hypertensives, ages 42 to 66, (96 ± 17 mm Hg) was elevated compared to 10 normotensive controls, ages 41 to 81 (73 ± 9 mm Hg).54 For all three groups combined, the lower limit of autoregulation was 70% to 80% of the resting MAP (r = 0.80). In another study, the lower limit was 88% to 89% of resting MAP (r = 0.81) for 19 normotensive and hypertensive subjects.55 Prolonged effective antihypertensive treatment may lead to a re-adaptation of autoregulation towards normal in some cases, but there are almost no data on this subject.54 Because of this upward shift of the lower limit, acute reductions in MAP or CPP that would be safe in normotensive subjects may precipitate cerebral ischemia in patients with chronic hypertension.60
These observations of the effect of changes in CPP on CBF were made by changing MAP or ICP over minutes, then measuring CBF at the new stable pressure. Recently, these responses have been termed “static cerebral autoregulation” to differentiate them from measurements of cerebral blood flow velocity with Doppler in response to more rapid and less marked fluctuations in MAP or ICP, termed “dynamic cerebral autoregulation.”61 The relationship between static and dynamic autoregulation is not clear. Abnormalities of dynamic cerebral autoregulation may be associated with normal or abnormal static autoregulation.62,63
When CPP falls below the autoregulatory limit and the maximum compensatory vasodilatory capacity of the cerebral circulation has been exceeded, CBF will decline markedly with further reductions in CPP. A progressive increase in OEF occurs as CBF falls and oxygen metabolism is maintained (Figure 1–2).64–66 OEF may increase by a factor of 2 or even more from its normal value of 30% to 40%.65 When the increase in OEF is maximal and is no longer adequate to supply the energy needs of the brain, further reductions in CPP disrupt normal cellular metabolism, produce clinical evidence of brain dysfunction, and, if prolonged, will cause permanent damage.
Cerebral blood volume (CBV) is the volume of circulating blood in cerebral vessels. CBV is composed of arterial, capillary, and venous segments. Veins account for some 80% to 85% of CBV, arteries 10% to 15%, and capillaries less than 5%.67,68 Arteries are the most responsive to autoregulatory changes in CPP, veins respond less and capillaries even less.69,70 During experimental reductions in CPP, it is often possible to measure an increase in CBV that is presumed to be due to autoregulatory vasodilation.71–73 However, this increase in CBV to reduced CPP is not always evident (Figure 1–2),66,74 and a decrease in CBV in response to severe reductions in CPP has even been observed.75 Failure to demonstrate increased CBV in the setting of reduced CPP has been attributed to various possible mechanisms, including differential vasodilatory capacity of different vascular beds, passive collapse of vessels due to low intraluminal pressures, small vessel vasospasm, and re-setting of vascular tone in response to reduced metabolic demands.76 The CBF/CBV ratio (or its reciprocal, the vascular mean vascular transit time, MTT) has been proposed to be a more sensitive indicator of reduced CPP than CBV alone.66,77 Although it may be more sensitive, it is not reliable because it may decrease in conditions with low CBF and normal CPP, such as hypocapnia.78,79
Cerebral hemodynamic effects of arterial occlusive disease
Hemodynamic Effect of Arterial Stenosis
Stenosis of the carotid artery produces no hemodynamic effect until a critical reduction of 60% to 70% in vessel lumen occurs. Even with this or greater degrees of stenosis, distal CPP is variable and may even remain normal with stenosis exceeding 90%.80 This is because hemodynamic effect of carotid artery stenosis depends not only on the degree of stenosis but also on the adequacy of the collateral circulation. Vascular imaging techniques such as angiography or Doppler ultrasonography can identify the presence of these collateral vessels, but not necessarily the adequacy of the blood supply they provide.81
In patients with cerebrovascular disease, determining the hemodynamic effects of arterial stenosis or occlusion is of potential value in predicting the subsequent stroke risk or for choosing preventative therapy. Measurement of rCBF alone is inadequate for this purpose. Normal rCBF may be found when rCPP is reduced but rCBF is maintained by autoregulatory vasodilation of distal resistance vessels. Second, rCBF may be low when rCPP is normal, such as when the metabolic demands of the tissue are reduced by previous ischemic damage or by the destruction of afferent or efferent fibers by a remote lesion (Figure 1–3).65
Methods to Measure the Hemodynamic Effects of Large Artery Occlusive Disease
Three strategies are commonly used clinically to determine the local cerebral hemodynamic status. The first relies on measurement of rCBF at baseline and again after a vasodilatory stimulus, such as CO2 inhalation, breath holding, acetazolamide administration, or physiological activity (e.g., hand movement). An impairment in the normal increase of rCBF or Doppler blood flow velocity in response to the vasodilatory stimulus is assumed to reflect existing autoregulatory vasodilation due to reduced rCPP. Responses to vasodilatory stimuli have been categorized into three grades of hemodynamic impairment: (1) reduced augmentation (relative to contralateral hemisphere or normal controls), (2) absent augmentation (same value as baseline), and (3) paradoxical reduction in regional blood flow compared with baseline measurement. This last category, also known as the “steal” phenomenon, can only be identified with quantitative CBF techniques.82
The pattern of arteriographic collateral circulation to the MCA distal to an occluded carotid artery does not consistently differentiate those patients with poor cerebral hemodynamics (Table 1–1).74,81,83,84
Table 1–1 Arteriographic collateral patterns in Patients from St. Louis Carotid Occlusion Study.
| High OEF | Normal OEF | |
|---|---|---|
| Acomm | 27/32 | 26/30 |
| Pcomm | 6/13 | 13/18 |
| ECA-OA | 19/31 | 10/28 |
| ECA-Other | 3/29 | 6/28 |
| Cortical | 2/29 | 5/23 |
Three-Stage Classification System of Cerebral Hemodynamics
Based on the known physiological responses of CBF, CBV, and OEF to reductions in CPP, we proposed a three-stage sequential classification system for the regional cerebral hemodynamic status in patients with cerebrovascular disease.85 Stage 0 is normal with normal rCPP and normally matched regional CBF and CMRO2, such that rOEF is normal, rCBV and rMTT are not elevated and the rCBF response to vasodilatory stimuli is normal. Stage I hemodynamic compromise represents reduced rCPP, but is still above the lower autoregulatory limit. It is manifested by autoregulatory vasodilation of arterioles to maintain rCBF matched to rCMRO2. Consequently, rCBV and rMTT are increased and the rCBF response to vasodilatory stimuli is decreased, but rOEF remains normal. In Stage II hemodynamic failure, rCPP is below the lower autoregulatory limit. There is a decrease in CBF relative to rCMRO2 with increased OEF (Figure 1–4). This stage has also been termed “misery perfusion” by Baron et al.86,87 In all of these stages, rCMRO2 is preserved at a level that reflects the underlying energy demands of the tissue, but may be lower than normal due to the effects of previous tissue damage or deafferentation (Figure 1–3).65,88
Although the three-stage classification scheme is conceptually and practically useful, it is overly simplistic. First, as discussed above, increases in rCBV and rMTT are not reliable indices of reduced rCPP. Second, rCBF responses to different vasodilatory agents may be impaired or normal in the same patient.89–91 A normal vasodilatory response may occur in the setting of increased rCBV.92,93 Finally, according to the three-stage system, all patients with increased rOEF should have increased rCBV and poor response to vasoactive stimuli. However, this increase in rCBV is not always evident.76
Correlation of Large Artery Cerebral Hemodynamics with Stroke Risk
Stage I Hemodynamic compromise
Data on vasomotor reactivity to acetazolamide or hypercapnia (Stage I hemodynamic compromise) in predicting subsequent stroke have been inconsistent.83,94–101
Yonas and colleagues tested cerebrovascular reserve by paired rCBF measurements with the stable Xenon/CT and acetazolamide in 68 patients with carotid artery disease followed for a mean of 24 months.99 Patients were placed into two groups based on criteria for hemodynamic compromise of initial rCBF values less than 45 ml 100 g−1 min−1 and rCBF reduction after acetazolamide of more than 5%. This categorization was done retrospectively based on assessment of the characteristics of the patients who went on to develop stroke. There were two contralateral strokes in 27 patients with normal hemodynamics and eight ipsilateral strokes in 41 patients with hemodynamic compromise. In a subsequent report by these authors, 27 additional patients were included in an analysis of 95 patients with either stenosis of 70% or carotid artery occlusion.95 The patients were followed for a mean of 19.6 months. These patients were classified into two groups based only on a rCBF reduction of more than 5% to acetazolamide, different criteria than those used in the first study. From the data presented it is possible to determine that three of the five strokes that occurred in the additional 27 patients did so in patients who would not have met criteria for hemodynamic compromise in the first study. Only two of these five new strokes were in the hemodynamically compromised territory of the occluded vessel. Thus the previously retrospectively derived criteria for identifying patients at high risk failed when subjected to a prospective test on a new group of 27 patients.
Kleiser and Widder tested the cerebrovascular reserve capacity in 85 patients with internal carotid artery (ICA) occlusion using transcranial Doppler during normocapnia, hypercapnia, and hypocapnia.102 At the time of entry into the study, 46 patients were asymptomatic on the ipsilateral side of the occlusion. The patients were followed for a mean of 38 months. In the group with normal CO2 reactivity, four of 48 patients had an ipsilateral TIA or prolonged reversible ischemic neurological deficit, but none had a stroke. Six of 26 patients with diminished CO2 reactivity had an ipsilateral ischemic event (three [12%] strokes, three TIAs), and three patients had a contralateral event (two strokes, one TIA). In the group with exhausted CO2 reactivity, five of 11 patients (45%) had an ipsilateral stroke and one patient had an ipsilateral TIA. Two patients had a contralateral hemisphere stroke. Although this study found a significant association between CO2 reactivity of the cerebral circulation and ischemic events ipsilateral to an ICA occlusion, there was no significant relationship between prior symptoms and subsequent stroke risk. This is puzzling since the prognosis of asymptomatic carotid occlusion is relatively benign.103,104 The increased risk of contralateral stroke in the patients with a diminished or exhausted CO2 reactivity suggests that the groups were not matched for other stroke risk factors, and this may explain the differences observed. In a subsequent report by these authors, 86 patients with carotid artery occlusion were followed for variable periods of time.105 A stroke ipsilateral to an occluded ICA occurred in three of 26 patients with an exhausted CO2 reactivity, corresponding to an annual stroke rate of only 8% (mean follow-up time of 19 months), much lower in the first study. In 37 patients with diminished CO2 reactivity and 48 patients with normal CO2 reactivity, only one patient in each group developed an ipsilateral stroke (mean follow-up time of 31.7 months). In this second study, the number of asymptomatic patients is not given. The 86 patients in the second study were selected from 452 patients with ICA occlusion studied with transcranial Doppler cerebrovascular resistance studies. The criteria for selecting these 86 patients were not given.
Vernieri et al. have published a well-designed and well-executed prospective study of 65 patients with both symptomatic and asymptomatic carotid occlusion.97 Hemodynamic compromise was assessed by using transcranial Doppler measurement of middle cerebral artery (MCA) blood flow velocity during breath holding. Multivariate analysis found only older age and impaired Doppler velocity increase during breath holding to be associated with the subsequent risk of ipsilateral ischemic events (TIA and stroke). No separate analysis of symptomatic patients and no separate analysis of predictive value for stroke only was reported nor was any data on subsequent medical treatment.
Kuroda and colleagues enrolled 77 symptomatic patients in a prospective, longitudinal cohort study. All patients met inclusion criteria of cerebral angiography, no or localized cerebral infarction on MRI or CT, and no or minimal neurological deficit. Regional rCBF and regional cerebrovascular reactivity to CVR to acetazolamide were quantitatively determined by 133Xe SEPCT. During an average follow-up period of 42.7 months, 16 total and seven ipsilateral ischemic strokes occurred. Decreased cerebrovascular reactivity to acetazolamide alone did not predict the subsequent occurrence of stroke. Only the combination of decreased rCBF and decreased cerebrovascular reactivity identified those with a high annual risk for both total and ipsilateral stroke (35.6% and 23.7%, respectively). Kaplan-Meier analysis revealed that the risks of total and ipsilateral stroke in the 11 patients with this combination were significantly higher than in the 66 without (P < 0.0001 and P = 0.0001, respectively, log-rank test). Relative risk was 8.0 (95% confidence interval [CI], 1.9 to 34.4) for ipsilateral stroke and 3.6 (95% CI, 1.4 to 9.3) for total stroke.94
In addition to these reported positive associations, other studies with prospectively defined criteria have failed to demonstrate a relationship between the risk of subsequent stroke and Stage I hemodynamic compromise.96,106 We reported a longitudinal study of stroke risk in 21 medically treated patients with increased CBV/CBF ratios distal to a stenotic or occluded artery. No ipsilateral ischemic strokes occurred during the 1-year follow-up period.106 Yokota et al. derived criteria for abnormal acetazolamide SPECT CBF responses from a comparison of paired studies of PET OEF in 14 subjects and then used the SPECT criteria to study 105 patients with ischemic cerebrovascular events, minimal infarct on a CT scan, and unilateral occlusion or severe stenosis of the ICA or proximal MCA.96 Fifty-five patients had abnormal cerebral vasoreactivity response to acetazolamide and 50 patients had a normal response. Risk factors for stroke at entry were recorded and included in the final data analysis. The median follow-up period in the study was 32.5 months. During the follow-up period, 13 patients had a stroke, 11 died, 16 had surgical cerebral revascularization procedures (nine EC-IC bypasses and seven carotid endarterectomies), and 11 were lost to follow-up. There was no significant difference in the rate of subsequent stroke in the two groups. This was generally a well-planned, well-executed prospective study that addressed the possible impact of other risk factors in the largest study reported to date. A relatively large number of patients were censored from the study because of subsequent cerebrovascular surgery and loss to follow-up. Since the criteria used for separating patients into those with normal and abnormal cerebrovascular reactivity were based on a previous study that demonstrated complete congruence with PET measurements of OEF,92 the negative results of this study are puzzling in the light of two PET studies that both demonstrated a strong association between increased OEF and subsequent stroke (see following). As opposed to other studies comparing CBF response to vasodilatory stimuli and PET OEF, these investigators were able to identify a threshold that was 100% sensitive and 100% specific based on a study of both modalities in 14 patients. It is likely that this small sample of patients was not sufficient to really determine the relationship between the two modalities and the threshold chosen did not reliably correlate with PET OEF in the larger sample of 105 patients followed prospectively.
In 2002, Ogasawara and colleagues published a well-designed, well-executed prospective study of cerebrovascular reactivity (CVR) to acetazolamide using quantitative measurements of CBF with 133Xe inhalation and single-photon emission computed tomography.101
[/not-level-membership-for-neurosurgery-category]
