Chapter 13 Assessment of Growth
A critical component of pediatric health surveillance is the assessment of a child’s growth. Growth results from the interaction of genetics, health, and nutrition. Many biophysiologic and psychosocial problems can adversely affect growth, and aberrant growth may be the first sign of an underlying problem. The most powerful tool in growth assessment is the growth chart (see Figs . 9-1, 9-2, and 13-1 on the Nelson Textbook of Pediatrics website at www.expertconsult.com  ) used in combination with accurate measurements of height, weight, head circumference, and calculation of the body mass index (BMI).
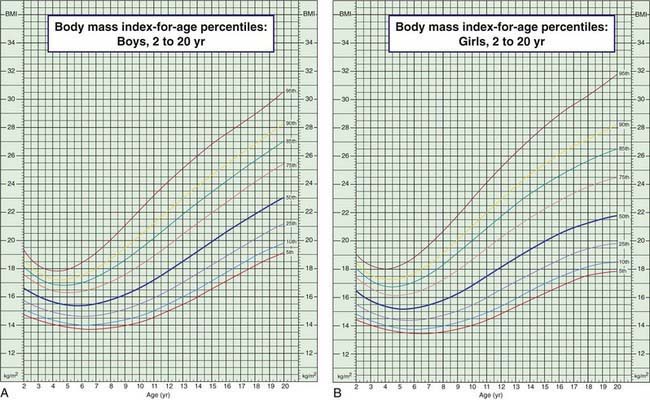
Figure 13-1 Body mass index (BMI) percentiles for boys (A) and girls (B) age 2-20 yr. (Official Centers for Disease Control [CDC] growth charts, as described in this chapter. The 85th to 95th percentile is at risk for overweight; >95th percentile is overweight; <5th percentile is underweight. Technical information and interpretation and management guides are available at www.cdc.gov/nchs.)
Derivation and Interpretation of Growth Charts
The data are presented in 5 standard gender-specific charts: (1) weight for age; (2) height (length and stature) for age; (3) head circumference for age; (4) weight for height (length and stature) for infants; and (5) BMI for age for children over 2 yr of age (Fig. 13-1; also see Figs. 9-1 and 9-2). The charts are available at www.cdc.gov/growthcharts/.
Each chart is composed of percentile curves, representing the cross-sectional distribution of weight, length, stature, head circumference, weight for length, or BMI at each age. The percentile curve indicates the percentage of children at a given age on the x-axis whose measured value falls below the corresponding value on the y-axis. On the weight chart for boys 0-36 mo of age (see Fig. 9-1A), the 9 mo age line intersects the 25th percentile curve at 8.6 kg, indicating that 25% of the 9 mo old boys in the National Center for Health Statistics sample weigh less than 8.6 kg (75% weigh more). Similarly, a 9 mo old boy weighing more than 11.2 kg is heavier than 95% of his peers. The median or 50th percentile is also termed the standard value, in the sense that the standard height for a 7 mo old girl is 67 cm (see Fig. 9-1B). The weight-for-height charts (see Fig. 9-2) are constructed in an analogous fashion, with length or stature in place of age on the x-axis; the median or standard weight for a girl measuring 110 cm is 18.6 kg.
In an effort to set an internationally usable standard for optimal growth in young children, in 2006 the World Health Organization released growth charts based on the Multicenter Growth Reference Study (MGRS). Rather than describing the growth of typical children, the MGRS describes the growth of children who are predominantly breast-fed and raised under optimal conditions. Six study sites representing 5 continents were included: USA, Brazil, Norway, Ghana, Oman, and India. Use of the new charts in developing nations results in identification of many more children as malnourished and eligible for therapeutic feeding programs. Their use in the USA results in many fewer infants being identified as underweight (comparison of curves shown in Fig. 13-2). Charts are available online at www.who.int/childgrowth/standards/en/.
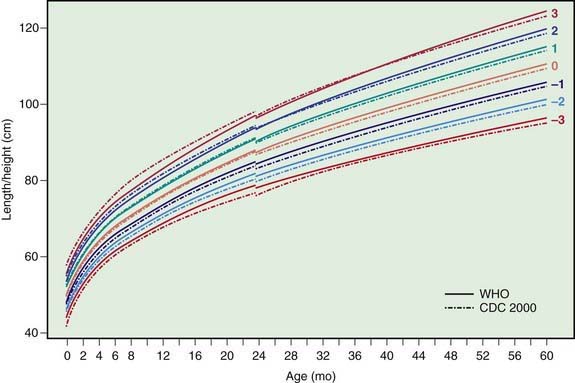
Figure 13-2 Comparison of the WHO and CDC length/height-for-age z score curves for boys.
(From de Onis M, Garza C, Onyango AW, et al: Comparison of the WHO child growth standards and the CDC 2000 growth charts, J Nutr 137[1]:144–148, 2007.)
Body mass index for age complements the standard growth charts for children over 2 yr of age. BMI can be calculated as weight in kilograms/(height in meters)2 or weight in pounds/(height in inches)2 × 703, with fractions of pounds and inches expressed as decimals. Values may be plotted on standard BMI charts (see Fig. 13-1). These calculations can be easily performed electronically using a variety of desktop and hand-held devices. BMI percentile varies with age over childhood: a 6 yr old girl with a BMI of 21 is overweight, whereas a 16 yr old girl with the same BMI is just above the 50th percentile.
Analysis of Growth Patterns
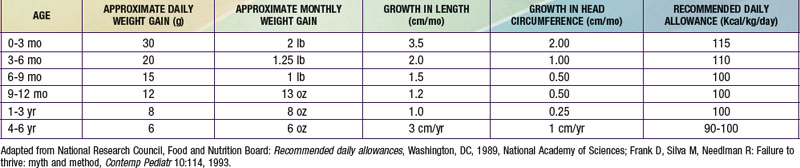
Growth is a process rather than a static quality. An infant at the 5th percentile of weight for age may be growing normally, may be failing to grow, or may be recovering from growth failure, depending on the trajectory of the growth curve. Infants may lose up to 10% of their birth weight in the 1st wk of life and regain it by the end of the 2nd wk. They will then gain steadily at a rate of 20-30 g/day for the first 3 mo. Table 13-1 gives typical growth and calorie requirements for children through age 6 yr. Formulas are available for the estimation of average height and weight and height for children of various ages, but given their complexity and the easy availability of growth charts, use of the latter is preferable.
It is important to correct for various factors in plotting and interpreting growth charts. For premature infants, overdiagnosis of growth failure can be avoided by using growth charts developed specifically for this population. A cruder method, subtracting the weeks of prematurity from the postnatal age when plotting growth parameters, does not capture the variability in growth velocity that very low birthweight (VLBW) infants demonstrate. While VLBW infants may continue to show catch-up growth through early school age, most achieve weight catch-up during the 2nd yr and height catch-up by 2.5 yr, barring medical complications (Chapter 91). For children with particularly tall or short parents, there is a risk of overdiagnosing growth disorders if parental height is not taken into account or, conversely, of underdiagnosing growth disorders if parental height is accepted uncritically as the explanation.
The analysis of growth patterns and the detection of aberrant growth patterns provide critical information for the detection of pathologic conditions. Calculation of daily and monthly growth, such as weight gain in g/day (see Table 13-1), allows more precise comparison of growth rate to the norm. Weight loss, or failure to gain normally, is often the first sign of pathology.
The diagnosis of failure to thrive (Chapter 38), usually a diagnosis of children under 3 yr of age, is considered if a child’s weight is below the 5th percentile, if it drops down more than 2 major percentile lines, or if weight for height is less than the 5th percentile. Weight for height below the 5th percentile remains the single best growth chart indicator of acute undernutrition. A BMI less than the 5th percentile also indicates that a child is underweight. Brief periods of weight loss or poor weight gain are usually rapidly corrected and do not permanently affect size. Children who have been chronically malnourished may be short (stunted) as well as thin, so that their weight-for-height curves may appear relatively normal. Chronic, severe undernutrition in infancy may depress head growth, which may be an ominous predictor of later cognitive disability. Low weight for age or height or weight loss may be referred to as wasting.
Another way to evaluate weight is to determine the ideal body weight for height and compare the current weight to the ideal body weight for length or height. A 15 mo old boy who is 79 cm is at the 50th percentile. The ideal weight is 12 kg. If he weighs 8 kg (<5th percentile), he is 67% of ideal body weight, an indication of severe wasting. Table 13-2 provides interpretation of percent ideal body weight from obese to severe wasting.
| >120% | Obese |
| 110-120% | Overweight |
| 90-110% | Normal variation |
| 80-90% | Mild wasting |
| 70-80% | Moderate wasting |
| <70% | Severe wasting |
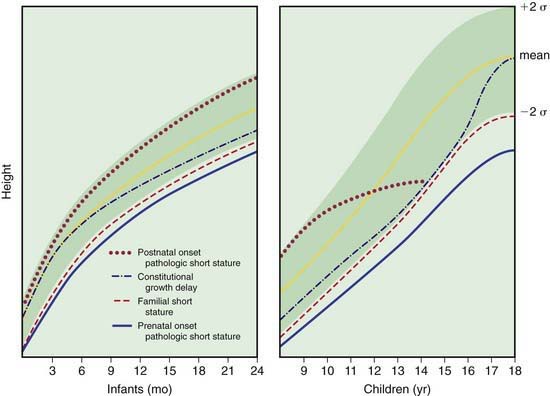
Linear growth deficiency (stunting) is more likely to be due to congenital, constitutional, familial, or endocrine causes than to nutritional deficiency (Chapter 43). In endocrine disorders, length or height declines first or at the same time as weight; weight for height is normal or elevated. In nutritional insufficiency, weight declines before length, and weight for height is low (unless there has been chronic stunting). Figure 13-3 depicts typical growth curves for 4 classes of decreased linear growth. In congenital pathologic short stature, an infant is born small and growth gradually tapers off throughout infancy. Causes include chromosomal abnormalities (Turner syndrome, trisomy 21; Chapter 76), perinatal infection (TORCH), extreme prematurity, and teratogens (phenytoin, alcohol) (Chapter 90). In constitutional growth delay, weight and height decrease near the end of infancy, parallel the norm through middle childhood, and accelerate toward the end of adolescence. Adult size is normal. In familial short stature, both the infant and the parents are small; growth runs parallel to and just below the normal curves.
Other Indices of Growth
Skeletal Maturation
Reference standards for bone maturation facilitate estimation of bone age (see Table 8-3). Bone age correlates well with stage of pubertal development and can be helpful in predicting adult height in early- or late-maturing adolescents. In familial short stature, the bone age is normal (comparable to chronological age). In constitutional delay, endocrinologic short stature, and undernutrition, the bone age is low and comparable to the height age. Skeletal maturation is linked more closely to sexual maturity rating than to chronological age. It is more rapid and less variable in girls than in boys.
Dental Development
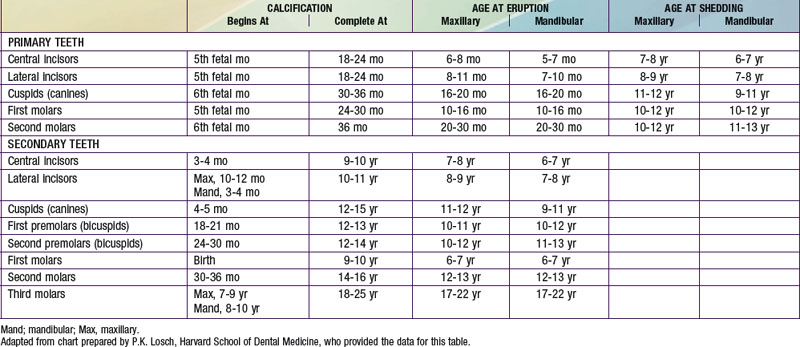
Dental development includes mineralization, eruption, and exfoliation (Table 13-3). Initial mineralization begins as early as the 2nd trimester (mean age for central incisors, 14 wk) and continues through 3 yr of age for the primary (deciduous) teeth and 25 yr of age for the permanent teeth. Mineralization begins at the crown and progresses toward the root. Eruption begins with the central incisors and progresses laterally. Exfoliation begins at about 6 yr of age and continues through 12 yr of age. Eruption of the permanent teeth may follow exfoliation immediately or may lag by 4-5 mo. The timing of dental development is poorly correlated with other processes of growth and maturation. Delayed eruption is usually considered when there are no teeth by approximately 13 mo of age (mean + 3 standard deviations). Common causes include hypothyroid, hypoparathyroid, familial, and (the most common) idiopathic. Individual teeth may fail to erupt because of mechanical blockage (crowding, gum fibrosis). Causes of early exfoliation include histiocytosis X, cyclic neutropenia, leukemia, trauma, and idiopathic factors. Nutritional and metabolic disturbances, prolonged illness, and certain medications (tetracycline) commonly result in discoloration or malformations of the dental enamel. A discrete line of pitting on the enamel suggests a time-limited insult.
American Academy of Pediatrics. Pediatric nutrition handbook, ed 6. Elk Grove Village, IL: American Academy of Pediatrics; 2009.
Ben-Joseph ED, Woshen SA, Isenberg N. Do parents understand growth charts? A national internet based study. Pediatrics. 2009;124:1100-1109.
Centers for Disease Control and Prevention, National Center for Health Statistics. CDC growth charts (website), www.cdc.gov/growthcharts/, 2010. Accessed February 22
Centers for Disease Control and Prevention. Impact of new WHO growth standards on the prevalence of acute malnutrition and operations of feeding programs—Darfur, Sudan, 2005–2007. MMWR Morb Mortal Wkly Rep. 2009;58:591-594.
de Onis M, Garza C, Onyango AW, et al. Comparison of the WHO child growth standards and the CDC 2000 growth charts. J Nutr. 2007;137:144-148.
Grummer-Strawn LM, Shealy KR. Progress in protecting, promoting, and supporting breastfeeding: 1984–2009. Breastfeed Med. 2009;4(Suppl 1):S31-S39.
Guo SS, Roche AF, Chumlea WC, et al. Growth in weight, recumbent length and head circumference for preterm low-birthweight infants during the first three years of life using gestation-adjusted ages. Early Hum Dev. 1997;47:305-325.
Hochberg Z, Albertsson-Wikland K. Evo-devo of infantile and childhood growth. Pediatr Res. 2008;64:2-7.
Kerac M, Egan R, Mayer S, et al. New WHO growth standards: roll-out needs more resources. Lancet. 2009:100-102.
Lapidus N, Luquero FJ, Gabouland V, et al. Prognostic accuracy of WHO growth standards to predict mortality in a large-scale nutritional program in Niger. PloS Med. 2009;6:1-8.
Mei Z, Ogden CL, Flegal KM, et al. Comparison of the prevalence of shortness, underweight, and overweight among US children aged 0 to 59 months using the CDC 2000 and the WHO 2006 growth charts. J Pediatr. 2008;153:622-628.
Ogden CL, Kuczmarski RJ, Flegal KM, et al. Centers for Disease Control and Prevention 2000 growth charts for the United States: improvements to the 1977 National Center for Health Statistics version. Pediatrics. 2002;109:45-60.
Tanner JM, Davies PSW. Clinical longitudinal standards for height and height velocity for North American children. J Pediatr. 1985;107:317-329.
Van Buuren S, van Wouwe JP. WHO child growth standards in action. Arch Dis Child. 2008;93:549-551.
World Health Organization. The WHO child growth standards (website), www.who.int/childgrowth/standards/en, 2010. Accessed March 9