[level-membership-for-pediatrics-category]
Chapter 39 Assessment and Monitoring of Respiratory Function
The majority of children admitted to the pediatric intensive care unit (PICU) present with cardiorespiratory disease or with an acute illness that may progress to involve the respiratory system, emphasizing the need for careful monitoring of respiratory parameters. Close respiratory examination and monitoring allow titration of therapies to minimize ventilator-induced injury, optimize patient-ventilator interaction, and aid in weaning from the ventilator.1
Physical Examination of the Respiratory System
Evaluation of breath sounds provides assessment of airflow through the tracheobronchial tree, the presence of fluid in or obstruction of the airways, and conditions outside the lung and pleural space. The child’s chest wall is thinner than that of the adult, which allows better access to breath sounds but impedes localization of the lesion because the breath sounds can be referred. Upper airway abnormalities may present with stridor or muffling of the voice. Bronchial breath sounds suggest consolidation, whereas wheezes result from narrowed airways. Crackles may be fine or coarse. They represent air bubbling through secretions and the reopening of closed airways. A friction rub may be heard when the inflamed surfaces of the pleura move against each other through the respiratory cycle. Breath sounds may be absent if there is a significant pleural effusion or complete lobar collapse resulting from a mucus plug or pneumothorax. Heart tones often are shifted away from the pneumothorax and toward the atelectasis because of complete airway obstruction. Assessment for pulsus paradoxus (i.e., exaggerated decrease in the pulse or systolic blood pressure with inspiration) should be made during the evaluation of severe airway obstruction or pulmonary embolus.
Although each assessment should include observation and a limited physical examination, it is recognized that interobserver repeatability of physical signs is poor and independent of the experience of the observer.2 The assessments of clubbing, wheezes, friction rub, and crackles are the most reliable and reproducible.2,3 The lack of accuracy of repeated physical examinations and the complexity of critically ill pediatric patients require adjunctive tests/assessments to monitor these patients.
Radiography
Portable chest x-ray films are the most common films taken in the PICU. The technical quality of the chest radiograph affects the interpretation; therefore, it is important to assess the film for adequacy of penetration, degree and symmetry of lung inflation, and degree of chest rotation. Chest x-ray films can be used to evaluate for cardiac, vascular, bone, and lung abnormalities, to assess for device placement (e.g., an endotracheal tube), and to determine the need for intervention.4 Lateral decubitus films help identify and quantify pleural effusions, pneumothorax, and the position of chest tubes/lines. Cross-table lateral films also may be used for these purposes but are harder to interpret. A chest computed tomography (CT) scan is used when details on the plain film are obscured by the superimposition of structures or an opaque hemithorax. A chest CT scan also can be used to guide drainage of fluid collections and assist in obtaining biopsy specimens. A high-resolution chest CT scan examines 1- to 1.5-mm slices at 10-mm intervals; therefore it can be used to illustrate lung parenchymal details better than a conventional CT scan, which examines 7- to 10-mm slices at 10-mm intervals.5 This detail can be helpful in distinguishing the pathologic process causing diffuse lung diseases that appear as diffuse lung shadowing on chest x-ray films. Chest ultrasound, ventilation/perfusion scanning, spiral CT, and magnetic resonance imaging may be useful adjutants depending on the disease process.
Noninvasive Respiratory Monitoring
Pulse Oximetry
Pulse oximetry is considered a significant technologic advance that has improved patient safety.1,6–9 Its ease of application and accuracy have resulted in widespread use. Pulse oximetry is commonly used to detect hypoxemia and to wean the oxygen concentration in patients undergoing mechanical ventilation.
Pulse oximetry is based on the principles that (1) the pulsatile absorbance detected is arterial blood and (2) oxyhemoglobin and reduced hemoglobin have different absorption spectra.6 Red (660-nm) and infrared (940-nm) wavelengths of light are used to determine the ratio of oxygenated to deoxygenated blood. Deoxygenated blood absorbs more red light, whereas oxygenated blood absorbs more infrared light. The two wavelengths are passed through an arterial bed, and the ratio of infrared and red light transmitted to the photodetector is determined. The ratio is calibrated against measurements of arterial oxygen saturations from human volunteers and their absorbance ratios.
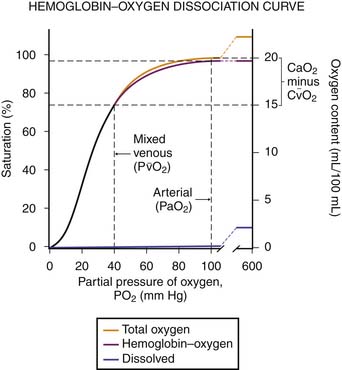
Several factors may affect the accuracy of pulse oximetry. Pulse oximetry measures oxygen saturation (SaO2). SaO2 and PaO2 are not linearly related; the oxyhemoglobin dissociation curve is sigmoid in shape (Figure 39-1). Large changes in PaO2 at high levels of oxygen, the upper flat portion of the oxyhemoglobin dissociation curve, may occur with little change in saturation. Additionally, a reduction in oxygenation on the steep portion of the curve may not be appreciated as significant because only a small change in saturations will have occurred.6,7 The accuracy of pulse oximetry falls with arterial oxygen saturations less than 70%.1,6 At arterial oxygen saturations below 70%, pulse oximetry may be more appropriate for showing trends.6
Abnormal hemoglobin levels (carboxyhemoglobin, methemoglobin) that have similar absorbance spectra can lead to overestimation of the true SaO2.6 Intravenous dyes and certain colors of nail polish may falsely lower pulse oximetry readings.
Pulse oximetry sensors may be unable to distinguish a true signal from background in low perfusion states that result in diminished pulsations (e.g., vasoconstriction, low cardiac output, and hypothermia). This situation usually is displayed as an inadequate pulse message.1 Low peripheral perfusion and motion artifact are the most common causes of inaccurate pulse oximetry readings.9–11 Newer designs of pulse oximeters with signal-progressing algorithms that detect and ignore motion and pulse rate interferences may overcome these limitations.10,11
The complications of pulse oximetry are rare. They include skin burns and pressure necrosis in newborns.1,6 Limited understanding of pulse oximetry by health care providers may be an underrecognized problem, along with time spent determining whether alarms are false.9,12
Capnography
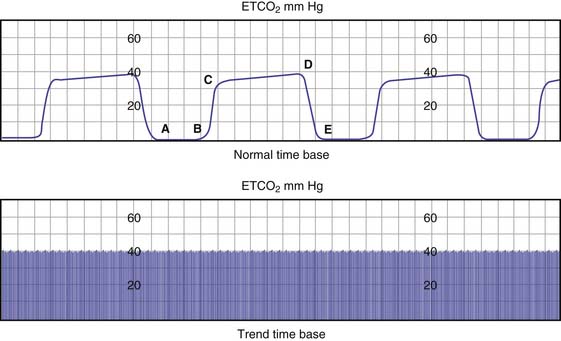
End-tidal carbon dioxide monitoring is the noninvasive measurement of exhaled carbon dioxide at the plateau of the carbon dioxide waveform (Figure 39-2). End-tidal carbon dioxide concentration reflects PaCO2, cardiac output, percentage of dead space, and airway time constants. In healthy subjects, the end-tidal carbon dioxide concentration is 1 to 5 mm Hg less than the PaCO2.13 End-tidal carbon dioxide concentration represents the PCO2 of all ventilated alveoli, whether or not they are perfused. Therefore any condition that reduces pulmonary perfusion of ventilated alveoli increases the difference between PaCO2 and end-tidal carbon dioxide. Comparison between end-tidal carbon dioxide concentration and PaCO2 helps to differentiate between change in alveolar ventilation, CO2 production, or pulmonary perfusion as a cause of the change in end-tidal carbon dioxide concentration. Additionally, end-tidal carbon dioxide monitoring can be used to verify tracheal intubation, detect complete airway obstruction, and monitor ventilation during sedation.13–16
Sampling of exhaled carbon dioxide can be at the patient-ventilator interface (mainstream), diverted to a monitor (sidestream), or an intermediate connection.16 The exhaled gas sample is exposed to various wavelengths of infrared light. The relative amount of light absorbed by the exhaled sample is compared with the amount of light absorbed by a sample that does not contain carbon dioxide. The difference between the two samples is the concentration of carbon dioxide. Carbon dioxide also can be measured semiquantitatively using a pH-sensitive indicator that changes from purple to yellow when exposed to carbon dioxide.14
Arterial Blood Gas Monitoring
Intermittent samples of arterial blood can be obtained from a single arterial puncture or an indwelling arterial line. Although convenient and frequently used, they offer isolated data points of continuous physiologic changes. Because of limitations such as the spontaneous variability in patients over time, the fact that blood gas is often obtained after an event has occurred, and the significant amount of lag time in therapeutic decisions that may ensue, interest in the development and use of continuous arterial blood gas monitoring exists.17

where Qs is shunt, Qt is total flow, CcO2 is pulmonary capillary oxygen content, CaO2 is arterial oxygen content, and CvO2 is mixed venous oxygen content. Applying this equation requires measurement of a mixed venous sample collected from the right ventricle or the pulmonary outflow track (i.e., placement of a pulmonary artery catheter). This equation does not identify the site or cause of the shunt.
Calculation of the alveolar-arterial oxygen tension difference (AaDO2 = PAO2 − PaO2) helps to differentiate hypoxemia caused by hypoventilation from diffusion abnormalities, ventilation/perfusion (V/Q) mismatch, or shunt. It has the advantage of not requiring mixed venous blood sampling, but it does require alveolar PAO2, which is difficult to measure. Instead of direct measurement, PAO2 is approximated to be equal to PAO2 ~ PIO2 − PaCO2/R, where PIO2 is partial pressure of inspired oxygen, PaCO2 is partial pressure of arterial carbon dioxide, and R is respiratory exchange ratio (generally assumed to be 0.8). Normally, AaDO2 is less than 10 mm Hg. AaDO2 tends to change with age and increasing fraction of inspired oxygen, and it may vary unpredictably with V/Q inequality.18–20
The easiest index to calculate is the arterial inspired oxygen concentration ratio (PaO2/FIO2). It has been used as the basis for the definition of acute lung injury/acute respiratory distress syndrome (ALI/ARDS). One of the disadvantages of the PaO2/FIO2 ratio is that it changes as a function of FIO2, raising the concern that it is not a precise enough measure to be used to define ALI/ARDS. That said, it remains an integral part of the ALI/ARDS definition for now.18,20
Respiratory Mechanics
The development of microprocessor-equipped ventilators has simplified the measurement of respiratory mechanics.21 Simple observation of the displays of an intubated patient who is undergoing ventilation with a microprocessor-equipped ventilator provides significant information about the respiratory mechanics of the patient. Failure of expiratory flow to fall to zero (on the flow-time trace) before the onset of inspiration is the hallmark of breath-stacking, also termed autoPEEP. Inability of the patient to trigger the ventilator can be seen as “bumps” during expiration.
The simple maneuver of a rapid airway occlusion using the ventilator buttons can provide further information. The end-expiratory occlusion gives a direct measure of autoPEEP once a plateau in the airway pressure is reached.21 The occlusion of the airway at end-inspiration for 5 seconds will measure the inspiratory plateau pressure, which approximates alveolar pressure. The risk of barotrauma is thought to increase at inspiratory plateau pressures greater than 35 cm H2O. The inspiratory plateau pressure also can be used to calculate the static compliance. Static compliance is the change in volume over the pressure change when flow has stopped in the airways and lung, measured as plateau pressure. Therefore the calculation of static compliance is

where Vt is tidal volume and PEEP is positive end-expiratory pressure. Dynamic compliance is the change in volume divided by the change in pressure when flow in the upper airway is zero but flow continues in the lung. It can be calculated at the bedside as

where PIP is peak inspiratory pressure. Dynamic and static compliance should be similar. Compliance may be markedly reduced in patients with ALI/ARDS because of the presence of pulmonary edema and alveolar flooding.
Studies that have used pressure-volume curves to set ventilator parameters and compared survival outcome have generated interest in the clinical application of pressure-volume curves. Three methods can be used to generate these curves.22 All methods require that the patient be deeply sedated and usually medically relaxed. This step is necessary to eliminate the influence of the respiratory muscles. The first method used was the super syringe method.22 In this method, the lungs are inflated in a stepwise manner using a calibrated syringe of a known volume (1.5 to 2 L) from the resting volume to a maximum of 40 to 50 cm H2O. The limitations of the method are that it takes a long time, the patient must be repeatedly disconnected from the ventilator, and the results may be influenced by oxygen consumption, changes in gas temperature, and humidity. Because of these limitations, its use is mainly limited to research.
The second method is the multiple occlusion technique.22 The ventilator system is checked to ensure the absence of leaks. Multiple end-inspiratory occlusions are used to achieve different inflating volumes, each starting at the same lung volume. After several seconds of pause, the static pressure values are obtained and the exhaled volume is read off the ventilator after the occlusion is released. The volumes are plotted against the static pressures to make the pressure-volume curve. This procedure is fairly complex and may not be well tolerated by the patient. In addition, the sequential inflations at different tidal breaths may modify the lung volume history and influence the shape of the curve.
The third method is the low-flow technique.22 This method is based on the concept that the rate of airway pressure change is inversely related to the compliance of the respiratory system during a passive lung inflation with constant inspiratory flow (15 L/min). This method is rapid and reproducible and does not require that the patient be disconnected from the ventilator.
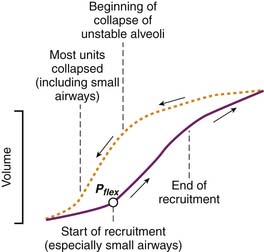
However generated, the pressure-volume curve is an S-shaped inspiratory curve of three segments (Figure 39-3). The lower inflection point is at the transition from the initial flat segment and the linear part of the curve. It is thought to reflect reopening of collapsed airways. The upper inflection point is at the transition of the linear part of the curve and the final portion of the curve. It is thought to reflect the start of overinflation. The portion of the curve between the upper and lower inflection points represents the target for ventilation in patients with ARDS to reduce the potential for ventilator-induced lung injury.21
Endoscopy
Bronchoscopy and laryngoscopy are sometimes used in the PICU to visually examine the airway. Direct endoscopy can be performed with a flexible or rigid bronchoscope.23,24 Flexible bronchoscopy offers the advantages of requiring little sedation and can be done through the endotracheal tube. Flexible bronchoscopy is used to evaluate the size, patency, and compression of the airway during respiration. It also is useful for evaluating the anatomy/structure of the airway and for removing or obtaining secretions from the lung. Rigid bronchoscopy continues to have a role for several reasons. Visualization of the posterior aspects of the larynx and cervical trachea is difficult using a flexible bronchoscope. Therefore better evaluation of vocal cord paralysis, laryngeoesophageal clefts, and H-type tracheoesophageal fistulas are obtained with a rigid bronchoscope. Removal of foreign bodies is performed more easily and safely with a rigid bronchoscope.
1. Jubran A. Pulse oximetry. Intensive Care Med. 2004;30:2017-2020.
2. Simpson H. Respiratory assessment. Br J Nurs. 2006;15:484-488.
3. Joshua A.M., Celemeyer D.S., Stockler M.R. Beauty is in the eye of the examiner: reaching agreement about physical signs and their value. Intern Med J. 2005;35:178-187.
4. Quasney M.W., Goodman D.M., Billow M., et al. Routine chest radiographs in pediatric intensive care units. Pediatrics. 2001;107:241-248.
5. Ryu J.H., Olson E.J., Midthun D.E., et al. Diagnostic approach to the patient with diffuse lung disease. Mayo Clin Proc. 2002;77:1221-1227.
6. Salyer J.W. Neonatal and pediatric pulse oximetry. Respir Care. 2003;48:386-396.
7. Miyasaka K. Pulse oximetry in the management of children in the PICU. Anesth Analg. 2002;94:S44-S46.
8. Cote C.J., Notterman D.A., Karl H.W., et al. Adverse sedation events in pediatrics: a critical incident analysis of contributing factors. Pediatrics. 2000;105:805-814.
9. Poets C.F., Urschitz M.S., Bohnhorst B. Pulse oximetry in the neonatal intensive care unit (NICU): detection of hyperoxemia and false alarm rates. Anesth Analg. 2002;94:S41-S46.
10. Goldman J.M., Petterson M.T., Kopotic R.J., et al. Masimo signal extraction pulse oximetry. J Clin Monit Comput. 2000;16:475-483.
11. Robertson F.A., Hoffman G.M. Clinical evaluation of the effects of signal integrity and saturation on data availability and accuracy of Masimo SE and Nellcor N-395 oximeters in children. Anesth Analg. 2004;98:617-622.
12. Elliott M., Tate R., Page K. Do clinicians know how to use pulse oximetry? A literature review and clinical implications. Aust Crit Care. 2006;19:139-144.
13. Nagler J., Krauss B. Capnography: a valuable tool for airway management. Emerg Med Clin North Am. 2008;26:881-897.
14. Bhende M.S., Allen W.D. Evaluation of a Capno-Flo resuscitator during transport of critically ill children. Pediatr Emerg Care. 2002;18:414-416.
15. Zwerneman K. End tidal carbon dioxide monitoring: a VITAL sign worth watching. Crit Care Nurs Clin North Am. 2006;18:217-225.
16. Lightdale J.R., Goldmann D.A., Feldman H.A., et al. Microstream capnography improves patient monitoring during moderate sedation: a randomized controlled trial. Pediatrics. 2006;117:e1170-e1178.
17. Coule L.W., Truemper E.J., Steinhart C.M., et al. Accuracy and utility of a continuous intra-arterial blood gas monitoring system in pediatric patients. Crit Care Med. 2001;29:420-426.
18. Karbing D.S., Kjaergaard S., Smith B.W., et al. Variation in the PaO2/FiO2 ratio with FiO2: mathematical and experimental description and clinical relevance. Crit Care. 2007;11:R118.
19. Bernard G.R., Artigas A., Brigham K.L., et al. The American-European consensus conference on ARDS: definitions, mechanism, relevant outcomes, and clinical trial coordination. Am J Respir Crit Care Med. 1994;149:818-824.
20. Del Sorbo L, Slutsky AS: Year in review 2007: critical care—respirology. Available at http://ccforum.com/content/12/5/231.
21. Bigatello L.M., Davignon K.R., Stelfox H.T. Respiratory mechanics and ventilator waveforms in the patient with acute lung injury. Respir Care. 2005;50:235-244.
22. Maggiore S.M., Brochard L. Pressure-volume curve in the critically ill. Curr Opin Crit Care. 2000;6:1-10.
23. Wood R.E. The emerging role of flexible bronchoscopy in pediatrics. Clin Chest Med. 2001;22:311-317.
24. Cohen S., Avital A., Godfrey S., et al. Suspected foreign body inhalation in children: what are the indications for bronchoscopy? J Pediatr. 2009;155:276-280.
[/level-membership-for-pediatrics-category][not-level-membership-for-pediatrics-category]
Chapter 39 Assessment and Monitoring of Respiratory Function
The majority of children admitted to the pediatric intensive care unit (PICU) present with cardiorespiratory disease or with an acute illness that may progress to involve the respiratory system, emphasizing the need for careful monitoring of respiratory parameters. Close respiratory examination and monitoring allow titration of therapies to minimize ventilator-induced injury, optimize patient-ventilator interaction, and aid in weaning from the ventilator.1
Physical Examination of the Respiratory System
Evaluation of breath sounds provides assessment of airflow through the tracheobronchial tree, the presence of fluid in or obstruction of the airways, and conditions outside the lung and pleural space. The child’s chest wall is thinner than that of the adult, which allows better access to breath sounds but impedes localization of the lesion because the breath sounds can be referred. Upper airway abnormalities may present with stridor or muffling of the voice. Bronchial breath sounds suggest consolidation, whereas wheezes result from narrowed airways. Crackles may be fine or coarse. They represent air bubbling through secretions and the reopening of closed airways. A friction rub may be heard when the inflamed surfaces of the pleura move against each other through the respiratory cycle. Breath sounds may be absent if there is a significant pleural effusion or complete lobar collapse resulting from a mucus plug or pneumothorax. Heart tones often are shifted away from the pneumothorax and toward the atelectasis because of complete airway obstruction. Assessment for pulsus paradoxus (i.e., exaggerated decrease in the pulse or systolic blood pressure with inspiration) should be made during the evaluation of severe airway obstruction or pulmonary embolus.
Although each assessment should include observation and a limited physical examination, it is recognized that interobserver repeatability of physical signs is poor and independent of the experience of the observer.2 The assessments of clubbing, wheezes, friction rub, and crackles are the most reliable and reproducible.2,3 The lack of accuracy of repeated physical examinations and the complexity of critically ill pediatric patients require adjunctive tests/assessments to monitor these patients.
Radiography
Portable chest x-ray films are the most common films taken in the PICU. The technical quality of the chest radiograph affects the interpretation; therefore, it is important to assess the film for adequacy of penetration, degree and symmetry of lung inflation, and degree of chest rotation. Chest x-ray films can be used to evaluate for cardiac, vascular, bone, and lung abnormalities, to assess for device placement (e.g., an endotracheal tube), and to determine the need for intervention.4 Lateral decubitus films help identify and quantify pleural effusions, pneumothorax, and the position of chest tubes/lines. Cross-table lateral films also may be used for these purposes but are harder to interpret. A chest computed tomography (CT) scan is used when details on the plain film are obscured by the superimposition of structures or an opaque hemithorax. A chest CT scan also can be used to guide drainage of fluid collections and assist in obtaining biopsy specimens. A high-resolution chest CT scan examines 1- to 1.5-mm slices at 10-mm intervals; therefore it can be used to illustrate lung parenchymal details better than a conventional CT scan, which examines 7- to 10-mm slices at 10-mm intervals.5 This detail can be helpful in distinguishing the pathologic process causing diffuse lung diseases that appear as diffuse lung shadowing on chest x-ray films. Chest ultrasound, ventilation/perfusion scanning, spiral CT, and magnetic resonance imaging may be useful adjutants depending on the disease process.
Noninvasive Respiratory Monitoring
Pulse Oximetry
Pulse oximetry is considered a significant technologic advance that has improved patient safety.1,6–9 Its ease of application and accuracy have resulted in widespread use. Pulse oximetry is commonly used to detect hypoxemia and to wean the oxygen concentration in patients undergoing mechanical ventilation.
Pulse oximetry is based on the principles that (1) the pulsatile absorbance detected is arterial blood and (2) oxyhemoglobin and reduced hemoglobin have different absorption spectra.6 Red (660-nm) and infrared (940-nm) wavelengths of light are used to determine the ratio of oxygenated to deoxygenated blood. Deoxygenated blood absorbs more red light, whereas oxygenated blood absorbs more infrared light. The two wavelengths are passed through an arterial bed, and the ratio of infrared and red light transmitted to the photodetector is determined. The ratio is calibrated against measurements of arterial oxygen saturations from human volunteers and their absorbance ratios.
[/not-level-membership-for-pediatrics-category]
