Chapter 10
Arterial Physiology
R. Eugene Zierler, David S. Sumner
Based on a chapter in the seventh edition by R. Eugene Zierler and David S. Sumner
Obstruction of the vessel lumen is the primary physiologic abnormality in arterial disease—whether it be the result of atherosclerosis, fibromuscular dysplasia, thrombi, emboli, dissection, trauma, or external compression. The consequences of arterial obstruction are related to the degree of narrowing and can be analyzed in terms of hemodynamic principles. Effects on the distal vascular bed depend not only on the severity of the local obstructive lesion but also on its location and the ability of the body to compensate by increasing cardiac work, dilating peripheral arterioles, and enlarging collateral pathways. Except for thrombus formation and occasional dissection, aneurysms seldom produce symptoms of obstruction. The tendency for aneurysms to rupture is determined by both intraluminal pressure and arterial diameter.
The first part of this chapter deals with the basic principles of blood flow and the hemodynamic alterations produced by arterial obstruction. Pressure and flow relationships in the normal and abnormal human circulation are then considered. Finally, some examples of how these principles can be applied to the diagnosis and treatment of arterial disease are discussed.
Arterial Hemodynamics
Basic Concepts
The flow of blood in the arterial circulation is governed by the fundamental laws of fluid dynamics. Knowledge of these principles permits better understanding of normal arterial circulation and the physiologic abnormalities associated with arterial obstruction.
Fluid Energy
Pressure is generally regarded as the force responsible for the motion of blood. Although pressure is the most obvious and most important of the forces involved, other forms of energy also play a role. Blood moves from one point to another in the vascular system in response to differences in total fluid energy (E), which consists of potential energy and kinetic energy. The potential energy component can be broken down into intravascular pressure (P) and gravitational potential energy. P represents the dynamic pressure produced by contraction of the heart, hydrostatic pressure, and the static filling pressure of the resting circulation.1 Hydrostatic pressure is proportional to the weight of the blood and is represented by the following equation:
 (10.1)
where ρ is the density of blood (about 1.056 g/cm2), g is acceleration secondary to gravity (980 cm/sec2), and h is the distance in centimeters above a given reference point. In the human body, this reference point is usually assumed to be at the level of the right atrium. Hydrostatic pressure may be large in relation to dynamic pressure. For example, at ankle level in a standing man 5 feet 8 inches tall, this pressure is about 89 mm Hg. In contrast, static filling pressure is low, usually about 7 mm Hg.2 This pressure is related to the elasticity of the vascular walls and the volume of blood contained within them.
Gravitational potential energy (+ρgh) is calculated the same way as hydrostatic pressure but has an opposite sign. It represents the ability of a volume of blood to do work because of its elevation above a given reference point. In most circumstances, gravitational potential energy and hydrostatic pressure cancel each other out. Finally, kinetic energy represents the ability of blood to do work because of its motion ( ).
).
Putting these values together allows an expression for total fluid energy per unit volume of blood (E) to be obtained:
 (10.2)
where E is in ergs per cubic centimeter and v refers to the velocity (cm/sec) of a particle of blood moving steadily in a straight line.
Bernoulli’s Principle
When fluid flows steadily (without accelerating or decelerating) from one point in a system to another, its total energy content along any given streamline remains constant, provided that there are no frictional losses:
 (10.3)
The previous equation, the one-dimensional Bernoulli equation, is derivable from Newton’s laws of motion and is a fundamental formula in fluid mechanics.3
Bernoulli’s principle establishes a relationship among kinetic energy, gravitational potential energy, and intravascular pressure in a frictionless fluid system. Several apparent paradoxes of fluid flow are explained by this equation. For example, in Figure 10-1A, fluid with the density of blood enters the top of an inclined tube at a pressure of 100 mm Hg and flows out at a pressure of 178 mm Hg. Thus, fluid moves against a pressure gradient from a point of low pressure to a point where its pressure is higher. However, the total fluid energy remains constant because the gravitational potential energy decreases by an amount exactly equal to the increase in pressure. This situation is analogous to that in the arteries of a standing person, in whom blood pressure at ankle level is greater than blood pressure in the aortic arch.
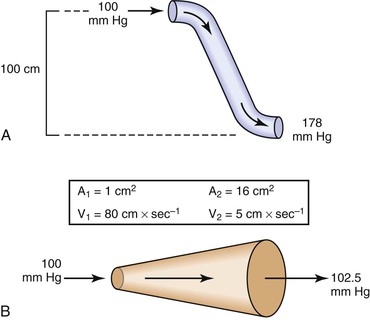
Figure 10-1 A, Effect of vertical height on pressure in a frictionless fluid flowing downhill. B, Effect of increasing cross-sectional area on pressure in a frictionless fluid system. A1 and A2, areas at the entrance and exit of the system, respectively; V1 and V2, velocities at the entrance and exit of the system, respectively.
In Figure 10-1B, fluid flows through a horizontal tube while the cross-sectional area increases 16 times. This results in a proportional decrease in fluid velocity. Again, the fluid moves against a pressure gradient, the pressure at the exit of the tube being 2.5 mm Hg greater than the pressure at the entrance to the tube. The total fluid energy remains the same because of the decrease in kinetic energy. This phenomenon is seldom observed in the human circulation because associated energy losses effectively mask the slight rise in pressure.
Intravascular pressure measurements made with catheters are subject to error related to the effect of kinetic energy. If the catheter faces the oncoming blood end-on, the pressure recorded is too high by a factor of  . On the other hand, if the catheter faces downstream, the recorded pressure is too low by the same factor. At a velocity of 50 cm/sec, these errors would equal about 1.0 mm Hg and would be inconsequential in a high-pressure system such as the aorta. Nevertheless, they could be of importance in low-pressure, high-flow systems such as the vena cava and pulmonary artery.4,5
Poiseuille’s Law
The conditions required to fulfill the rigid specifications of the Bernoulli equation are theoretical and never achieved in the human circulation or in any other real fluid system. Mechanical energy is always lost (converted to heat) in the movement of blood or fluid from one point to another. Energy loss in the peripheral circulation is related primarily to the viscosity of blood and its inertia. In fluids, viscosity can be defined as the friction between contiguous layers of fluid. This friction is due to strong intermolecular attractions between fluid layers. The equation known as Poiseuille’s law describes the viscous energy losses occurring in an idealized situation, as follows:
 (10.4)
where P1 − P2 represents the drop in potential energy (dyn/cm2) between two points separated by the distance L (cm), Q is the volume flow (cm3/sec), and  is the mean flow velocity (cm/sec) across a tube with an inside radius of r (cm). The coefficient of viscosity, η, is expressed in poise (dyn/sec/cm2).
Under the conditions specified by Poiseuille’s law, the velocities of each concentric layer of fluid describe a parabolic profile, with velocity being highest in the center of the stream and becoming progressively lower toward the vessel wall. The layer of fluid or blood in contact with the wall is stationary. The ratio of the change in velocity (Δv) to the change in the radius (Δr) between each cylindrical layer is known as the shear rate (D), the force required to “shear” the fluid is known as shear stress (τ), and the coefficient of viscosity (η) is the ratio of shear stress to shear rate:
 (10.5)
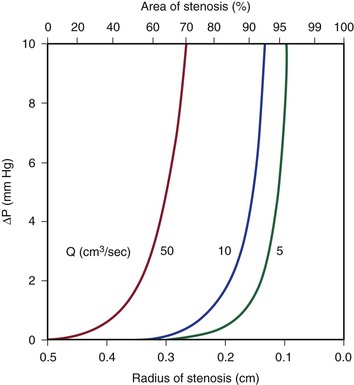
Because energy losses are inversely proportional to the fourth power of the radius (Eq. 10.4), graphs based on Poiseuille’s law are sharply curved. Figure 10-2 shows that as the diameter of a vessel or conduit is reduced, there is little effect on the pressure gradient until a certain degree of narrowing is reached; beyond that point, further reductions in diameter cause the pressure gradient to rise rapidly. Although increasing the flow rate shifts the curves to the left and linearly increases the pressure gradient at any given radius, these effects are much less marked than those caused by changes in radius.
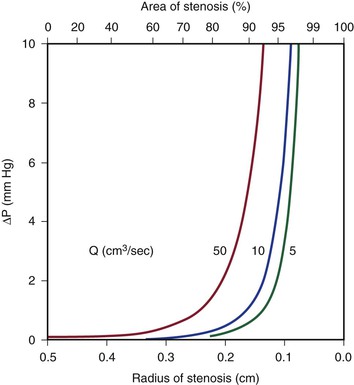
Figure 10-2 Curves derived from Poiseuille’s law (Eq. 10.4). The stenotic segment is assumed to be 1.0 cm long. Viscosity is 0.035 poise. ΔP, Pressure gradient.
Poiseuille’s law applies only to steady (nonpulsatile), laminar flow in a straight cylindrical tube with rigid walls. The tube must also be long enough to allow a parabolic flow profile to develop. The “entrance length” required to develop a parabolic profile depends on the radius of the tube and the Reynolds number (Re), which is described later in this chapter. Although velocity profiles in smaller arteries (e.g., radial, mesenteric) may be essentially parabolic, in larger arteries (e.g., iliac, common carotid), the entrance length approaches the length of the artery, and flow profiles remain blunt. The flow profile in the human abdominal aorta is blunted.6,7 Entrance effects are only one of many factors modulating the velocity profile. At branch points or in regions where the vessel curves, the momentum of blood near one wall exceeds that on the other side. As a result, velocity profiles are skewed toward one wall, and complicated helical flow patterns develop.8,9 Thus, the strict conditions required by Poiseuille’s law are seldom, if ever, present in the human circulation. In addition, energy losses during fluid flow are almost never totally viscous, and in many situations viscous losses are less significant than energy losses related to inertia.
Inertia
Inertial energy losses depend on the mass or density of the blood (ρ) and on the square of the flow velocity (v):
 (10.6)
Because ρ is a constant, the quantity that changes in this equation is v. Changes in velocity occur when blood is accelerated or decelerated in pulsatile flow and when blood passes from a large-lumen vessel (where the velocity is low) to a small-lumen vessel (where the velocity is high), or vice versa. In addition, v is a vector quantity, so any change in direction of flow also represents an acceleration.
Flow changes direction whenever the blood vessel forms a curve and at all bifurcations and branch points. There is also a change in direction when the blood vessel gradually narrows or in pathologic situations characterized by sudden narrowing and expansion of the flow stream, as in atherosclerotic stenosis and post-stenotic dilatation. Moreover, as a result of the expansile nature of the arterial wall, velocity vectors must be directed outward during the systolic portion of the pressure wave and inward during the diastolic portion.
According to the equation of continuity (conservation of mass), the product of flow velocity and cross-sectional area (A) is the same at any point along a tube, provided that there are no intervening branches:
 (10.7)
Because kinetic energy losses depend on the square of the velocity (Eq. 10.6) and because the velocity in a stenotic segment is inversely proportional to the square of its radius, kinetic energy losses—like those attributable to viscosity—are inversely proportional to the fourth power of the radius (see Eq. 10.4). As illustrated in Figure 10-3, the resulting curves display little sensitivity to reduction in radius until a certain point is reached, beyond which energy losses increase rapidly. Increasing the velocity of flow has a more marked effect on kinetic energy losses than it does on viscous losses (compare Figures 10-2 and 10-3). This conclusion follows from the fact that the velocity term is squared in Equation 10.6 but enters Equation 10.4 only in the first power.
Turbulence
Turbulence is a flow pattern characterized by random velocity vectors that result in an overall reduction in total fluid energy. The point at which flow changes from laminar to turbulent is best defined in terms of a dimensionless quantity known as the Reynolds number, Re. Re is proportional to the ratio of inertial forces to viscous forces acting on the fluid, as follows:
 (10.8)
where d is the diameter of the conduit, ρ is the density of blood,  is mean flow velocity, and η is viscosity. When Re exceeds 2000, local disturbances in the laminar flow pattern result in fully developed turbulence. With Re less than 2000, local disturbances are damped out by the viscous forces. Because Re values are well below 2000 in most peripheral arteries, turbulence is unlikely to occur under normal circumstances. However, turbulence does appear to develop in the ascending aorta during the peak systolic ejection phase and may persist during deceleration.10 These turbulent flashes are short lived, but the pattern of blood flow in a large portion of the circulation may be characterized as “disturbed.”11,12 Energy losses calculated with the use of turbulent friction factors may more closely approximate experimental results than losses calculated with Poiseuille’s law.13
Resistance
The concept of hemodynamic resistance is essential for understanding the physiology of arterial occlusive disease. When hemodynamic resistance is defined simply as the ratio of the energy drop between two points along a blood vessel (E1 − E2) to the mean blood flow in the vessel (Q), the equation for hemodynamic resistance (R) is analogous to Ohm’s law in electrical circuits:
 (10.9)
It is often convenient to drop the kinetic energy term ( ) in Equation 10.2 because it seldom contributes appreciably to total energy. In addition, calculations are simplified if the assumption can be made that the subject is supine. This assumption permits the gravitational terms (ρgh) to cancel out. Hence, resistance can be approximated by the ratio of the drop in pressure (P1 − P2) to flow (Eq. 10.9).
Unlike electrical resistance, hemodynamic resistance does not remain constant over a wide range of flow rates. The minimal possible resistance is given by Poiseuille’s law and is related to viscous effects:
 (10.10)
Because of additional energy losses related to inertial effects (acceleration, disturbed flow, and turbulence), all of which are a function of  , the resistance of a given vascular segment tends to increase as flow velocity increases, provided that there is no concomitant change in vascular diameter (Figs. 10-4 and 10-5). The dimensions of hemodynamic resistance are dyn × cm−5 × sec. However, it is usually more convenient to use the peripheral resistance unit (PRU), which is millimeters of mercury per milliliter per minute. Thus, 1 PRU is approximately equal to 8 × 10⁴ dyn × cm−5 × sec.
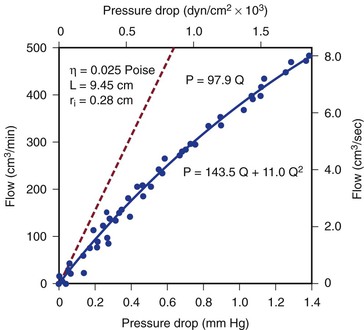
Figure 10-4 Pressure drop across a 9.45-cm length (L) of canine femoral artery at varying flow rates. Differential pressure was measured with a specially designed transducer (D. E. Hokanson, Bellevue, Washington) and flow with an electromagnetic flowmeter. Flow rate was varied by constriction of a distally located arteriovenous fistula. The line that fits the experimental data best (solid line) has both a linear term and a squared term, corresponding to Poiseuille’s law plus kinetic energy losses. The pressure-flow curve predicted from Poiseuille’s law (dashed line) depicts much less energy loss than is actually the case. η, Viscosity; P, pressure; ri, inside radius; Q, flow.
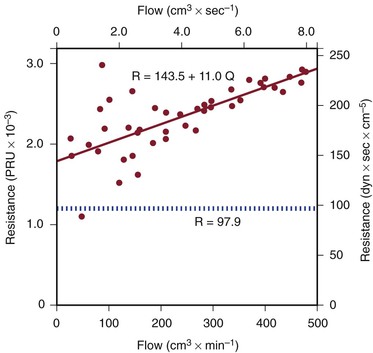
Figure 10-5 Resistance derived from the pressure-flow curve in Figure 10-4. The constant resistance predicted by Poiseuille’s law is depicted by the dotted line. Note that resistance (R) rises with increasing flow. PRU, Peripheral resistance unit.
Pulsatile Flow
Applying any of these equations to pulsatile blood flow is very difficult. For example, during steady flow, kinetic energy can be estimated from the square of the space-averaged velocity of blood flowing past a given point (see Eq. 10.6). During pulsatile flow, a more complicated expression must be used that integrates the instantaneous product of mass flux and the square of the velocity. This method sometimes predicts kinetic energies that are 10 times as great as would be suspected on the basis of the average velocity of blood flow.14,15
In addition, the shape of the velocity profile must be known before the spatially averaged velocity across the lumen of a blood vessel can be used to estimate loss of kinetic energy (Fig. 10-6). When the profile is nearly flat, as it is with turbulent flow or when the site of flow measurement is within the entrance length of a blood vessel, k in Equation 10.6 will be 1.06.3 When the profile is parabolic, k becomes 2.0. With pulsatile flow, a parabolic profile is never really attained (Fig. 10-7).16 As mentioned previously, in larger blood vessels such as the aorta, the velocity profile may be quite flat or blunt and is often skewed. In smaller arteries, a parabolic profile may be approached, especially during the peak forward phase of the flow pulse.
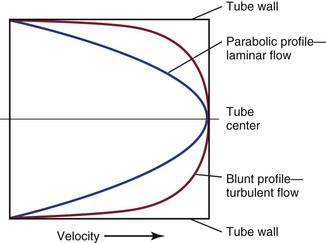
Figure 10-6 Velocity profiles of steady laminar flow and turbulent flow. Velocity is zero at the tube wall and reaches its peak value in the center. A blunt profile is also typical of flow within the entrance length of a vessel.
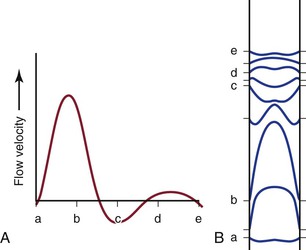
Figure 10-7 Various phases of a typical femoral arterial flow pulse (A) and their velocity profiles (B). Lower case letters indicate corresponding points in the pulse cycle. In all profiles, the velocity at the wall is zero. At point b, forward flow is nearly maximal and the profile is almost parabolic. At the next point, flow near the wall is reversed but that in the center continues forward. Several profiles, both forward and reverse, are blunt. (Adapted from McDonald DA: Blood flow in arteries, ed 2, Baltimore, 1974, Williams & Wilkins.)
All these complexities merely add to the energy losses that occur in the circulation. Thus, for a given level of blood flow, the pressure (energy) drop between any two points in the arterial tree may be several times that predicted by Poiseuille’s law (see Eq. 10.4).17–19 Furthermore, the relationship between pressure gradient and flow is not linear but defines a curve that is concave to the pressure axis (see Fig. 10-4). These nonlinearities are all functions of inertial losses and represent the effect of the v2 term. Thus, Poiseuille’s law cannot be used to predict pressure-flow relationships in the arterial tree, but it can be used to define the minimal energy losses that can be expected under any given flow situation.
Arterial Stenosis
Energy Losses Associated with Stenoses
Most of the abnormal energy losses in the arterial system result from stenosis or obstruction of the vascular lumen. In accordance with Poiseuille’s law (see Eqs. 10.4 and 10.10), the viscous energy losses within a stenotic segment are inversely proportional to the fourth power of the radius at the stenosis and are directly proportional to the length of the stenosis (see Fig. 10-2). Therefore, the radius of a stenosis is much more significant than its length.20–23 In addition, inertial energy losses are encountered at both the entrance to and the exit from a stenosis.14,23–25 The magnitude of these losses varies greatly with the shape of the entrance and exit, being much less for gradual tapering of the lumen than for an abrupt change. Moreover, the energy losses associated with asymmetrical stenoses exceed those associated with axisymmetrical stenoses, even when the lumen is compromised to the same extent.26 Although energy losses at the entrance can be appreciable, they are usually greater at the exit, where much of the excess kinetic energy resulting from the increased fluid velocity within the stenosis is dissipated in a turbulent jet. Figure 10-8 illustrates these concepts and emphasizes the relatively small contribution of viscous losses to the total decrease in fluid energy produced by the stenosis. Even if the obstruction were very short or diaphragm-like (L in Eq. 10.4 approaching zero), the energy losses would still be 85% of those with a 1-cm-long stenosis; in other words, most of the energy losses in this situation can be attributed to inertial effects.
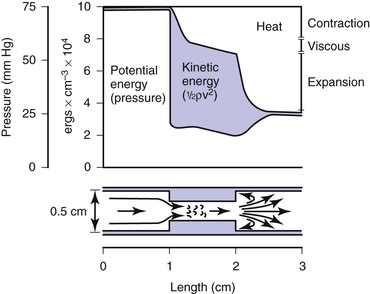
Figure 10-8 Diagram illustrating energy losses experienced by blood passing through a stenosis 1 cm long. Flow is assumed to be unidirectional and steady. Very little of the total energy loss is attributable to “viscous” losses. Thus, applications of Poiseuille’s law greatly underestimate the drop in pressure across an arterial stenosis.
Critical Stenosis
How severe does a stenosis have to be to produce a measurable pressure gradient or a decrease in blood flow? This is an important question for clinicians who attempt to assess the severity of an arterial obstruction from its angiographic appearance. Experimentally, appreciable changes in pressure and flow do not occur until the cross-sectional area of a vessel has been reduced by more than 75%.27,28 Assuming that the obstructing lesion is symmetrical, this reduction in cross-sectional area corresponds to at least a 50% reduction in diameter. The degree of narrowing at which pressure and flow begin to be affected has been called the “critical stenosis.”
Energy losses associated with arterial lesions are inversely proportional to the fourth power of the radius of the stenosis (see Eq. 10.4) and to the fourth power of the ratio of the radius of the stenosis to that of the nonstenotic segment. Because these are exponential functions, graphs relating energy losses across a stenosis to the percentage reduction in cross-sectional area are sharply curved, thus providing theoretical support for the concept of critical stenosis (Fig. 10-9).14,20,23,25,29
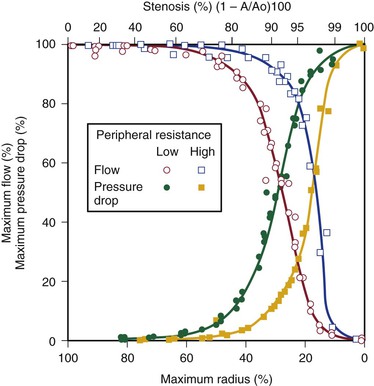
Figure 10-9 Relationship of pressure and flow to the degree of stenosis in a canine femoral artery. When peripheral resistance is high, the curves are shifted to the right. The percentage change in flow through the stenosis is essentially a mirror image of the percentage maximal drop in pressure across the stenosis.
Energy losses across stenotic segments also depend on the velocity of blood flow (see Eq. 10.4 and Figs. 10-4 and 10-5). Significant drops in pressure and flow occur with less severe narrowing in high-flow (low-resistance) systems than in low-flow systems.27,28,30,31 Consequently, critical stenosis varies with the resistance of the runoff bed. When peripheral resistance is low, as in the carotid, renal, and coronary systems, critical stenosis may be reached with less narrowing of the lumen than in higher-resistance arterial systems, such as the resting lower extremity. Even in the leg, lowering peripheral resistance sufficiently with exercise or reactive hyperemia may cause a stenosis that is noncritical at rest to become critical.32–34 This process explains the common clinical observation that an iliac artery lesion may severely restrict the patient during exercise even though it causes no symptoms at rest and may not appear particularly significant on arteriography.35,36
Precise attempts to relate pressure and flow restriction to percentage stenosis have been frustrated by the irregular geometry of arterial lesions and by the nonlinearities introduced by pulsatile blood flow. For practical purposes, any lesion that potentially decreases the arterial lumen by about 75% cross-sectional area or 50% diameter must be suspect, and its hemodynamic significance must be determined by objective physiologic tests.
Length of Stenosis and Stenoses in Series
When a series of stenotic lesions are found in a single unbranched arterial segment, the question arises whether repair of one of the lesions will improve blood flow significantly. This issue is particularly pertinent when one of the lesions is in a relatively inaccessible location, such as stenosis at the origin of the internal carotid artery combined with a similar stenosis in the ipsilateral carotid siphon. The length of a stenosis primarily affects energy losses related to viscosity and enters Poiseuille’s equation (see Eq. 10.4) only in the first power, whereas the radius of the stenosis is raised to the fourth power. Therefore, the effect of a change in length on viscous energy losses is far less than the effect of a change in radius. For example, doubling the length of a stenosis would merely double the viscous energy losses, but reducing the radius of the lumen by half would increase the losses by a factor of 16. In addition, inertial effects at the exit are independent of the length of the stenosis and are related to the fourth power of the ratio of the diameters of the nonstenosed and stenosed portions of the vessel. On the basis of these considerations, the length of a stenosis is far less important than its diameter.20,21,23,37,38
Because entrance and exit effects contribute a large portion of the resistance offered by a stenosis, doubling the length of a lesion without changing its diameter would not double its resistance (see Fig. 10-8). In contrast, the total resistance of two separate lesions of equal length and diameter is approximately double that of the individual lesions because entrance and exit effects occur at each of the stenoses.39,40 Consequently, separate stenoses of equal diameter are of more significance than a single stenosis of the same diameter whose length equals the sum of the lengths of the two shorter lesions.
When two stenoses of unequal diameter are in series, the tighter of the two has the greater effect on resistance. Total resistance is not affected by the sequence of the stenoses; it makes no difference whether the more severe lesion is proximal or distal.38 The resistance of stenoses in series is roughly additive, although the cumulative effect may be somewhat less than would be anticipated on the basis of the sum of the individual resistances. Therefore, multiple noncritical stenoses may act as a single critical stenosis.39,40 When two stenotic lesions are of similar caliber, removal of one provides only a modest improvement in blood flow. If the stenoses are of unequal caliber, removal of the less severe lesion results in little increase in blood flow, whereas removal of the more severe stenosis may provide significant improvement.
These principles apply only to unbranched arteries; they do not apply to the situation in which the proximal lesion is in an artery feeding a collateral bed that parallels the distal lesion. Thus, angioplasty and stenting of a stenotic iliac artery is usually beneficial even when the superficial femoral artery is completely occluded. In this case, the profunda femoris artery carries most of the blood to the lower part of the leg, and removal of the proximal iliac lesion will improve perfusion pressure to the collateral bed supplied by the profunda femoris artery.36,41–44
Arterial Flow Patterns in the Human Circulation
Normal Arteries
Pressure and Flow
Under resting conditions, blood flow to the normal human leg averages about 300 to 400 mL/min.45–48 Calf blood flow is in the range of 1.5 to 6.5 mL per gram of calf per minute, with an average value of about 3.5 mL/g/min.49,50 Blood flow to the gastrocnemius muscle is usually about 2.0 mL/g/min.51 This rate of flow is more than adequate to supply all the nutritional needs of the resting limb. When blood flow is restored to a normal limb that has been rendered ischemic for 5 minutes by means of a proximally placed pneumatic tourniquet, the peripheral arteriolar bed becomes vasodilated. The resulting “reactive hyperemia” reaches peak values of 30 to 40 mL/g/min and then rapidly subsides to resting levels within a minute or two.31,50,52 Moderate exercise normally increases total leg blood flow by 5 to 10 times.45,53,54 Muscle blood flow rises to 30 ± 14 mL/g/min and reaches 70 mL/g/min during strenuous exercise (Fig. 10-10).53 On cessation of exercise, blood flow decreases rapidly, often reaching pre-exercise levels within 1 to 5 minutes.
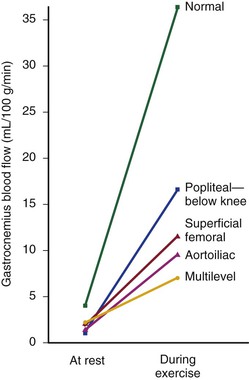
Figure 10-10 Mean blood flow at rest and after exercise in normal subjects and in patients with arteriosclerosis obliterans. The locations of occlusion are indicated. Blood flow was measured in the gastrocnemius muscle via the xenon-133 clearance technique. (Data from Wolf EA, et al: Correlation between nutritive blood flow and pressure in limbs of patients with intermittent claudication. Surg Forum 23:238, 1972.)
The mean drop in blood pressure across normal arteries from the heart to the ankle is only a few millimeters of mercury.4 As the pressure wave travels distally, systolic pressure increases, diastolic pressure decreases, and the pulse pressure widens (Fig. 10-11).55 These pressure changes are due to reflection of waves from the high-resistance peripheral arteriolar bed. Under resting conditions, ankle systolic pressure exceeds brachial systolic pressure in normal individuals by about 10% (Fig. 10-12).56 This explains why the normal resting ankle-brachial pressure index is greater than 1.0 (see Chapter 15). In normal extremities, moderate exercise produces little or no drop in systolic pressure at ankle level. With very strenuous exercise, the pressure may fall a few millimeters of mercury, but it rapidly recovers within several minutes.57 These findings contrast sharply with the extreme drops in ankle pressure that follow exercise in limbs with occlusive arterial disease, as illustrated in Figure 10-12.
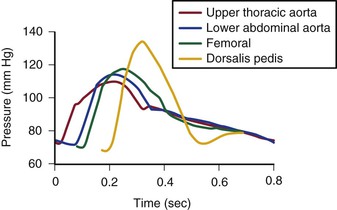
Figure 10-11 Pressure pulse contours in a normal subject. (From Strandness DE, Jr, et al: Hemodynamics for surgeons, New York, 1975, Grune & Stratton; redrawn from Remington JW, Wood EH: Formation of peripheral pulse contour in man. J Appl Physiol 9:433, 1956.)
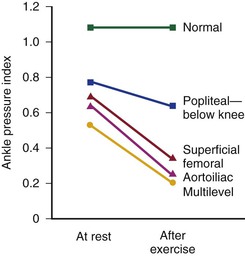
Figure 10-12 Mean ankle pressure indices (ankle systolic blood pressure/brachial systolic blood pressure) at rest and after exercise in normal subjects and in patients with arteriosclerosis obliterans. The locations of occlusion are indicated. (Data from Wolf EA, Jr, et al: Correlation between nutritive blood flow and pressure in limbs of patients with intermittent claudication. Surg Forum 23:238, 1972.)
Control of Peripheral Vascular Resistance
Blood vessels in the skin are well supplied with sympathetic vasoconstrictor fibers, especially in the terminal portions such as the fingers, hands, and feet. Therefore, most reflex vasodilatation of cutaneous vessels results from withdrawal of sympathetic impulses.58 In contrast, blood vessels within skeletal muscles are innervated by both vasodilator and vasoconstrictor fibers. The former respond to emotional stress and the latter to postural changes.58 However, these actions are easily overcome by the powerful vasodilator effect of locally produced metabolites that accumulate during exercise or ischemia.59,60 Exercise is perhaps the single best vasodilator of resistance vessels within skeletal muscle.45,53,54 Arteriolar constriction also occurs in response to dependency (the venoarterial reflex).61 By restricting arterial inflow, this reflex serves to limit the increase in venous blood volume that accompanies elevated hydrostatic pressure.
“Autoregulation” is a term used to describe the ability of most vascular beds to maintain a constant level of blood flow over a wide range of perfusion pressures.62–65 It occurs when the resistance vessels constrict in response to an increase in blood pressure and dilate in response to a decrease. The mechanism of autoregulation appears to involve a myogenic response to stretch that is modified by local chemical factors and sympathetic control.66 Autoregulation can compensate for a drop in perfusion pressure only until it falls below a critical level (e.g., about 20 to 30 mm Hg for skeletal muscle and about 50 to 60 mm Hg for the brain). With pressures below this level, normal blood flow is no longer maintained, and flow responds passively to changes in perfusion pressure (Fig. 10-13).
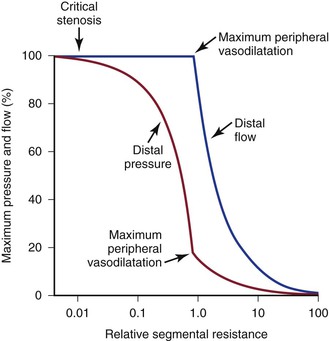
Figure 10-13 Although blood pressure distal to a critical stenosis falls progressively with growing severity of the stenosis, autoregulation maintains normal blood flow to the tissues until maximum peripheral vasodilatation is reached. Beyond this point, pressure and flow are linearly related; increasing stenosis results in marked decreases in both pressure and flow, and the tissues become ischemic. (Compare with Figure 10-9.) (Redrawn from Sumner DS: Correlation of lesion configuration with functional significance. In Bond MG, et al, editors: Clinical diagnosis of atherosclerosis: quantitative methods of evaluation, New York, 1983, Springer-Verlag.)
Flow Separation and Shear
When fluid flows through a tube, the portion of fluid in contact with the tube wall is referred to as the boundary layer. This layer is subject to both frictional interactions with the tube wall and viscous forces generated by the more rapidly moving fluid toward the center of the tube. When the geometry of the tube changes abruptly, such as at points of curvature and branching or by alteration of lumen diameter, small pressure gradients are created that cause the boundary layer to stop or reverse direction. This situation results in a complex, localized flow pattern known as flow separation.67 Areas of flow separation have been observed in models of arterial anastomoses and bifurcations.68 In the carotid artery bifurcation shown in Figure 10-14, the central rapid flow stream of the common carotid artery is compressed along the inner wall of the carotid bulb, and a region of high shear stress is produced. An area of flow separation has formed along the outer wall of the carotid bulb that includes helical flow patterns and flow reversal. The region of the carotid bulb adjacent to the separation zone is subject to relatively low shear stress. Distal to the bulb, in the internal carotid artery, flow reattachment occurs and a more laminar flow pattern is present.
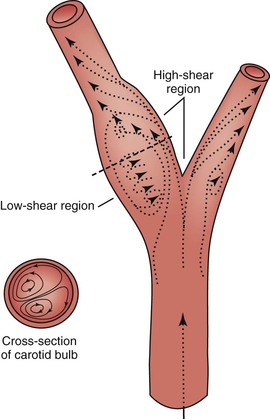
Figure 10-14 Carotid artery bifurcation showing an area of flow separation adjacent to the outer wall of the bulb. Rapid flow is associated with high shear stress, whereas the slower flow of the separation zone produces a region of low shear. Arrows indicate direction of flow. (Redrawn from Zarins CK, et al: Atherosclerotic plaque distribution and flow velocity profiles in the carotid bifurcation. In Bergan JJ, Yao JST, editors: Cerebrovascular insufficiency, New York, 1983, Grune & Stratton.)
The complex flow patterns described in models of the carotid bifurcation have also been documented in humans by pulsed Doppler and color-flow studies.69,70 As shown in Figure 10-15A, the Doppler spectral waveform obtained near the inner wall of the carotid bulb is typical of the forward flow pattern found in the internal carotid artery. However, sampling of flow along the outer wall of the bulb demonstrates lower velocities with periods of both forward and reverse flow. This area of flow separation can also be identified by color-flow Doppler imaging (Fig. 10-15B). These spectral characteristics are consistent with the presence of flow separation and are considered a normal finding, particularly in young individuals.69,70
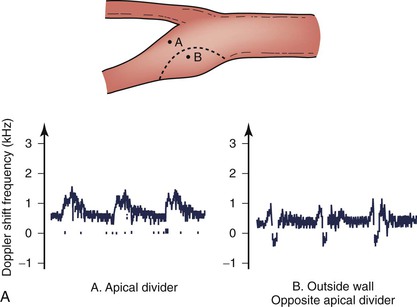
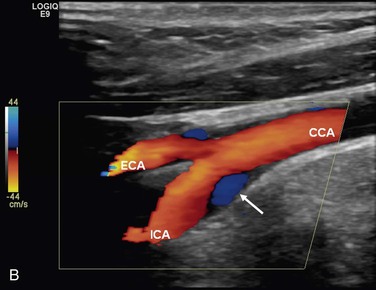
Figure 10-15 A, Flow separation in a normal carotid bulb shown by pulsed Doppler spectral analysis. The flow pattern near the apical divider (point A) is forward throughout the cardiac cycle, but near the opposite wall (point B), the spectrum contains both forward (positive) and reverse (negative) components. The latter pattern indicates an area of flow separation. B, Color-flow image of a normal carotid bifurcation showing an area of flow separation (white arrow) adjacent to the outer wall of the proximal internal carotid artery (ICA). The area of flow separation appears blue owing to the presence of reverse flow. CCA, Common carotid artery; ECA, external carotid artery.
The clinical importance of boundary layer separation is that these localized flow disturbances may contribute to the formation of atherosclerotic plaque.71 Examination of human carotid bifurcations, both at autopsy and during surgery, has shown that intimal thickening and atherosclerosis tend to occur along the outer wall of the carotid bulb whereas the inner wall is relatively spared. These findings suggest that atherosclerotic lesions form adjacent to areas of flow separation and low shear stress. Whether flow separation represents a true causative factor or simply promotes the development of previously existing lesions is not known.
Normal Flow and Pressure Waves
A portion of the left ventricular stroke volume is stored in the compliant aorta during systole and is propelled distally by elastic recoil during diastole. When this surge of blood encounters the high resistance imposed by the arterioles, part is transmitted into the capillaries and part is reflected back up the arterial tree (Fig. 10-16; also see Fig. 10-7).21,24,72 The magnitude of the reflected wave relative to that of the incident wave is determined by the peripheral resistance, which is greatest when the recipient vascular bed is constricted and least when the bed is dilated.73
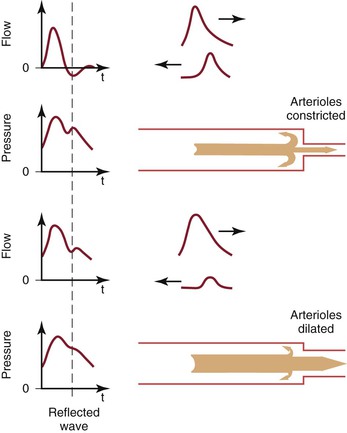
Figure 10-16 Effect of reflected waves on the contour of arterial flow and pressure pulses. Reflected waves subtract from forward flow waves but add to pressure waves. Reflection is accentuated by vasoconstriction and attenuated by vasodilatation. t, Time. (Redrawn from Sumner DS: Hemodynamics of abnormal blood flow. In Veith FJ, et al, editors: Vascular surgery: principles and practice, ed 2, New York, 1994, McGraw-Hill.)
As the reflected wave moves up the artery, it subtracts from the forward wave. In normal limbs with high arteriolar tone, this effect produces a short period of reversed flow in early diastole. As the reflected wave moves proximally beyond the point of observation, a smaller forward flow wave again appears in late diastole. When the arterioles are dilated (as in exercise) or when the baseline resistance of the recipient bed is low (as in the cerebral or renal circulation), the amplitude of the reflected wave is relatively small and shows up only as a transient downward deflection in the diastolic portion of the flow pulse. In this situation, flow remains antegrade throughout the cardiac cycle and there is no reverse flow component.
Although pressure is also reflected at the periphery, the reflected pressure wave adds to rather than subtracts from the forward wave and produces a characteristic upward deflection on the downslope of the pressure pulse (see Fig. 10-16). This additive nature of the reflected pressure wave accounts for the amplification of systolic pressure and the decrease in diastolic pressure observed as blood moves from the aorta to the peripheral arteries (see Fig. 10-11).
Palpable Pulses
Motion of the arterial wall is responsible for the palpable pulses that are so important in the physical examination of a patient in whom arterial disease is suspected. However, a 7-mm femoral artery in a young subject would expand only 0.2 mm under the influence of 50 mm Hg pulse pressure, and the stiffer arteries in an older individual would expand even less. It seems doubtful that the finger could reliably detect this degree of motion, so why are pulses ordinarily so easily felt? When the finger is applied to the skin overlying an artery, the artery is compressed, changing its normally circular cross-section into an ellipse. It takes much less energy to bend the wall of an elliptically shaped vessel than it does to stretch the wall of a circular vessel.74 Therefore, when the artery is partially compressed, its expansion in the direction of the compression is greatly augmented. The clinical value of pulse palpation is based on the assumption that the strength of the pulse is directly related to the pulse pressure, which should be decreased distal to an obstruction. However, stiff, calcified vessels may display little or no palpable pulse even though there is no decrease in pulse pressure. Although pulse palpation can be a valuable tool for the initial evaluation of a patient with suspected arterial disease, noninvasive tests have repeatedly demonstrated its fallibility.
Arterial Obstruction
Collateral Circulation
An arterial stenosis does not exist in isolation but rather is part of a complex hemodynamic circuit.24,75 As shown in Figure 10-17, this circuit includes the diseased main artery, a parallel system of collateral arteries, and the peripheral runoff bed. There are two major mechanisms that compensate for the increased hemodynamic resistance imposed by a highly stenotic or totally occluded artery: development of collaterals and dilatation of resistance vessels in the peripheral runoff bed.
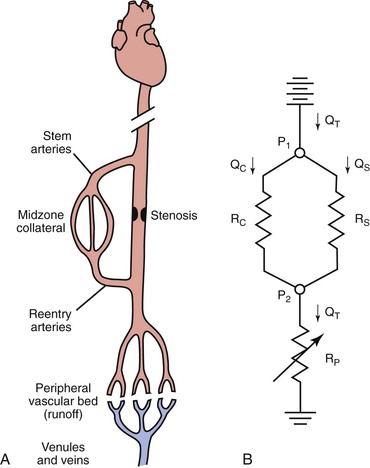
Figure 10-17 A, The main components of an arterial circuit containing a stenotic major artery. B, An electric analogue of this circuit. The battery at the top represents the potential energy source (e.g., the heart); ground potential, at the bottom, indicates the central veins. P1, pressure proximal to the stenosis; P2, pressure distal to the stenosis; QC, collateral flow; QS, flow through the stenotic artery; QT, total flow; RC, collateral resistance; RP, resistance in peripheral “runoff” bed; RS, resistance in stenotic artery. RC and RS are relatively “fixed,” whereas RP is “variable.”
Anatomically as well as functionally, the collateral circulation can be divided into (1) stem arteries, (2) midzone collaterals, and (3) reentry arteries (see Fig. 10-17).76 These vessels are preexisting pathways that enlarge when a stenosis or occlusion develops in the parallel main arterial supply.77–80 The dominant driving physical forces for collateral artery enlargement are the pressure gradient across the collateral bed and the higher velocity of flow (greater shear rate) through the midzone vessels (see Chapter 8).77,78,80–82 Although the resistance of the collateral bed always exceeds that of the main artery whose function it has replaced, it has been shown experimentally to be able to achieve 40% of maximum conductance.75,83 Acute changes in collateral resistance in response to exercise, sympathectomy, or vasodilator drugs are relatively small, so the resistance of the collateral bed is, for practical purposes, fixed.75,83–85
In contrast, the peripheral runoff bed has a generally high but variable resistance, a large portion of which is concentrated in the terminal arterioles and precapillary sphincters (see Fig. 10-17). Because of their small diameter and heavily muscled walls, these vessels are ideally suited for regulatory function. Their resistance is subject to control by (1) the autonomic nervous system, (2) circulating catecholamines, (3) local metabolic products, and (4) myogenic influences.
Reactive Hyperemia and Exercise
Reactive hyperemia develops in limbs when the arterial circulation is restored after a 5-minute period of ischemia. This response in limbs with obstructive arterial disease differs significantly from that in normal limbs. Peak blood flow is not only lower in obstructed limbs (averaging about 9 to 20 mL/dL/min) but may also be delayed for 15 seconds to 2 minutes, and the hyperemia is prolonged for several minutes.49,50,52
Although blood flow is increased during exercise in limbs with obstructive arterial disease, the magnitude of the increase is far less than that observed in normal limbs undergoing similar stress (see Fig. 10-10).53,54,86,87 The hyperemia is greatly prolonged after cessation of exercise and subsides to normal levels over a period of 4 to 30 minutes (Fig. 10-18). In some limbs with arterial occlusion at two levels (e.g., iliac plus superficial femoral), peripheral blood flow immediately after exercise may be increased only slightly. Flow then rises for several minutes until a peak level is obtained before falling gradually to pre-exercise levels (Fig. 10-19). In patients with multilevel occlusions, especially those with pain at rest, flow after exercise may be depressed, peak flow is quite low and very delayed, and the hyperemic state persists for many minutes (Fig. 10-20).88
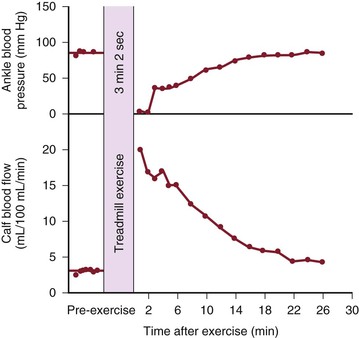
Figure 10-18 Ankle blood pressure and calf blood flow before and after exercise in a patient with stenosis of the superficial femoral artery. (Redrawn from Sumner DS, et al: The relationship between calf blood flow and ankle blood pressure in patients with intermittent claudication. Surgery 65:763, 1969.)
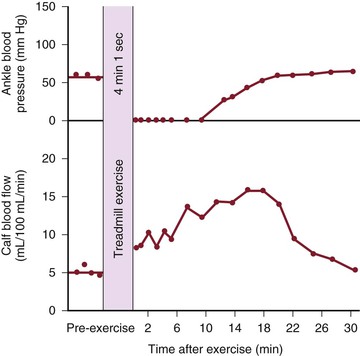
Figure 10-19 Ankle blood pressure and calf blood flow before and after exercise in a patient with stenosis of the iliac artery and occlusion of the superficial femoral artery. (Redrawn from Sumner DS, et al: The relationship between calf blood flow and ankle blood pressure in patients with intermittent claudication. Surgery 65:763, 1969.)
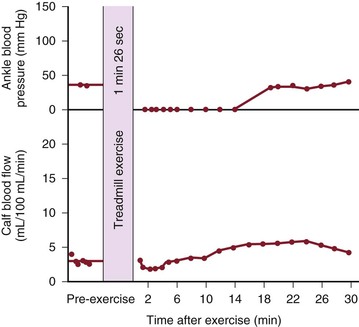
Figure 10-20 Ankle blood pressure and calf blood flow before and after exercise in a patient with occlusion of the iliac, common femoral, and superficial femoral arteries. This patient had severe claudication and moderate pain at rest. (Redrawn from Sumner DS, et al: The relationship between calf blood flow and ankle blood pressure in patients with intermittent claudication. Surgery 65:763, 1969.)
When blood flow to the extremity is increased during or after exercise, blood pressure distal to the arterial lesion falls precipitously (see Fig. 10-12). Recovery to pre-exercise levels requires a prolonged period, usually between 10 and 30 minutes (see Figs. 10-18 to 10-20).34,87,89,90 Even if the obstructive arterial disease in a limb is not severe enough to produce a decrease in distal pressure at rest, exercise or reactive hyperemia causes a fall in pressure.32,33,35 Blood pressure begins to recover after peak flow has begun to decline (see Figs. 10-18 to 10-20).90 These changes account for the fall in ankle pressure and disappearance of pedal pulses after exercise in patients with stenotic arterial lesions in the lower extremity.91,92
Figure 10-21 compares resting resistance and postexercise resistance in normal limbs with those in limbs with occlusive disease of the superficial femoral artery. In normal limbs, segmental resistance refers to the resistance of the widely patent iliac and femoral arteries; in abnormal limbs, segmental resistance primarily reflects the resistance offered by the collateral arteries bypassing the superficial femoral artery occlusion. Calf resistance represents the runoff resistance imposed by intramuscular arterioles, capillaries, and venules as well as the veins draining the extremity. The major part of this resistance is contributed by the arterioles. In this example, we can approximate the total vascular resistance of the limb by adding segmental resistance and calf resistance. Values for total resistance in normal and abnormal limbs at rest are essentially equal; in Figure 10-21, the normal value is 37 PRUs and the abnormal value is 36 PRUs. However, the distribution of the resistance is markedly different.75,83,93 Whereas segmental resistance accounts for less than 3% of the total in normal limbs, it makes up about 38% of the total in abnormal limbs. Resting blood flow rates are equal in the two groups of limbs only because peripheral arterioles in the abnormal limbs dilate enough to compensate for the elevated segmental resistance. That is, calf resistance is much less in abnormal limbs than in normal limbs.
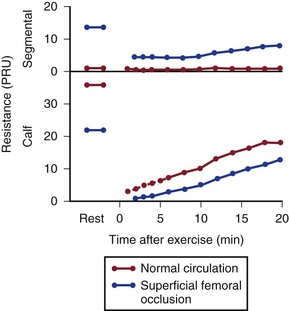
Figure 10-21 Segmental (parallel collateral and main channel) resistance and calf (runoff) resistance in normal individuals and in patients with occlusive disease of the superficial femoral artery. Values at rest and after treadmill exercises are shown. PRU, Peripheral resistance unit. (Data from Sumner DS, et al: The effect of exercise on resistance to blood flow in limbs with an occluded superficial femoral artery. Vasc Surg 4:229, 1970.)
Multiple Lesions and Vascular Steal
Obstructing lesions occupying one arterial segment (e.g., iliac or superficial femoral artery) commonly cause claudication but seldom result in ischemia at rest. However, there are exceptions to this observation. When the lesion is located far distally in the foot or toe, the involved vessel may be an end artery with no adequate collateral network. Blockage of such a vessel leads to severe ischemia. In addition, an acute embolic obstruction in the distal aorta, common femoral artery, or popliteal artery may also obstruct stem or reentry collaterals and create what is, in effect, a multilevel occlusion that may result in severe peripheral ischemia.
Multilevel lesions involve two or more major arterial segments. Peripheral blood flow is more severely compromised than in single-level occlusions because blood must traverse two or more high-resistance collateral beds before reaching the periphery. If the lesions are chronic and confined to two segments (e.g., common iliac and superficial femoral arteries), collateral development is usually adequate to prevent rest pain or ischemic necrosis; claudication, however, is typically severe. Lesions involving three segments (e.g., common iliac, femoral, and popliteal arteries) reduce blood flow markedly and commonly cause pain at rest.
Vascular “steal” may arise when two runoff beds with different resistances must be supplied by a limited source of arterial inflow. Hemodynamic situations in which one vascular bed steals from another can occur in a variety of situations. One example of the steal phenomenon involves a limb with lesions in both the iliac and superficial femoral arteries. Between the fixed resistances of these two arterial lesions is the profunda femoris orifice, which supplies the variable resistance of the thigh. The resistance of the distal calf runoff bed is also variable. Under resting conditions, normal leg blood flow can be maintained by a nearly maximal decrease in calf resistance and a moderate decrease in thigh resistance. This is apparent clinically as abnormally low ankle systolic pressure. With the greater metabolic demands of exercise, thigh resistance can decrease further, but calf resistance has already reached its lower limit. The result is a further drop in pressure across the proximal iliac lesion, which reduces the pressure perfusing the calf. Blood flow to the calf is decreased until thigh resistance rises and thigh blood flow begins to fall. In this situation, the effect of exercise is to increase thigh blood flow, decrease calf blood flow, and decrease distal blood pressure. The thigh steals blood from the calf because the proximal iliac lesion restricts inflow to both runoff beds.
In the subclavian steal syndrome, reversal of flow in the vertebral artery is associated with subclavian artery occlusion and symptoms of brainstem ischemia. When occlusion is present in the proximal subclavian artery on the left or the innominate artery on the right, pressure at the origin of the ipsilateral vertebral artery is reduced. This can result in reversal of flow in the vertebral artery, which then serves as a source of collateral circulation to the arm. The increased demands of arm exercise tend to augment this reversed flow, and the patient may experience ischemia of the brainstem.
When an extraanatomic bypass is performed, a single donor artery must supply several vascular beds. In the case of a femoral-femoral crossover graft, one iliac artery is the donor artery, the leg ipsilateral to the donor artery is the donor limb, and the contralateral leg is the recipient limb. Studies of crossover grafts in animal models have shown that the immediate effect of the graft is to double flow in the donor artery.94,95 When an arteriovenous fistula is created in the recipient limb, graft flow may increase by a factor of 10 without any evidence of steal from the donor limb.
These experimental observations are consistent with hemodynamic data from patients with femoral-femoral grafts.96 Improvement in the ankle-brachial index on the recipient side can be achieved, even when there is significant occlusive disease in both the donor and recipient limbs. Although the ankle-brachial index may decrease slightly on the donor side, symptomatic steal is uncommon. The most important factor contributing to vascular steal with a femoral-femoral graft is stenosis of the donor iliac artery. With iliac stenosis, steal is most likely to occur during exercise, when flow rates are increased. A mildly stenotic iliac can be used as a donor artery when high flow rates are not needed, such as in the treatment of ischemic rest pain. However, when increased flow rates are required to improve the walking distance of a patient with claudication, stenosis of the donor iliac artery may result in steal from the donor limb. Occlusive disease in the arteries of the donor limb distal to the origin of the graft does not result in steal, provided that the donor iliac artery is normal. These principles also apply to other types of extraanatomic bypass grafts, including axillary-axillary, carotid-subclavian, and axillofemoral grafts.94,97
Effect of Stenoses on Waveforms
As illustrated in Figure 10-22, the compliant arterial wall and any collateral channels constitute hydraulic capacitors, which together with the stenosis create a situation analogous to a “low-pass filter.” Passage of a pressure or flow pulse through this circuit attenuates the high-frequency components of the pulse and results in a damped waveform. The arterial pulse pressure distal to a stenosis or occlusion is reduced to a greater extent than mean pressure is.98,99 This phenomenon is due to energy losses associated with greater velocity flow through high-resistance pathways.
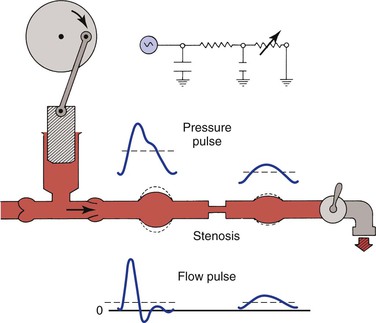
Figure 10-22 Effect of a stenosis and compliant vessels on the contour of arterial pressure and flow pulses. Mean pressure (dashed lines on the pressure pulses) is reduced, but mean flow (dashed lines on the flow pulses) is unchanged. The faucet represents the variable resistance of the peripheral vascular bed. This, together with the fixed resistance of the stenosis and the compliance of the major arteries, constitutes a model of input impedance. (Redrawn from Sumner DS: Correlation of lesion configuration with functional significance. In Bond MG, Insull W, Jr, Glagov S, editors: Clinical diagnosis of atherosclerosis: quantitative methods of evaluation, New York, 1983, Springer-Verlag.)
In addition to the reduction in pulse pressure, the contour of the pressure pulse is changed radically. The upslope is delayed, the peak becomes more rounded, the “notch” on the downslope disappears, and the downslope becomes bowed away from the baseline. These changes are reflected in the plethysmographic (volume) pulse and thus provide a sensitive indicator of the presence of arterial disease.100–102 Further discussion of abnormal plethysmographic pulses can be found in Chapter 15. Similar changes are also observed in the flow pulse distal to an obstructed artery (see Fig. 10-22). In contrast to the normal flow pattern, the wave rises more slowly, has a rounded peak, and declines more gradually toward the baseline during diastole. The reverse flow component also tends to disappear and the waveform becomes monophasic.56,62,103–109
Physiologic Aspects of Arterial Interventions
Treatment of Arterial Occlusive Disease
It should be evident from the concepts presented in this chapter that the abnormally elevated fixed segmental resistance imposed by obstructed major arteries and associated collaterals is the factor responsible for restricting blood flow to the periphery. It follows that intermittent claudication and other symptoms of peripheral ischemia can be alleviated only by a reduction in this fixed segmental resistance. Efforts to reduce the resistance of the peripheral vascular bed are seldom beneficial because this resistance is already adjusted to maintain normal resting blood flow or is maximally reduced in limbs with ischemia at rest (see Fig. 10-13). Peripheral resistance is also maximally reduced during exercise in patients with intermittent claudication (see Fig. 10-21).60,110–113
Vasodilators may increase resting blood flow in normal limbs when resting blood flow is already adequate, but they are unlikely to improve flow in an ischemic limb or during exercise.114,115 These agents may even cause blood to be diverted from areas of relative ischemia to those where disease is less severe. These same criticisms can be applied to surgical sympathectomy (Fig. 10-23).111,112,116 However, sympathectomy does have the advantage that its effects can be confined to the ischemic area, and some relief has been reported after sympathectomy in patients with mild rest pain or superficial ischemic ulcers.117 Still, this improvement is difficult to explain because sympathectomy appears to enhance flow through arteriovenous anastomoses without increasing flow through the nutritive capillary bed.118,119
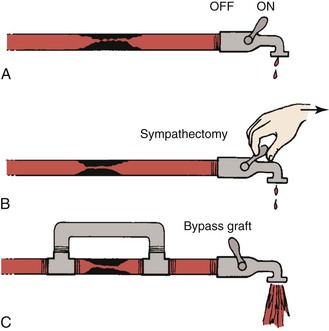
Figure 10-23 Hydraulic model contrasting the effects of sympathectomy and bypass grafting on blood flow. A, The faucet represents peripheral resistance, which is maximally decreased by exercise. B, Resistance cannot be further decreased by sympathectomy. C, A bypass graft circumvents the fixed resistance and permits increased blood flow even with less peripheral vasodilatation. (Redrawn from Sumner DS: Pathophysiology of arterial occlusive disease. In Hershey FB, Barnes RW, Sumner DS, editors: Noninvasive diagnosis of vascular disease, Pasadena, CA, 1984, Appleton Davies.)
Satisfactory reduction of the fixed segmental resistance can be accomplished only by direct surgical or catheter-based interventions (see Fig. 10-23). Exercise therapy is the only nonoperative treatment that consistently affords any objective relief.120,121 Although walking exercise programs can extend maximal walking and claudication distances, there is usually little change in ankle pressure.122,123 This finding suggests that the benefits are due in large part to metabolic changes rather than the development of collaterals. Even though exercise is helpful in patients with claudication, it is applicable only when ischemia is absent at rest, and its effect cannot match the hemodynamic improvement provided by direct interventions. Temporary relief of severe ischemia at rest can sometimes be obtained by rendering the patient hypertensive, thereby increasing the pressure head perfusing the obstructed vascular circuit.120,124 However, because of the adverse effects of hypertension, this approach is rarely used.
Many patients with severe lower extremity ischemia discover that hanging their feet over the edge of the bed or walking a few steps often provides some relief from ischemic rest pain. The improvement in peripheral perfusion that accompanies dependency can be documented objectively with measurement of transcutaneous oxygen tension, which may be increased severalfold over levels measured when the patient is supine.125 According to Equation 10.1, pressure in the dependent arteries, veins, and capillaries is increased by gravity commensurate with the vertical distance from the foot to the heart. Although there is no increase in the arteriovenous pressure gradient, the increased hydrostatic pressure dilates capillaries and microvascular vessels, thereby reducing their resistance, in turn augmenting blood flow. Augmentation of blood flow does not occur in nonischemic limbs because the venoarterial reflex that serves to constrict arterioles in the dependent position remains functional.
According to Poiseuille’s law, hemodynamic resistance is directly proportional to blood viscosity (see Eqs. 10.4 and 10.10). If the pressure remains constant and viscosity is reduced, flow increases in proportion to the fall in viscosity. Because the viscosity of blood increases with hematocrit, it is possible to augment blood flow by hemodilution.126–128 Low-molecular-weight dextran (molecular weight of 40,000) is the most commonly used agent for reducing blood viscosity. The increased peripheral blood flow observed after the intravenous administration of dextran is the result of both peripheral vasodilatation secondary to blood volume expansion and changes in viscosity secondary to hemodilution. An orally administered rheologic agent, pentoxifylline, was evaluated in a multicenter clinical trial for the treatment of patients with intermittent claudication.129 Pentoxifylline reduces blood viscosity by improving the flexibility of red blood cell membranes. The drug also inhibits platelet aggregation and decreases plasma fibrinogen. In the clinical trial, the distance walked before the onset of claudication increased in both the pentoxifylline and placebo groups; however, the degree of improvement was significantly greater in those receiving pentoxifylline.
Arterial Grafts
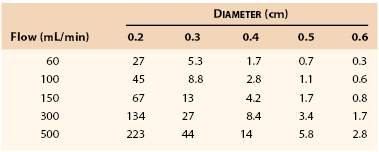
When an arterial graft is required, the surgeon has to make some decisions regarding the choice of graft material, graft diameter, and anastomotic configuration (end to end, side to end, or end to side). Because radius is so important in determining both viscous and inertial energy losses, the graft selected should be large enough to carry all the flow required at rest without causing a drop in pressure; it should also be large enough to accommodate any increased flow likely to be required during exercise without an appreciable drop in pressure.
Table 10-1 lists the pressure gradients that might be expected across a femoropopliteal graft 40 cm long at varying levels of flow. Because these calculations were based on Poiseuille’s equation (see Eq. 10.4), they represent minimal values; the actual drops in pressure would be several times as great, as previously discussed.130 Clearly, a graft with an inside diameter of less than 3 mm would be of marginal value at flow rates normally observed at rest (60 to 150 mL/min) and would be completely unsatisfactory during exercise (300 to 500 mL/min). This theory coincides with clinical observations.131–134
Blood flow in the common femoral artery averages about 350 mL/min at rest and may increase by a factor of 5 to 10 during exercise. According to Poiseuille’s equation, a graft 20 cm long with an inside diameter of 7 mm should be able to carry a flow of 3000 mL/min with a pressure drop of only 4.5 mm Hg. Experimentally, the pressure gradient across similar grafts is somewhat higher, approximating 7 to 10 mm Hg at a flow rate of 1200 mL/min.130,135 Therefore, under most physiologic conditions, an aortofemoral graft with 7-mm limbs should suffice, with flow restricted only during strenuous exercise. However, 6-mm grafts might begin to show some restriction of flow even with mild to moderate exercise.
Under ideal flow conditions, prosthetic grafts develop a thin layer (0.5 to 1.0 mm) of pseudointima. Therefore, after implantation, a 6-mm prosthetic graft might have an internal diameter of only 4 to 5 mm, and a 7-mm graft might have a luminal diameter of 5 to 6 mm. For this reason, when one is performing a femoropopliteal bypass with a prosthetic graft, it is appropriate to select a graft with an original diameter of at least 6 mm. Similarly, the original diameter of an aortofemoral graft limb should be at least 7 mm.
On the other extreme, the diameter of a graft must not be too much larger than that of the recipient arteries.136 It has been shown, both clinically and experimentally, that thrombus accumulates on the inner walls of grafts with excessive diameter (much as they do in aneurysms) as the flow stream tries to approximate the diameter of the recipient vessels and achieve optimal flow conditions. High flow velocity (high shear) is conducive to the formation of a thin, tightly adherent pseudointima, so the diameter of a prosthetic graft should be small enough to ensure a rapid velocity of flow but large enough to avoid restriction of arterial inflow.
Long-term patency of autogenous vein grafts is compromised by intimal hyperplasia, the development of which has also been associated with low shear rates.137–139 Low shear rates cause smooth muscle cells to become secretory and enhance platelet adherence139; high shear rates foster continued patency and lessen the tendency of the intima to become hyperplastic. Studies suggest that diameters of human in-situ vein grafts change with time to normalize shear stress.140 Vein grafts with initially high shear rates tend to dilate, but those with low shear rates tend to contract. The diameters of lower extremity vein grafts appear to increase transiently in response to acute increases in blood flow, a response that may be attributed to the release of nitric oxide from the endothelium in response to increased shear stress.141 However, nitric oxide activity has been shown to be significantly impaired in vein grafts (especially under low-flow conditions), an alteration that may contribute to intimal hyperplasia.142,143
Anastomoses
Because any change in the direction of blood flow increases energy losses due to inertial factors, an end-to-end anastomosis is more hemodynamically efficient than a side-to-end or end-to-side anastomosis. The greater the angle between the graft and native vessels, the greater the energy losses become. However, even though energy losses may be increased by a large angle, the increase in pressure drop is only a few millimeters of mercury and ordinarily of no clinical significance. For example, from the point of view of transmitting blood efficiently, it makes little difference whether the donor anastomosis of a femoral-femoral graft is made at an angle of 135 degrees (requiring flow to reverse or sharply change direction) or a more hemodynamically satisfactory angle of 45 degrees.68,144
Any time a graft leaves or enters another vessel at an angle, flow disturbances are created and result in zones of flow separation, stagnation, and turbulence (Figs. 10-24 and 10-25).68,133,145,146 The “floor” of an end-to-side anastomosis (in the recipient vessel opposite the anastomosis), the “toe” of the anastomosis (on the near wall just beyond the suture line), and the “heel” (on the near wall proximal to the junction) appear to be prominent sites of flow separation where shear is low and shear stress fluctuates.133,145 Low shear and oscillatory shear stresses are conducive to platelet adhesion, intimal hyperplasia, and atherosclerosis, and high shear may result in endothelial damage.68,146–148 The ultimate result is endothelial thickening or thrombus formation, which may lead to graft failure.149 Therefore, the goal of long-term graft patency is best achieved by construction of an end-to-end anastomosis. When this is not feasible, an anastomosis with an acute (small) angle is most desirable.
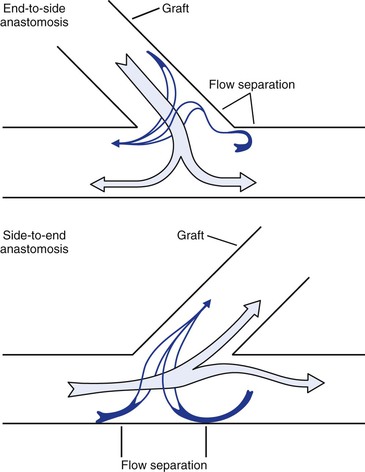
Figure 10-24 Flow patterns at end-to-side and side-to-end anastomoses. Near the wall, blood flow may reverse and travel circumferentially to reach the recipient conduit. Areas of flow separation are prone to the development of neointimal hyperplasia. (Redrawn from Sumner DS: Hemodynamics of abnormal blood flow. In Veith FJ, et al, editors: Vascular surgery: principles and practice, ed 2. New York, 1994, McGraw-Hill.)
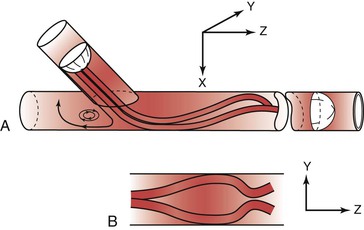
Figure 10-25 Flow pattern in a three-dimensional model of an end-to-side anastomosis. Note the impingement of high-velocity flow on the “floor” of the anastomosis and the helical pattern that develops beyond the anastomosis. Reversal of flow occurs in the proximal segment of the recipient vessel. A, Model tilted toward the observer. B, Model viewed from above. The x, y, and z represent coordinates for orientation of the model. (Redrawn from Ojha M, et al: Steady and pulsatile flow fields in an end-to-side arterial anastomosis model. J Vasc Surg 12:747, 1990.)
Stresses at Graft-Artery Anastomoses
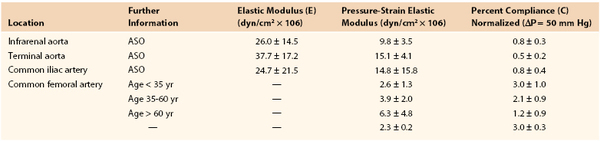
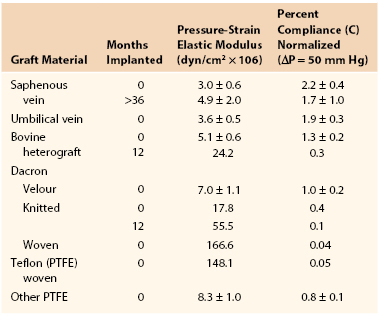
Joining a stiff graft to a relatively compliant artery places additional stress on the suture line that may lead to intimal hyperplasia or the development of a false aneurysm.145,150–154 Since the advent of synthetic monofilament vascular sutures, most anastomotic disruptions develop in the arterial wall while the sutures remain intact.155,156 On the basis of the data in Tables 10-2 and 10-3, the circumference of a young femoral artery measuring 7 mm in diameter would increase 1.32 mm with each 50–mm Hg pressure pulse, whereas the circumference of a woven Dacron graft of the same diameter would increase only 0.02 mm, a disparity of 1.30 mm. Because these increases are repeated 100,000 times per day, this small difference would result in fatigue of the arterial wall. Both theoretically and experimentally, stresses can be minimized if the ratio of the diameter of a stiff graft to that of a compliant artery is about 1.4 : 1.157,158
Because the impedance of a stiff graft is greater than that of a compliant artery, pulsatile energy is reflected at the proximal suture line. When a Dacron graft is sutured to an infrarenal aorta, about 41% of the incident pulsatile energy is reflected.24 Because this reflection augments the pressure pulsations proximal to the graft, additional stress is placed on the suture line,159 which may contribute to disruption of the proximal anastomosis. Shear stresses produced by vibrations generated at end-to-side anastomoses may also contribute to the formation of false aneurysms.
Aneurysms and Arterial Wall Stress
The tangential stress (τ) within the wall of a fluid-filled cylindrical tube can be expressed as:
 (10.11)
where P is the pressure exerted by the fluid (in dyne/cm2), r is the internal radius (cm), and δ is the thickness of the tube wall (cm). Stress (τ) has the dimensions of force per unit area of tube wall (dyne/cm2). Thus, tangential stress is directly proportional to pressure and radius but inversely proportional to wall thickness. Equation 10.11 is similar to Laplace’s law, which defines tangential tension (T) as the product of pressure and radius:
 (10.12)
Tension is given in units of force per tube length (dyne/cm). The terms “stress” and “tension” have different dimensions and describe the forces acting on the tube wall in different ways. Laplace’s law can be used to characterize thin-walled structures such as soap bubbles; however, it is not suitable for describing stress in arterial walls.
When the structural components of the arterial wall are weakened, aneurysms may form. An aneurysm ruptures when the tangential stress within its wall exceeds the tensile strength of the wall at any point. Because the wall stress in a sphere is half that in a cylinder with the same radius and because the typical configuration of an aneurysm is a cross between a sphere and a cylinder, Equation 10.11 actually overestimates the stress in aneurysm walls.160 Figure 10-26 shows a cylinder with an outside diameter of 2 cm and a wall thickness of 0.2 cm. These dimensions are compatible with those found in atherosclerotic terminal aortas.24,161 The circumferential wall stress within this structure would be 8.0 × 10⁵ dyn/cm2 when the internal pressure is 150 mm Hg. If this tube were distended without the volume of material increasing in the wall, the wall would simultaneously become thinner. In the case illustrated, the tube has been expanded to aneurysmal dimensions with an outside diameter of 6 cm, and wall thickness has decreased to 0.06 cm. Tripling the radius and decreasing wall thickness cause the circumferential stress in the wall of the expanded cylinder to increase to 98.0 × 10⁵ dyn/cm2, provided that pressure remains at 150 mm Hg (see Eq. 10.11). Thus, in this theoretical model, stress per unit area of wall increases by a factor of 12, even though arterial diameter has enlarged only three times.
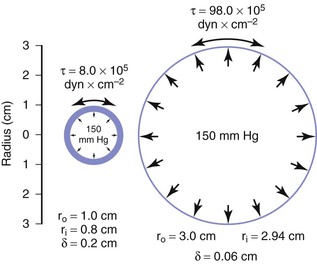
Figure 10-26 End-on view of a cylinder 2 cm in diameter before (left) and after (right) expansion to a diameter of 6 cm. Wall area remains the same in the two cases, but wall stress (τ) is greatly increased because of both the decrease in wall thickness (δ) and the increase in inside radius (r1).
Because of the sluggish flow and low shear stress on the inner wall of aneurysms, layers of thrombus develop and tend to keep the diameter of the lumen near that of the normal artery. Because this thrombus increases the effective thickness of the vessel wall, it may reduce tangential stress and provide some protection against rupture. However, the tensile strengths of the thrombus and arterial wall are not the same, and the contribution of the thrombus to the integrity of an aneurysm is difficult to predict.160 Furthermore, the thrombus within an aneurysm is often not circumferential. In this situation, Equation 10.11 can be applied to the wall segment without thrombus, and the tangential stress at that site depends on the maximum internal radius.
Although the tensile strength of collagen is extremely high, it constitutes only about 15% of the aneurysm wall.162 Furthermore, the collagen fibers in an aneurysm are sparsely distributed and subject to fragmentation. The tendency of larger aneurysms to rupture is readily explained by the effect of increased radius on tangential stress (see Eq. 10.11) and degenerative changes in the arterial wall. This relationship between tangential stress and blood pressure accounts for the contribution of hypertension to the risk of rupture.
Selected Key References
Carter SA. Response of ankle systolic pressure to leg exercise in mild or questionable arterial disease. N Engl J Med. 1972;287:578–582.
One of the early papers on the use of ankle pressure in the diagnosis of arterial disease.
Ku DN, Giddens DP, Phillips DJ, Strandness DR Jr. Hemodynamics of the normal human carotid bifurcation—in vitro and in vivo studies. Ultrasound Med Biol. 1985;1:13–26.
Elegant study on carotid bifurcation flow patterns, including flow separation.
May AG, Van de Berg L, DeWeese JA, Rob CG. Critical arterial stenosis. Surgery. 1963;54:250–259.
Classic paper on the concept of critical arterial stenosis.
Nichols WM, O’Rourke MF, Vlachopoulos C. McDonald’s blood flow in arteries: theoretical, experimental and clinical principles. ed 6. Hodder Arnold: London; 2011.
Comprehensive basic text on hemodynamics.
Strandness DE Jr, Sumner DS. Hemodynamics for surgeons. Grune & Stratton: New York; 1975.
In-depth textbook that covers hemodynamic principles with an emphasis on clinical problems of interest to the vascular specialist.
Sumner DS, Strandness DE Jr. The relationship between calf blood flow and ankle blood pressure in patients with intermittent claudication. Surgery. 1969;65:763–771.
Original paper describing the physiology of intermittent claudication.
The reference list can be found on the companion Expert Consult website at www.expertconsult.com.
References
1. Gauer OH, et al. Postural changes in the circulation. [Sect 2: circulation] Handbook of physiology. American Physiological Society: Washington, DC; 1965:2409. Hamilton WF, et al. Handbook of physiology. vol III [Sect 2: circulation] .
2. Guyton AC. Venous return. [Sect 2: circulation] Handbook of physiology. American Physiological Society: Washington, DC; 1963:1099. Hamilton WF, et al. Handbook of physiology. vol II [Sect 2: circulation] .
3. Daily JW, et al. Fluid dynamics. Addison-Wesley: Reading, MA; 1966.
4. Burton AC. Physiology and biophysics of the circulation. 2nd ed. Year Book: Chicago; 1972.
5. Rijsterborgh H, et al. Doppler assessment of aortic stenosis: Bernoulli revisited. Ultrasound Med Biol. 1987;13:241.
6. Pedersen EM, et al. Three-dimensional visualization of velocity profiles in the porcine abdominal aortic trifurcation. J Vasc Surg. 1992;15:194.
7. Vieli A, et al. Velocity profiles in the normal human abdominal aorta: a comparison between ultrasound and magnetic resonance data. Ultrasound Biol Med. 1989;15:113.
8. Malcome AD, et al. Flow disturbances at the apex and lateral angles of a variety of bifurcation models and their role in the development and manifestations of arterial disease. Stroke. 1979;10:335.
9. Segadal L, et al. Blood velocity distribution in the human ascending aorta. Circulation. 1987;76:90.
10. Schultz DL. Pressure and flow in large arteries. Cardiovascular fluid dynamics. Academic Press: New York; 1972:287. Bergel DH. Cardiovascular fluid dynamics. vol I.
11. Attinger EO. Flow patterns and vascular geometry. Attinger EO. Pulsatile blood flow: proceedings of the First International Symposium on Pulsatile Blood Flow, April 11-13, 1963, the Presbyterian Hospital in Philadelphia. McGraw-Hill: New York; 1964:179.
12. Yellin EL. Laminar-turbulent transition process in pulsation flow. Circ Res. 1966;19:791.
13. Streeter VC, et al. Pulsatile pressure and flow through distensible vessels. Circ Res. 1963;13:3.
14. Berguer R, et al. Critical arterial stenosis: a theoretical and experimental solution. Ann Surg. 1974;180:39.
15. O’Rourke MF. Steady and pulsatile energy losses in the systemic circulation under normal conditions and in simulated arterial disease. Cardiovasc Res. 1967;1:313.
16. McDonald DA. Blood flow in arteries. 2nd ed. Williams & Wilkins: Baltimore; 1974.
17. Attinger EO, et al. Pressure flow relations in dog arteries. Circ Res. 1966;19:230.
18. Ling SC, et al. Non-linear analysis of aortic flow in living dogs. Circ Res. 1973;33:198.
19. Milnor WR. Pulsatile blood flow. N Engl J Med. 1972;287:27.
20. Byar D, et al. The fallacy of applying Poiseuille equation to segmented arterial stenosis. Am Heart J. 1965;70:216.
21. Fiddian RV, et al. Factors affecting flow through a stenosed vessel. Arch Surg. 1964;88:105.
22. Kindt GW, et al. The effect of stricture length on critical arterial stenosis. Surg Gynecol Obstet. 1969;128:729.
23. May AG, et al. Hemodynamic effects of arterial stenosis. Surgery. 1963;53:513.
24. Strandness DE Jr, et al. Hemodynamics for surgeons. Grune & Stratton: New York; 1975.
25. Young DF, et al. Flow characteristics of models of arterial stenosis. II: unsteady flow. J Biomech. 1973;6:547.
26. Young DF, et al. Flow characteristics in models of arterial stenoses. I: steady flow. J Biomech. 1973;6:395.
27. May AG, et al. Critical arterial stenosis. Surgery. 1963;54:250.
28. Moore WS, et al. Effect of flow rate and vessel caliber on critical arterial stenosis. J Surg Res. 1979;26:1.
29. Moore WS, et al. Blood pressure gradient to estimate flow changes with progressive arterial stenosis. Surg Forum. 1973;24:248.
30. Sydorak GR, et al. Effect of increasing flow rates and arterial caliber on critical arterial stenoses. Surg Forum. 1972;23:243.
31. Van deBerg L, et al. The effect of arterial stenosis and sympathectomy on blood flow and the ergogram. Ann Surg. 1964;159:623.
32. Carter SA. Response of ankle systolic pressure to leg exercise in mild or questionable arterial disease. N Engl J Med. 1972;287:578.
33. Strandness DE Jr. Abnormal exercise response after successful reconstructive arterial surgery. Surgery. 1966;59:325.
34. Strandness DE Jr, et al. An evaluation of the hemodynamic response of the claudicating extremity to exercise. Surg Gynecol Obstet. 1964;119:1237.
35. Moore WS, et al. Unrecognized aortoiliac stenosis: a physiologic approach to the diagnosis. Arch Surg. 1971;103:633.
36. Wesolowski SA, et al. Indications for aortofemoral arterial reconstruction: a study of borderline risk patients. Surgery. 1966;60:288.
37. Brice JG, et al. Hemodynamic effects of carotid artery stenosis. BMJ. 1964;2:1363.
38. Vonruden WJ, et al. Multiple arterial stenosis: effect on blood flow. Arch Surg. 1964;89:307.
39. Flanigan DP, et al. Multiple subcritical arterial stenoses: effect on poststenotic pressure and flow. Ann Surg. 1977;186:663.
40. Karayannacos PE, et al. The role of multiple noncritical arterial stenoses in the pathogenesis of ischemia. J Thorac Cardiovasc Surg. 1977;73:458.
41. Dundas P, et al. Profunda revascularization: the early postoperative effect upon calf blood flow. Scand J Thorac Cardiovasc Surg. 1971;5:275.
42. Martin P, et al. On the surgery of atherosclerosis of the profunda femoris artery. Surgery. 1972;71:182.
43. Morris GC Jr, et al. Surgical importance of the profunda femoris artery. Arch Surg. 1961;82:32.
44. Strandness DE Jr. Functional results after revascularization of the profunda femoris artery. Am J Surg. 1970;119:240.
45. Cobb LA, et al. External iliac vein flow: its response to exercise and relation to lactate production. J Appl Physiol. 1969;26:606.
46. Folse JR. Application of the sudden injection dye dilution principle to the study of the femoral circulation. Surg Gynecol Obstet. 1965;120:1194.
47. Lewis P, et al. Common femoral artery volume flow in peripheral vascular disease. Br J Surg. 1990;77:183.
48. Wahren J, et al. Determinations of leg blood flow during exercise in man: an indicator-dilution technique based on femoral venous dye infusion. Clin Sci Mol Med. 1973;45:135.
49. Hillestad LK. The peripheral blood flow in intermittent claudication. V: plethysmographic studies: the significance of the calf blood flow at rest and in response to timed arrest of the circulation. Acta Med Scand. 1963;174:23.
50. Strandell T, et al. Circulation in the calf at rest, after arterial occlusion and after exercise in normal subjects and in patients with intermittent claudication. Acta Med Scand. 1963;173:99.
51. Lassen NA, et al. Validity of the xenon 133 method for measurement of muscle blood flow evaluated by simultaneous venous occlusion plethysmography: observations in the calf of normal man and in patients with occlusive vascular disease. Circ Res. 1965;16:287.
52. Snell ES, et al. Circulation in lower limb before and after reconstruction of obstructed main artery. Lancet. 1960;1:242.
53. Lassen NA, et al. Calf muscle blood flow during walking studied by the 133Xe method in normals and in patients with intermittent claudication. Scand J Clin Lab Invest. 1965;17:447.
54. Pentecost BL. The effect of exercise on the external iliac vein blood flow and local oxygen consumption in normal subjects, and in those with occlusive arterial disease. Clin Sci. 1964;27:437.
55. Remington JW, et al. Formation of peripheral pulse contour in man. J Appl Physiol. 1956;9:433.
56. Yao ST. Haemodynamic studies in peripheral arterial disease. Br J Surg. 1970;57:761.
57. Stahler C, et al. Ankle blood pressure response to gradual treadmill exercise. Angiology. 1967;18:237.
58. Shepherd JT. Physiology of the circulation in human limbs in health and disease. WB Saunders: Philadelphia; 1963.
60. Remensnyder JP, et al. Functional sympatholysis during muscular activity. Circ Res. 1962;11:370.
61. Beiser GD, et al. The role of skin and muscle resistance vessels in reflexes mediated by the baroreceptor system. J Clin Invest. 1970;49:225.
62. James IM, et al. Observations on the extrinsic neural control of cerebral blood flow in the baboon. Circ Res. 1969;25:77.
63. Johnson PC. Review of previous studies and current theories of autoregulation. Circ Res. 1964;14:15.
64. Jones RD, et al. Intrinsic regulation of skeletal muscle blood flow. Circ Res. 1964;14:126.
65. Lassen NA. Cerebral blood flow and oxygen consumption in man. Physiol Rev. 1959;39:183.
66. Korner PI. Control of blood flow to special vascular areas: brain, kidney, muscle, skin, liver and intestine. [Physiology: series 1, vol 1: cardiovascular physiology] Guyton AC, et al. MTP International review of science. Butterworths: London; 1974.
67. Gutstein WH, et al. In vitro studies of local blood flow disturbance in a region of separation. J Atheroscler Res. 1968;8:381.
68. Logerfo FW, et al. Boundary layer separation in models of side-to-end arterial anastomoses. Arch Surg. 1979;114:1364.
69. Ku DN, et al. Hemodynamics of the normal human carotid bifurcation—in vitro and in vivo studies. Ultrasound Med Biol. 1985;1:13.
70. Phillips DJ, et al. Flow velocity patterns in the carotid bifurcations of young, presumed normal subjects. Ultrasound Med Biol. 1983;1:39.
71. Fox JA, et al. Localization of atheroma: a theory based on boundary layer separation. Br Heart J. 1966;28:388.
72. Westerhof N, et al. Forward and backward waves in the arterial system. Cardiovasc Res. 1972;6:648.
73. Rittenhouse EA, et al. Directional arterial flow velocity: a sensitive index of changes in peripheral vascular resistance. Surgery. 1976;79:359.
74. Mozersky DJ, et al. Transcutaneous measurement of the elastic properties of the human femoral artery. Circulation. 1972;46:948.
75. Sumner DS, et al. The effect of exercise on resistance to blood flow in limbs with an occluded superficial femoral artery. Vasc Surg. 1970;4:229.
76. Longland CJ. The collateral circulation of the limb. Ann R Coll Surg Engl. 1953;13:161.
77. Conrad MC, et al. Chronic collateral growth after femoral artery occlusion in the dog. J Appl Physiol. 1971;31:550.
78. John HT, et al. The stimulus to collateral circulation. Surgery. 1961;49:14.
79. Rosenthal SL, et al. Hemodynamics of collateral vasodilatation following femoral artery occlusion in anesthetized dogs. Circ Res. 1968;23:239.
80. Winblad JN, et al. Etiologic mechanisms in the development of collateral circulation. Surgery. 1959;45:105.
81. Holman E. Problems in the dynamics of blood flow. I: conditions controlling collateral circulation in the presence of an arteriovenous fistula and following ligation of an artery. Surgery. 1949;26:880.
82. Keenan RL, et al. Competition between collateral vessels. Cardiovasc Res. 1973;7:670.
83. Ludbrook J. Collateral artery resistance in the human lower limb. J Surg Res. 1966;6:423.
84. Beaconsfield PA. A. Effect of exercise on muscle blood flow in normal and sympathectomized limbs. B. Collateral circulation before and after sympathectomy. Ann Surg. 1954;140:786.
85. Dornhorst AC, et al. Collateral resistance in limbs with arterial obstruction: spontaneous changes and effects of sympathectomy. Clin Sci. 1951;10:371.
86. Folse R. Alterations in femoral blood flow and resistance during rhythmic exercise and sustained muscular contractions in patients with arteriosclerosis. Surg Gynecol Obstet. 1965;121:767.
87. Wolf EA Jr, et al. Correlation between nutritive blood flow and pressure in limbs of patients with intermittent claudication. Surg Forum. 1972;23:238.
88. Angelides NS, et al. Simultaneous isotope clearance from the muscles of the calf and thigh. Puel P, et al. Hemodynamics of the limbs: 1. GEPESC: Toulouse; 1979:547.
89. Lewis JD, et al. Simultaneous flow and pressure measurements in intermittent claudication. Br J Surg. 1972;59:418.
90. Sumner DS, et al. The relationship between calf blood flow and ankle blood pressure in patients with intermittent claudication. Surgery. 1969;65:763.
91. DeWeese JA. Pedal pulses disappearing with exercise: a test for intermittent claudication. N Engl J Med. 1960;262:1214.
92. DeWeese JA, et al. Stenoses of arteries of the lower extremity. Arch Surg. 1964;89:806.
93. Farrar DJ, et al. Large vessel impedance in peripheral atherosclerosis. Circulation. 1977;56(Suppl 2):171.
94. Ehrenfeld WK, et al. Vascular “steal” phenomenon—an experimental study. Am J Surg. 1968;116:192.
95. Shin CS, et al. The hemodynamics of extraanatomic bypass grafts. Surg Gynecol Obstet. 1979;148:567.
96. Sumner DS, et al. The hemodynamics of the femorofemoral shunt. Surg Gynecol Obstet. 1972;134:629.
97. Mozersky DJ, et al. The hemodynamics of the axillary-axillary bypass. Surg Gynecol Obstet. 1972;135:925.
98. Edholm OG, et al. Resting blood flow and blood pressure in limbs with arterial obstruction. Clin Sci. 1951;10:361.
99. Keitzer WF, et al. Hemodynamic mechanism for pulse changes seen in occlusive vascular disease. Surgery. 1965;57:163.
100. Conrad MC, et al. Hemodynamics of large and small vessels in peripheral vascular disease. Circulation. 1964;29:847.
101. Darling RC, et al. Quantitative segmental pulse and volume recorder: a clinical tool. Surgery. 1973;72:873.
102. Strandness DE Jr, et al. Peripheral vascular disease: diagnosis and objective evaluation using a mercury strain gauge. Ann Surg. 1965;161(Suppl):1.
103. Baird RN, et al. Upstream stenosis, its diagnosis by Doppler signals from the femoral artery. Arch Surg. 1980;115:1316.
104. Evans DH, et al. The relationship between ultrasonic pulsatility index and proximal arterial stenosis in a canine model. Circ Res. 1980;46:470.
105. Fronek A, et al. Non-invasive physiologic tests in the diagnosis and characterization of peripheral arterial occlusive disease. Am J Surg. 1973;126:205.
106. Gosling RG, et al. The quantitative analysis of occlusive peripheral arterial disease by a nonintrusive ultrasonic technique. Angiology. 1971;22:52.
107. Nicolaides AN, et al. The value of Doppler blood velocity tracings in the detection of aortoiliac disease in patients with intermittent claudication. Surgery. 1976;80:774.
108. Strandness DE Jr, et al. Ultrasonic flow detection: a useful technique in the evaluation of peripheral vascular disease. Am J Surg. 1967;113:311.
109. Yao ST, et al. Pulse examination by an ultrasonic method. BMJ. 1968;4:555.
110. Cousins MJ, et al. Graft, muscle, skin blood flow after epidural block in vascular surgical procedures. Surg Gynecol Obstet. 1971;133:59.
111. Hoffman DC, et al. Muscle blood flow and sympathectomy. Surg Gynecol Obstet. 1968;127:12.
112. Rutherford RB, et al. Extremity blood flow and distribution: the effects of arterial occlusion, sympathectomy, and exercise. Surgery. 1971;69:332.
113. Schwartz LB, et al. Input impedance of revascularized skeletal muscle, renal, and mesenteric vascular beds. Vasc Surg. 1966;30:459.
114. Coffman JD, et al. Failure of vasodilator drugs in arteriosclerosis obliterans. Ann Intern Med. 1972;76:35.
115. Weissenhofer W, et al. Hemodynamic response to vasodilation and exercise in “critical” arterial stenosis. Arch Surg. 1974;108:712.
116. Cronenwett JL, et al. Hemodynamic effects of sympathectomy in ischemic canine hind limbs. Surgery. 1980;87:417.
117. Strandness DE Jr, et al. Critical evaluation of the results of lumbar sympathectomy. Ann Surg. 1964;160:1021.
119. van Dielen FMH, et al. Effects of surgical sympathectomy on skin blood flow in a rat model of chronic limb ischemia. World J Surg. 1998;22:807.
120. Larsen OA, et al. Medical treatment of occlusive arterial disease of the legs: walking exercise and medically induced hypertension. Angiologica. 1969;6:288.
121. Skinner JS, et al. Exercise and intermittent claudication. II: effect of physical training. Circulation. 1967;36:23.
122. Feinberg RL, et al. The ischemic window: a method for the objective quantitation of the training effect in exercise therapy for intermittent claudication. J Vasc Surg. 1992;16:244.
123. Johnson EC, et al. Effects of exercise training on common femoral artery blood flow in patients with intermittent claudication. Circulation. 1989;80:III59.
124. Lassen NA, et al. Conservative treatment of gangrene using mineral corticoid-induced moderate hypertension. Lancet. 1968;1(7543):606.
125. Scheffler A, et al. A comparative analysis of transcutaneous oximetry (tcPO2) during oxygen inhalation and leg dependency in severe peripheral arterial occlusive disease. J Vasc Surg. 1992;16:218.
126. Dormandy JA. Significance of hemorrheology in the management of the ischemic limb. World J Surg. 1983;7:319.
127. LeVeen HH, et al. Lowering blood viscosity to overcome vascular resistance. Surg Gynecol Obstet. 1980;150:139.
128. Wolfe JHN, et al. The effect of hemodilution upon patients with intermittent claudication. Surg Gynecol Obstet. 1985;160:347.
129. Porter JM, et al. Pentoxifylline efficacy in the treatment of intermittent claudication: multicenter controlled double-blind trial with objective assessment of chronic occlusive disease patients. Am Heart J. 1982;104:66.
130. Sanders RJ, et al. The significance of graft diameter. Surgery. 1980;88:856.
131. Buxton B, et al. The significance of vein wall thickness and diameter in relation to the patency of femoropopliteal saphenous vein bypass grafts. Surgery. 1980;87:425.
132. Edwards WS, et al. The importance of proper caliber of lumen in femoral-popliteal artery reconstruction. Surg Gynecol Obstet. 1966;122:37.
133. Ojha M, et al. Steady and pulsatile flow fields in an end-to-side arterial anastomosis model. J Vasc Surg. 1990;12:747.
134. Wengerter KR, et al. Influence of vein size (diameter) on infrapopliteal reversed vein graft patency. J Vasc Surg. 1990;11:525.
135. Schultz RD, et al. Pressure-flow relations of the end-side anastomosis. Surgery. 1967;62:319.
136. Schneider JR, et al. Lack of diameter effect on short-term patency of size-matched Dacron aortofemoral grafts. J Vasc Surg. 1991;13:785.
137. Berguer R, et al. Intimal hyperplasia: an experimental study. Arch Surg. 1980;115:332.
138. Lye CR, et al. The transcutaneous measurement of the elastic properties of the human saphenous vein femoropopliteal bypass graft. Surg Gynecol Obstet. 1975;141:891.
139. Okadone K, et al. Ultrastructural evidence of the effects of shear stress variation on intimal thickening in dogs with arterially transplanted autologous grafts. J Cardiovasc Surg. 1990;31:719.
140. Fillinger MF, et al. Vein adaptation to the hemodynamic environment of infrainguinal grafts. J Vasc Surg. 1994;19:970.
141. Golledge J, et al. Dilatation of saphenous vein grafts by nitric oxide. Eur J Vasc Endovasc Surg. 1977;14:41.
142. Cambria RA, et al. Chronic changes in blood flow alter endothelium-dependent responses in autogenous vein grafts in dogs. J Vasc Surg. 1994;20:765.
143. Park TC, et al. Human saphenous vein grafts explanted from the arterial circulation demonstrate altered smooth-muscle and endothelial responses. J Vasc Surg. 1993;18:61.
144. Lye CR, et al. Hemodynamics of the retrograde cross-pubic anastomosis. Surg Forum. 1975;26:298.
145. Bassiouny HS, et al. Anastomotic intimal hyperplasia: mechanical injury or flow-induced? J Vasc Surg. 1992;15:708.
146. Crawshaw HM, et al. Flow disturbance at the distal end-to-side anastomosis: effect of patency of the proximal outflow segment and angle of anastomosis. Arch Surg. 1980;115:1280.
147. McMillan DE. Blood flow and the localization of atherosclerotic plaques. Stroke. 1985;16:582.
148. Zarins CK, et al. Carotid bifurcation atherosclerosis: quantitative correlation of plaque localization with flow velocity profiles and wall shear stress. Circ Res. 1983;53:502.
149. LoGerfo FW, et al. Downstream anastomotic hyperplasia: a mechanism of failure of Dacron arterial grafts. Ann Surg. 1983;197:479.
150. Abbott WM, et al. The role of mechanical properties in graft design. Dardik H. Graft materials in vascular surgery. Symposia Specialist: Miami; 1978:59.
151. Hokanson DE, et al. Stress-strain characteristics of various arterial grafts. Surg Gynecol Obstet. 1968;127:57.
152. Mehigan DG, et al. Is compliance mismatch the major cause of anastomotic arterial aneurysms? J Cardiovasc Surg. 1985;26:147.
153. Walden R, et al. Matched elastic properties and successful arterial grafting. Arch Surg. 1980;115:1166.
154. Dobrin PB, et al. Mechanics of end-to-end artery-to-PTFE graft anastomoses. Ann Vasc Surg. 1998;12:317.
155. Kinley CE, et al. Compliance: a continuing problem with vascular grafts. J Cardiovasc Surg. 1980;21:163.
156. Nichols WK, et al. Anastomotic aneurysms following lower extremity revascularization. Surgery. 1980;88:366.
157. Kinley CE, et al. Stress at vascular anastomosis in relation to host artery: synthetic graft diameter. Surgery. 1974;75:28.
158. Paasche PE, et al. Consideration of suture line stresses in the selection of synthetic grafts for implantation. J Biomech. 1973;6:253.
159. Newman DL, et al. Pressure amplitude increase on unmatching the aorto-iliac junction of the dog. Cardiovasc Res. 1973;7:6.
160. Dobrin PB. Mechanics of normal and diseased blood vessels. Ann Vasc Surg. 1988;2:283.
161. Sumner DS, et al. Arterial walls before and after endarterectomy, stress-strain characteristics and collagen-elastic content. Arch Surg. 1969;99:606.
162. Sumner DS, et al. Stress-strain characteristics and collagen-elastic content of abdominal aortic aneurysms. Surg Gynecol Obstet. 1970;130:459.