[level-membership-for-critical-care-medicine-category]4
Arterial, Central Venous, and Pulmonary Artery Catheters
Arterial Catheters
What Do They Offer?
Arterial Pressure Measurement
The optimal range of arterial pressure depends on individual patient characteristics, on underlying diseases, and also on treatment. Hence, it is impossible to give an optimal range of arterial pressure that is applicable in all patients. When arterial pressure needs to be evaluated accurately, oscillometric measurements become unreliable,1 and insertion of an arterial catheter is indicated.
1. Hypotensive states associated with (a risk of) altered tissue perfusion. Hypotension that is resistant to fluid administration requires the administration of vasopressor agents, and invasive measurement of arterial pressure is then necessary to titrate this form of therapy. Norepinephrine is the vasopressor agent most commonly used in this setting. A mean arterial pressure (MAP) of 65 to 70 mm Hg is usually targeted, but this level must be adapted to the individual patient and the clinical scenario; in particular, elderly patients with atherosclerotic disease may require higher levels than younger individuals with normal arteries.
2. Intravenous vasodilator therapy. Vasodilating therapy (e.g., nitrates and hydralazine) is a mainstay in the management of heart failure, because it can increase cardiac output. Close monitoring of arterial pressure is essential to avoid excessive hypotension.
3. Severely hypertensive states. Extreme hypertension may result in organ impairment, especially of the brain and the heart. Sodium nitroprusside or calcium entry blockers usually are used to lower arterial pressure, and careful, accurate monitoring is essential to titrate the antihypertensive therapy.
4. Induction of hypertension. Hypertension is sometimes induced in patients with neurologic diseases. Severe cerebral edema with intracranial hypertension, in particular, requires vasopressor support to maintain cerebral perfusion pressure (the gradient between the MAP and the intracranial pressure); likewise, hypertension may be used to treat or prevent the development of vasospasm secondary to subarachnoid hemorrhage, as part of the so-called triple-H therapy (hypertension, hypervolemia, hemodilution). Norepinephrine usually is used for this purpose.
Fluid Responsiveness
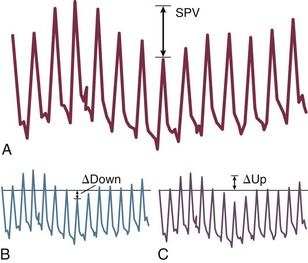
Variations in arterial pressure during positive-pressure ventilation have been used as a measure of fluid responsiveness. The transient increases in intrathoracic pressure influence venous return in patients who are likely to respond to fluid administration. This fluctuation in ventricular filling will translate into fluctuations in arterial pressure a few beats later. Accordingly, the greater the degree of systolic arterial pressure, or pulse pressure, variation during the respiratory cycle, the greater will be the increase in cardiac output in response to fluid administration (Fig. 4.1). However, this observation is valid primarily in patients without spontaneous respiratory movements and without significant arrhythmias, and only when a sufficient tidal volume is applied.2,3
Access
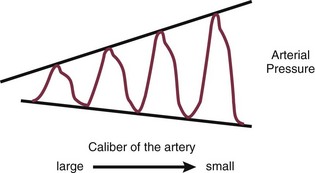
For placement of arterial catheters, usually the radial artery is used. The femoral artery can be easily cannulated and gives a better signal, but presence of a femoral catheter interferes more with patient mobility and warrants concern about infection.4 Use of other sites, such as the brachial or the axillary artery or even the dorsalis pedis artery,5 can be considered. An important point to keep in mind is that the pulse pressure increases from the core to the periphery. In other words, the systolic pressure is overestimated in smaller arteries (Fig. 4.2). Hence, it may be better to rely more on mean values than on systolic or diastolic pressures.
Central Venous Catheters
What Do They Offer?
Measurement of Central Venous Pressure
Clinically, CVP can be assessed by evaluation of the degree of jugular distention6 or liver enlargement. A single CVP measurement is not very useful and is not a good indicator of a positive response to fluids; an increase in CVP without a concurrent increase in cardiac output is not only useless but also harmful, because it will lead to increased edema formation.
Access to Blood in Superior Vena Cava
Measuring the central venous oxygen saturation (ScvO2) is a surrogate for measurement of the true mixed venous oxygen saturation ( ). Although absolute values of ScvO2 are not identical to single
  values, trends in ScvO2 over time follow the same pattern as trends in
  , making ScvO2 a useful measure in patients who do not require an arterial catheter.7 ScvO2 can be obtained either intermittently (by withdrawal of blood samples) or continuously (with the use of a catheter equipped with fiberoptic fibers).
Access
The central venous catheter generally is introduced via the internal jugular vein; the subclavian vein also can be used, although the risk of pneumothorax may be somewhat higher with this route. Peripherally inserted central catheters can also be placed, via the cephalic vein, basilic vein, or brachial vein. Introduction of a femoral catheter through the abdominal inferior vena cava to the right atrium can also yield reliable CVP measurements.8 The use of femoral catheters, however, is associated with a greater risk of infections and thrombophlebitis.9
Complications
Catheter-related infections constitute the major long-term complication. Adherence to basic hygiene guidelines can decrease the incidence of catheter-related sepsis. Triple-lumen catheters may be associated with a higher incidence of catheter-related infection,10 primarily as a result of increased catheter manipulation. The use of antimicrobial-coated catheters may decrease the risk of infections,11 but fears remain about the risks of development of resistant organisms.12 Routine replacement of catheters after 3 to 7 days is not recommended.13
Pulmonary Artery Catheters
What Do They Offer?
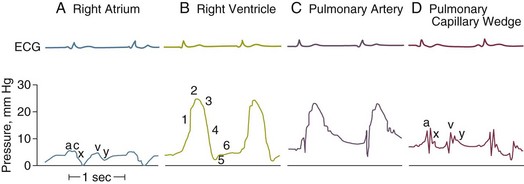
PACs allow collection of data on right atrial, pulmonary artery, and pulmonary artery occlusive pressures (Fig. 4.3); flow (cardiac output); and oxygenation ( ).
).
Pressures
Right Atrial Pressure
As indicated earlier, the RAP is identical to the CVP in the vast majority of cases.
Pulmonary Artery Occlusion Pressure
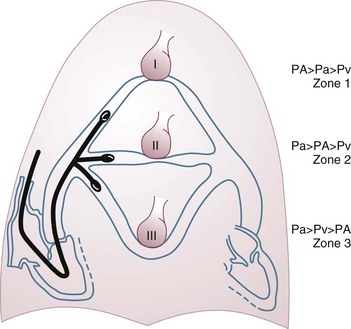
A first question is whether the PAOP reflects the pressure in the pulmonary veins and not the alveolar pressure. The tip of the catheter should be in a West zone III position, where a continuous column of blood exists between the catheter tip and the left atrium (Fig. 4.4). These considerations are less important with fluid optimization and with today’s lower positive end-expiratory pressures (PEEPs).
One method of combating this problem could be to subtract the esophageal pressure from the measured PAOP, but this approach has a number of technological limitations. Simple disconnection of the respirator to measure PAOP after obtaining an equilibration state is not recommended, because the measured PAOP will not represent the real value when PEEP is applied. A better method consists of measuring the lowest (nadir) PAOP, within seconds after a very transient disconnection from the ventilator, to identify the true transmural pressure before a new equilibrium is reached.14 Such a maneuver suppresses the high intrathoracic pressure and eliminates the influence of the extramural pressure, but the values obtained may not be valid in the presence of intrinsic PEEP. Other methods have been suggested, some relatively sophisticated15 and others more simple, involving subtraction of approximately one third of the PEEP level from the measured PAOP, for example. The question is whether this is really so important, because absolute PAOP values are not very helpful.
PAOP may not adequately reflect LV end-diastolic pressure. It may be lower in patients with aortic regurgitation or higher in the presence of significant tachycardia or mitral valve disease. LV end-diastolic pressure may not even accurately predict LV end-diastolic volume. This was already demonstrated many years ago with radionuclide techniques.16 Preload is more directly defined as the end-diastolic volume. A stiff, noncompliant ventricle can result in a relatively high end-diastolic pressure for a given end-diastolic volume. An evaluation of end-diastolic volumes can be obtained less invasively with echocardiographic techniques. Likewise, the use of transthoracic thermodilution techniques allows the estimation of intrathoracic blood volume and global end-diastolic volumes. However, these assessments of end-diastolic volumes do not give additional information about the likelihood of fluid responsiveness.
In sum, then, a given level of cardiac filling pressures does not provide much information about fluid responsiveness, but monitoring can be very helpful to guide a fluid challenge.17 During fluid administration, the goal is to obtain a significant increase in cardiac output (by the Frank-Starling mechanism), with the least increment in cardiac filling pressures, in order to minimize the risk of edema formation. The goal is not to keep the cardiac filling pressures within predefined arbitrary limits; rather, PAOP is a direct determinant of edema formation in the lungs. The key principle is to keep the PAOP as low as possible, provided that all of the other organs are happy.
Right Ventricular Volumes
The use of a modified PAC equipped with a fast response thermistor also allows evaluation of the right ventricular ejection fraction (RVEF) (Fig. 4.5). With knowledge of the stroke volume, it becomes easy to calculate the end-systolic and end-diastolic volumes. This measurement can be particularly useful in the presence of RV failure, but this also is a situation in which the measurement is least reliable: tricuspid regurgitation secondary to pulmonary hypertension.
Mixed Venous Oxygen Saturation
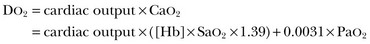
 represents the balance between oxygen consumption and oxygen supply. According to the Fick equation:

where VO2 is oxygen uptake and CaO2 and CvO2 are the arterial and mixed venous oxygen content, respectively. If the dissolved oxygen in the blood is neglected for the purposes of calculation, then

and

where Hb is hemoglobin.
 can reflect either a decrease in Sa
 can be measured continuously using catheters equipped with fiberoptic fibers, and measurements are helpful to guide therapy. ScvO2 has been proposed as a surrogate for
  , but the relationship between ScvO2 and
  is rather vague. Indeed, the ScvO2 is lower than
  in healthy conditions (as a result of the low O2 extraction by the kidneys) but is higher than
  in critically ill patients (because of relative increase in O2 extraction in the kidneys and in the gut).18 Moreover, O2 extraction is high in the coronary circulation, and this is missed in the measurement of ScvO2.
Derived Variables
Resistance.
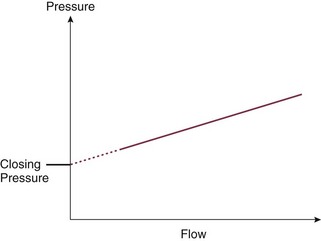
In steady-flow conditions, Ohm’s law indicates that resistance is the ratio between the pressure drop and the flow in the system. In the pulmonary circulation, the inflow pressure would be the mean PAP and the outflow pressure would be PAOP; for the systemic circulation, these would be the MAP and the CVP, respectively. In either case, flow would be cardiac output. This approach is limited, however, by the fact that the extrapolated intercept of the PAP–cardiac output relationship represents the average closing pressure of the small pulmonary arterioles, and the slope represents the upstream arterial resistance. Accordingly, the increased PAP in pulmonary hypertension can be explained by both an increase in pulmonary vascular closing pressure and an increase in vascular tone, and pulmonary vascular resistance (PVR) is not a good reflection of vasomotor tone in the pulmonary vasculature. Pulmonary hemodynamics are therefore best assessed by altering blood flow to better evaluate this relationship (Fig. 4.6).

Oxygen-Derived Variables.
Calculations of this variable benefit from combining measurements of cardiac output, Hb, and SaO2 but have the limitation that the corresponding oxygen demand is unknown. Some studies suggested that maintaining supranormal DO2 in the perioperative period or early after trauma may result in better outcomes.

where  is calculated in the same way as for CaO2, using the SvO2 instead of the SaO2.
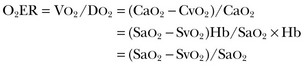
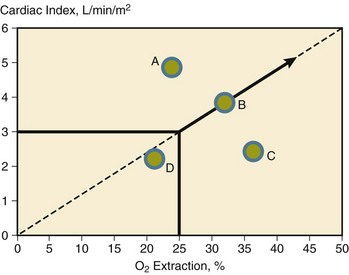
Accordingly, when SaO2 is close to 100%, in the absence of hypoxemia, O2ER mirrors SvO2. Its calculation can be useful in the presence of hypoxemia, when SaO2 is decreased. Also, the relationship between cardiac output and O2ER can be helpful to compare the central and the peripheral components of oxygen delivery (Fig. 4.7). This relationship is independent of Hb, so it can be helpful in evaluating the cardiovascular status in the presence of anemia.19
Venous Admixture.
Venous admixture can be calculated by the Berggren equation:
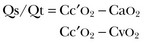
in which Qs is shunt flow, Qt is total pulmonary blood flow, and Cc′O2 represents the capillary oxygen content (assuming an oxygen saturation of 100%). This may help to assess the effects of various interventions (PEEP or other respiratory conditions, administration of vasoactive agents) on pulmonary hemodynamics.
Complications
Complications of pulmonary artery catheterization can be divided into seven categories as listed in Box 4.1. Many of these can be prevented, and most are relatively uncommon.
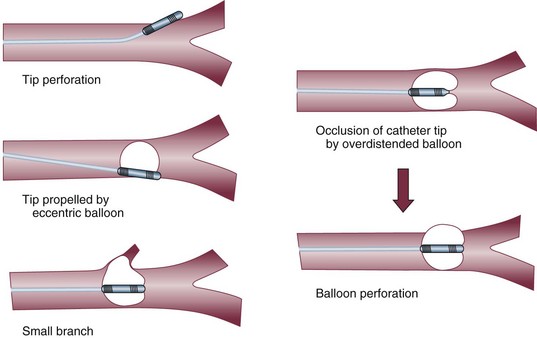
Pulmonary artery rupture is the most feared complication: Although it is exceptionally rare, it is associated with a high mortality rate. The usual cause is overinflating the balloon in the presence of resistance to inflation, particularly in the presence of preexisting PAH; other, less common causes are shown in Figure 4.8. The cardinal sign of rupture is the development of hemoptysis. The reaction to this event should not be to pull out the catheter entirely, but rather to withdraw it slightly and then inflate the balloon. If the hemorrhage does not stop, a thoracotomy may be necessary to repair the pulmonary artery.
Technical Limitations
Three steps must be followed to guarantee reliable measurements:
1. The first step is appropriate zeroing, which is accomplished by opening the transducer to atmospheric pressure (taken as the zero value). All pressures must be measured with reference to an arbitrary reference point. This zero reference pressure level should ideally be where it is least influenced by location on the body. In humans, it is thought to be at the level of the right atrium, so the reference level usually is placed in the midchest (midaxillary) position at the level of the fourth intercostal space. In healthy persons, the CVP referred to that region does not change with supine versus upright position. An alternative reference is 5 cm vertically below the sternal angle. Obviously, errors in zeroing are relatively more important for measurements of cardiac filling pressures than for arterial pressure measurements, because the errors are quantitatively identical but proportionally greater.
2. The second step is calibration, which is now done automatically by today’s electronic systems.
3. The third step is ensuring the good quality of the trace. Shaking the catheter should result in large pressure variations on the screen. A damped system will underestimate systolic pressures. The liquid column should be continuous, without air bubbles in the system. Excessive tubing length, or multiple stopcocks and connectors, may decrease the resonant frequency, resulting in “whipped” traces. Likewise, the presence of bubbles must be carefully avoided. Transient flushing should be followed by an abrupt return of the pressure trace to its actual value.
Applications: Diagnosis Versus Monitoring
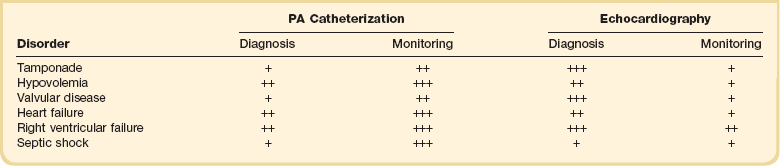
Today the PAC is more useful in guiding therapy rather than in identifying abnormalities, this latter role having largely been taken over by noninvasive, mainly echocardiographic techniques (Table 4.1). In the past, analysis of waveforms was used—for example, the abnormal v waves of mitral regurgitation. Likewise, an increase of all pressures to identical levels should suggest pericardial tamponade. These findings should still alert the clinician to possible abnormalities, but echocardiographic techniques have largely replaced the use of the PAC for identifying valvular disease. The use of echocardiographic techniques for monitoring, however, is hampered by the difficulty of keeping the probe in the esophagus for prolonged periods of time, and results are very operator dependent.
• Interpretation of a cardiac output value: It is important to consider the four determinants of cardiac output (Fig. 4.9).20 Interpretation should start by considering the stroke volume (cardiac output divided by heart rate) and relating this to an index of ventricular filling (PAOP) and an index of ventricular afterload (arterial and pulmonary artery pressures); an inotropic agent should be added only when preload and afterload have been optimized.
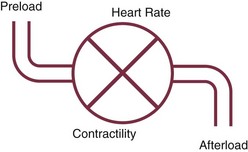
Figure 4.9 The four determinants of cardiac output.
• Fluid status: Low cardiac filling pressures may be normal or reflect hypovolemia. The measurement of cardiac output and  will help determine fluid needs. Indeed, hypovolemia typically is associated with a low cardiac output and a low
  (Fig. 4.10). By contrast, hypervolemia in the presence of normal cardiac function will be manifested by high cardiac filling pressures associated with a relatively high cardiac output and normal or high
  .
.
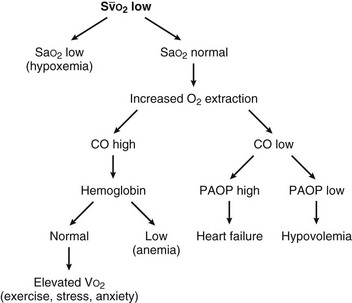
 (mixed venous oxygen saturation). CO, cardiac output; PAOP, pulmonary artery occlusion pressure; Sa
• Hemodynamic versus nonhemodynamic pulmonary edema: The distinction between hemodynamic and nonhemodynamic types of lung edema no longer requires pulmonary artery catheterization; the clinical history and less invasive (e.g., echocardiographic) measurements usually are sufficient to separate the two. Nevertheless, invasive hemodynamic monitoring can reveal that patients thought to meet only the acute lung injury/acute respiratory distress syndrome (ALI/ARDS) criteria sometimes have unexpectedly high PAOP.21
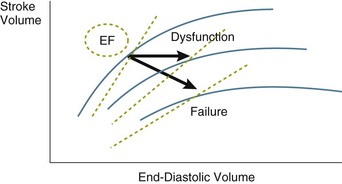
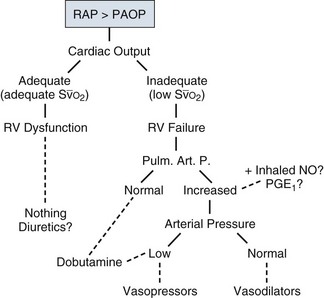
• RV dysfunction versus failure: A reverse gradient between RAP and PAOP (i.e., a higher RAP than PAOP) indicates RV dysfunction or failure and usually is secondary to pulmonary hypertension, as will be immediately apparent from the measurements of pulmonary artery pressures. RV dysfunction is manifested by RV dilation (and thus a decrease in RVEF) with no limitation on cardiac output. This is the most common situation in patients with ARDS, who usually maintain a hyperkinetic state. Rather, RV failure refers to a state in which cardiac output is no longer sustained at adequate levels.22 These different entities are illustrated in Figure 4.11.
 , mixed venous oxygen saturation.
• LV dysfunction versus failure: Here the gradient between PAOP and RAP will be higher than the typical 3 to 5 mm Hg. As with the right ventricle, in LV dysfunction the ventricular volumes may increase (so the ejection fraction will decrease), but the cardiac output may be simultaneously preserved; such a situation may exist in septic shock. LV failure is more common and is manifested by a decrease in cardiac output and  .
.
Assessing Effects of Interventions
The PAC can be used to monitor the effectiveness of various interventions:
• Fluid challenge: A fluid challenge technique is indicated whenever the benefit of fluid administration is in doubt.17 Ideally, fluid administration will result in increases in cardiac output and tissue perfusion without major increases in cardiac filling. An increase in PAOP in the absence of a significant change in cardiac output and  indicates that fluid administration will only result in an increased risk of edema and should be discontinued.
• Inotropic agents: The use of inotropes aims to increase cardiac output and possibly decrease PAOP. Lack of an increase in cardiac output after administration of a β1-adrenergic inotropic agent indicates a desensitization of the β-adrenergic receptors and is associated with a worse prognosis.23
• Vasopressors: The use of pure vasoconstrictors is expected to increase arterial pressure but also cardiac filling pressures. An excessive increase in cardiac filling pressures with use of such an agent suggests the need for addition of an inotropic agent (e.g., dobutamine).
• Vasodilators: The administration of vasodilators may rapidly reduce arterial pressure so that continuous arterial pressure monitoring is usually indicated. Moreover, a reduction in vascular tone in the presence of hypovolemia may reduce venous return and thus cardiac output.
Clinical Indications for Pulmonary Artery Catheter Insertion
• Severe circulatory shock: The PAC can be used to help guide fluid challenges and titrate inotropic agents. Shock due to hypovolemia (as in polytrauma or with other forms of massive bleeding) does not require insertion of a PAC, because management of such patients generally is quite straightforward.
• RV failure: The PAC can be used to monitor pulmonary artery pressures, the gradient between RAP and PAOP, cardiac output, and  .
.
• Acute respiratory failure due to pulmonary edema: Whether lung edema is hemodynamic or nonhemodynamic, the strategy should be to keep the hydrostatic pressures as low as possible, but this requires measurements of cardiac output and  to make sure the systemic circulation is not compromised.
• Complex fluid management in the presence of impending renal failure: Sometimes it is difficult to evaluate the fluid status in oliguric patients, in whom hypovolemia may compromise renal function but hypervolemia obviously must be avoided.
• Dynamic assessment of cardiac function in specific conditions: The best example is that of the patient who is difficult to wean from mechanical ventilation, possibly owing in part to cardiac dysfunction.
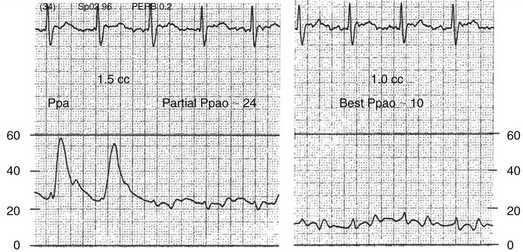
Pulmonary Artery Occlusion Pressure and Partial Occlusion
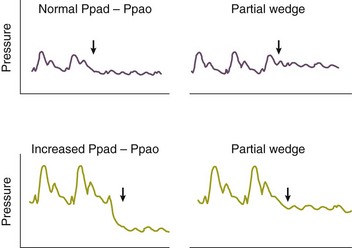
Partial occlusion of the pulmonary artery in the presence of pulmonary hypertension may be difficult to recognize and can lead to significant overestimation of the PAOP, denoted Ppao on Figure 4.12. A useful clue to partial occlusion is occurrence of a substantial increase in the PAOP without a concomitant change in the pulmonary artery diastolic pressure, denoted Ppad on the figure. If the Ppad – PAOP gradient is normal and the underlying disease process would predict increased PVR, partial occlusion should be suspected. Partial occlusion may occur if a catheter is either too proximal or too distal in the pulmonary artery, and appropriate repositioning may be corrective. The best PAOP may be obtained in some circumstances by further advancing the catheter with the balloon fully inflated and at other times by retracting the catheter to the original pulmonary artery position and attempting to occlude with 1.0 to 1.2 mL of air, instead of full inflation. It is imperative never to inflate against resistance. Figures 4.12 and 4.13 offer further information on diagnosis and management of partial occlusion.
Does the Use of a Pulmonary Artery Catheter Improve Outcome?
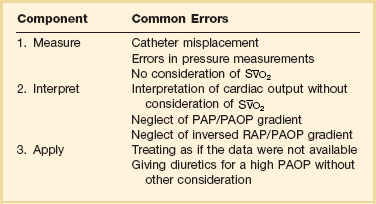
The use of the PAC has been challenged on the basis that it has not been shown to improve outcomes.21,24–26 An improvement in outcome, however, has not been demonstrated with other monitoring techniques either. Moreover, a number of studies have indicated that the use of the PAC can influence therapy.27 If use of a PAC does not result in better outcomes, important and challenging questions arise about the beneficial effects of many therapeutic interventions in the ICU. Some evidence suggests that the use of the PAC may improve outcomes in the most severely ill subsets of critically ill patients.28,29 Errors in measurements from the PAC were identified many years ago,30 and another consideration is the considerable interobserver variability in interpretation of PAC tracings.31 Clearly, not all ICU patients need a PAC and insertion should be reserved for complex cases.32 If a PAC is considered necessary, it is important to respect the three successive steps (Table 4.2): to take adequate and full measurements; to interpret the results correctly; and to apply the gathered information for the patient’s benefit. Unfortunately, potential errors are associated with each step. Some of these issues can be addressed with better teaching and improved basic knowledge of hemodynamics and basic physiology.
Key Points
 , mixed venous oxygen saturation.
• No simple guidelines for monitoring are available or applicable in all cases; monitoring should be tailored to each patient’s needs.
• Each variable, taken individually, has limitations and is subject to error and difficulty in interpretation. Variables should be combined and integrated to provide a global picture of the clinical situation.
• A monitoring technique cannot improve outcome by itself; each of the three components of monitoring is important with any monitoring technique:
• Cardiac output is an adaptive value that must constantly adjust to the oxygen requirements of the organs.
• Separation of the four determinants of cardiac output—heart rate, contractility, preload, and afterload—is useful to consider the various interventions that can be used to increase it.
• Measurements of mixed venous oxygen saturation are essential to interpret cardiac output measurements.
• The relationship between cardiac filling pressures and volumes is relatively weak. Pressure measurements are important, however, because pressures (rather than volumes) are the primary determinant of edema formation.
• The calculation of derived variables, such as vascular resistances, ventricular work, and oxygen-derived variables, is of limited usefulness.
References
1. Bur, A, Hirschl, MM, Herkner, H, et al. Accuracy of oscillometric blood pressure measurement according to the relation between cuff size and upper-arm circumference in critically ill patients. Crit Care Med. 2000; 28:371–376.
2. Magder, S. Hemodynamic monitoring in the mechanically ventilated patient. Curr Opin Crit Care. 2011; 17:36–42.
3. Heenen, S, De Backer, D, Vincent, JL. How can the response to volume expansion in patients with spontaneous respiratory movements be predicted? Crit Care. 2006; 10:R102.
4. Lorente, L, Santacreu, R, Martin, MM, et al. Arterial catheter-related infection of 2,949 catheters. Crit Care. 2006; 10:R83.
5. Martin, C, Saux, P, Papazian, L, et al. Long-term arterial cannulation in ICU patients using the radial artery or dorsalis pedis artery. Chest. 2001; 119:901–906.
6. Cook, DJ, Simel, DL. The rational clinical examination. Does this patient have abnormal central venous pressure? JAMA. 1996; 275:630–634.
7. Rivers, E, Anders, DS, Powell, D, et al. Central venous oxygen saturation monitoring in the critically ill patient. Curr Opin Crit Care. 2001; 7:204–211.
8. Joynt, GM, Gomersall, CD, Buckley, TA, et al. Comparison of intrathoracic and intra-abdominal measurements of central venous pressure. Lancet. 1996; 347:1155–1157.
9. Merrer, J, De Jonghe, B, Golliot, F, et al. Complications of femoral and subclavian venous catheterization in critically ill patients: A randomized controlled trial. JAMA. 2001; 286:700–707.
10. Zurcher, M, Tramer, MR, Walder, B. Colonization and bloodstream infection with single versus multilumen central venous catheters: A quantitative systematic review. Anesth Analg. 2004; 99:177–182.
11. Darouiche, RO, Raad, II., Heard, SO, et al. A comparison of two antimicrobial-impregnated central venous catheters. Catheter Study Group. N Engl J Med. 1999; 340:1–8.
12. Tambe, SM, Sampath, L, Modak, SM. In vitro evaluation of the risk of developing bacterial resistance to antiseptics and antibiotics used in medical devices. J Antimicrob Chemother. 2001; 47:589–598.
13. O’Grady, NP, Alexander, M, Burns, NA, et al. Guidelines for the prevention of intravascular catheter-related infections. Clin Infect Dis. 2011; 52:e162–e193.
14. Pinsky, MR, Vincent, JL, De Smet, JM. Estimating left ventricular filling pressure during positive end-expiratory pressure in humans. Am Rev Respir Dis. 1991; 143:25–31.
15. Teboul, JL, Pinsky, MR, Mercat, A, et al. Estimating cardiac filling pressure in mechanically ventilated patients with hyperinflation. Crit Care Med. 2000; 28:3631–3636.
16. Calvin, JE, Driedger, AA, Sibbald, WJ. Does the pulmonary capillary wedge pressure predict left ventricular preload in critically ill patients? Crit Care Med. 1981; 9:437–443.
17. Vincent, JL, Weil, MH. Fluid challenge revisited. Crit Care Med. 2006; 34:1333–1337.
18. Varpula, M, Karlsson, S, Ruokonen, E, et al. Mixed venous oxygen saturation cannot be estimated by central venous oxygen saturation in septic shock. Intensive Care Med. 2006; 32:1336–1343.
19. Yalavatti, GS, De Backer, D, Vincent, JL. The assessment of cardiac index in anemic patients. Chest. 2000; 118:782–787.
20. Vincent, JL. Understanding cardiac output. Crit Care. 2008; 12:174.
21. Wheeler, AP, Bernard, GR, Thompson, BT, et al. Pulmonary-artery versus central venous catheter to guide treatment of acute lung injury. N Engl J Med. 2006; 354:2213–2224.
22. Vincent, JL. Is ARDS usually associated with right ventricular dysfunction or failure? Intensive Care Med. 1995; 21:195–196.
23. Rhodes, A, Lamb, FJ, Malagon, I, et al. A prospective study of the use of a dobutamine stress test to identify outcome in patients with sepsis, severe sepsis, or septic shock. Crit Care Med. 1999; 27:2361–2366.
24. Sakr, Y, Vincent, JL, Reinhart, K, et al. Use of the pulmonary artery catheter is not associated with worse outcome in the intensive care unit. Chest. 2005; 128:2722–2731.
25. Harvey, S, Harrison, DA, Singer, M, et al. Assessment of the clinical effectiveness of pulmonary artery catheters in management of patients in intensive care (PAC-Man): A randomised controlled trial. Lancet. 2005; 366:472–477.
26. Rhodes, A, Cusack, RJ, Newman, PJ, et al. A randomised, controlled trial of the pulmonary artery catheter in critically ill patients. Intensive Care Med. 2002; 28:256–264.
27. Mimoz, O, Rauss, A, Rekik, N, et al. Pulmonary artery catheterization in critically ill patients: A prospective analysis of outcome changes associated with catheter-prompted changes in therapy. Crit Care Med. 1994; 22:573–579.
28. Chittock, DR, Dhingra, VK, Ronco, JJ, et al. Severity of illness and risk of death associated with pulmonary artery catheter use. Crit Care Med. 2004; 32:911–915.
29. Friese, RS, Shafi, S, Gentilello, LM. Pulmonary artery catheter use is associated with reduced mortality in severely injured patients: A National Trauma Data Bank analysis of 53,312 patients. Crit Care Med. 2006; 34:1597–1601.
30. Morris, AH, Chapman, RH, Gardner, RM. Frequency of wedge pressure errors in the ICU. Crit Care Med. 1985; 13:705–708.
31. Al Kharrat, T, Zarich, S, Amoateng-Adjepong, Y, et al. Analysis of observer variability in measurement of pulmonary artery occlusion pressures. Am J Respir Crit Care Med. 1999; 160:415–420.
32. Vincent, JL, Rhodes, A, Perel, A, et al. Update on hemodynamic monitoring: A consensus of 16. Crit Care. 2011; 15:229.
[/level-membership-for-critical-care-medicine-category][not-level-membership-for-critical-care-medicine-category]4
Arterial, Central Venous, and Pulmonary Artery Catheters
Arterial Catheters
What Do They Offer?
Arterial Pressure Measurement
The optimal range of arterial pressure depends on individual patient characteristics, on underlying diseases, and also on treatment. Hence, it is impossible to give an optimal range of arterial pressure that is applicable in all patients. When arterial pressure needs to be evaluated accurately, oscillometric measurements become unreliable,1 and insertion of an arterial catheter is indicated.
1. Hypotensive states associated with (a risk of) altered tissue perfusion. Hypotension that is resistant to fluid administration requires the administration of vasopressor agents, and invasive measurement of arterial pressure is then necessary to titrate this form of therapy. Norepinephrine is the vasopressor agent most commonly used in this setting. A mean arterial pressure (MAP) of 65 to 70 mm Hg is usually targeted, but this level must be adapted to the individual patient and the clinical scenario; in particular, elderly patients with atherosclerotic disease may require higher levels than younger individuals with normal arteries.
2. Intravenous vasodilator therapy. Vasodilating therapy (e.g., nitrates and hydralazine) is a mainstay in the management of heart failure, because it can increase cardiac output. Close monitoring of arterial pressure is essential to avoid excessive hypotension.
3. Severely hypertensive states. Extreme hypertension may result in organ impairment, especially of the brain and the heart. Sodium nitroprusside or calcium entry blockers usually are used to lower arterial pressure, and careful, accurate monitoring is essential to titrate the antihypertensive therapy.
4. Induction of hypertension. Hypertension is sometimes induced in patients with neurologic diseases. Severe cerebral edema with intracranial hypertension, in particular, requires vasopressor support to maintain cerebral perfusion pressure (the gradient between the MAP and the intracranial pressure); likewise, hypertension may be used to treat or prevent the development of vasospasm secondary to subarachnoid hemorrhage, as part of the so-called triple-H therapy (hypertension, hypervolemia, hemodilution). Norepinephrine usually is used for this purpose.
Fluid Responsiveness
Variations in arterial pressure during positive-pressure ventilation have been used as a measure of fluid responsiveness. The transient increases in intrathoracic pressure influence venous return in patients who are likely to respond to fluid administration. This fluctuation in ventricular filling will translate into fluctuations in arterial pressure a few beats later. Accordingly, the greater the degree of systolic arterial pressure, or pulse pressure, variation during the respiratory cycle, the greater will be the increase in cardiac output in response to fluid administration (Fig. 4.1). However, this observation is valid primarily in patients without spontaneous respiratory movements and without significant arrhythmias, and only when a sufficient tidal volume is applied.2,3
Access
For placement of arterial catheters, usually the radial artery is used. The femoral artery can be easily cannulated and gives a better signal, but presence of a femoral catheter interferes more with patient mobility and warrants concern about infection.4 Use of other sites, such as the brachial or the axillary artery or even the dorsalis pedis artery,5 can be considered. An important point to keep in mind is that the pulse pressure increases from the core to the periphery. In other words, the systolic pressure is overestimated in smaller arteries (Fig. 4.2). Hence, it may be better to rely more on mean values than on systolic or diastolic pressures.
Central Venous Catheters
What Do They Offer?
Measurement of Central Venous Pressure
Clinically, CVP can be assessed by evaluation of the degree of jugular distention6 or liver enlargement. A single CVP measurement is not very useful and is not a good indicator of a positive response to fluids; an increase in CVP without a concurrent increase in cardiac output is not only useless but also harmful, because it will lead to increased edema formation.
Access to Blood in Superior Vena Cava
Measuring the central venous oxygen saturation (ScvO2) is a surrogate for measurement of the true mixed venous oxygen saturation (). Although absolute values of ScvO2 are not identical to single values, trends in ScvO2 over time follow the same pattern as trends in , making ScvO2 a useful measure in patients who do not require an arterial catheter.7 ScvO2 can be obtained either intermittently (by withdrawal of blood samples) or continuously (with the use of a catheter equipped with fiberoptic fibers).
Access
The central venous catheter generally is introduced via the internal jugular vein; the subclavian vein also can be used, although the risk of pneumothorax may be somewhat higher with this route. Peripherally inserted central catheters can also be placed, via the cephalic vein, basilic vein, or brachial vein. Introduction of a femoral catheter through the abdominal inferior vena cava to the right atrium can also yield reliable CVP measurements.8 The use of femoral catheters, however, is associated with a greater risk of infections and thrombophlebitis.9
Complications
Catheter-related infections constitute the major long-term complication. Adherence to basic hygiene guidelines can decrease the incidence of catheter-related sepsis. Triple-lumen catheters may be associated with a higher incidence of catheter-related infection,10 primarily as a result of increased catheter manipulation. The use of antimicrobial-coated catheters may decrease the risk of infections,11 but fears remain about the risks of development of resistant organisms.12 Routine replacement of catheters after 3 to 7 days is not recommended.13
Pulmonary Artery Catheters
What Do They Offer?
PACs allow collection of data on right atrial, pulmonary artery, and pulmonary artery occlusive pressures (Fig. 4.3); flow (cardiac output); and oxygenation ().
Pressures
Right Atrial Pressure
As indicated earlier, the RAP is identical to the CVP in the vast majority of cases.
Pulmonary Artery Occlusion Pressure
A first question is whether the PAOP reflects the pressure in the pulmonary veins and not the alveolar pressure. The tip of the catheter should be in a West zone III position, where a continuous column of blood exists between the catheter tip and the left atrium (Fig. 4.4). These considerations are less important with fluid optimization and with today’s lower positive end-expiratory pressures (PEEPs).
[/not-level-membership-for-critical-care-medicine-category]
