45 Arterial Blood Gas Interpretation
Arterial blood gas (ABG) analysis plays a pivotal role in the management of critically ill patients. Although no randomized controlled study has ever been performed evaluating the benefit of ABG analysis in the intensive care unit (ICU), it is likely this technology stands alone as the diagnostic test which has had the greatest impact on the management of critically ill patients; this has likely been translated into improved outcomes. Prior to the 1960s, clinicians were unable to detect hypoxemia until clinical cyanosis developed. ABG analysis became available in the late 1950s when techniques developed by Clark, Stow and coworkers, and Severinghaus and Bradley permitted measurement of the partial pressures of oxygen (PaO2) and carbon dioxide (PaCO2) in arterial blood.1–3 The ABG remains the definitive method to diagnose, categorize, and quantitate respiratory failure. In addition, ABG analysis is the only clinically applicable method of assessing a patient’s acid-base status. ABGs are the most frequently ordered test in the ICU and have become essential to the management of critically ill patients.4 Indeed, a defining requirement of an ICU is that a clinical laboratory should be available on a 24-hour basis to provide blood gas analysis.5
 Indications for Arterial Blood Gas Sampling
ABGs are reported to be the most frequently performed test in the ICU.4 There are, however, no published guidelines and few clinical studies that provide guidance as to the indications for ABG sampling.6 It is likely that many ABGs are performed unnecessarily. Muakkassa and coworkers studied the relationship between the presence of an arterial line and ABG sampling.7 These authors demonstrated that patients with an arterial line had more ABGs drawn than those who did not, regardless of the value of the PaO2, PaCO2, the Acute Physiology and Chronic Health Evaluation (APACHE) II score, or the use of a ventilator. In that study, multivariate analysis demonstrated that the presence of an arterial line was the most powerful predictor of the number of ABGs drawn per patient independent of all other measures of the patient’s clinical status. Roberts and Ostryznuik demonstrated that with use of a protocol they were able to reduce the number of ABGs by 44%, with no negative effects on patient outcomes.4
 Arterial Blood Gas Sampling
ABG specimens may be obtained from an indwelling arterial catheter or by direct arterial puncture using a heparinized 1- to 5-mL syringe. Indwelling arterial catheters should generally not be placed for the sole purpose of ABG sampling, as they are associated with rare but serious complications. Arterial puncture is usually performed at the radial site. When a radial pulse is not palpable, the brachial or femoral arteries are suitable alternatives. Serious complications from arterial puncture are uncommon; the most common include pain and hematoma formation at the puncture site. Laceration of the artery (with bleeding), thrombosis, and aneurismal formation are rare but serious complications.8,9
 Arterial Blood Gas Analysis
Oxygenation
Relation Between PaO2 and FIO2
The PaO2 alone provides little information regarding the efficiency of oxygen loading into the pulmonary capillary blood. The PaO2 is determined largely by the FIO2 and the degree of intrapulmonary shunting (Figure 45-1). The PaO2 must therefore always be interpreted in conjunction with the FIO2. The PaO2 alone does not quantitate the degree of intrapulmonary shunt, which is required for assessing the severity of the underlying lung disease and in guiding the approach to oxygen therapy and respiratory support. There are various formulas for calculating the intrapulmonary shunt, including the classic “shunt equation,” which is the gold standard but requires mixed venous sampling through a pulmonary artery catheter, and the alveolar-arterial oxygen gradient equation (Table 45-1). Clinically the PaO2-to-FIO2 ratio (PaO2/FIO2) is most commonly used to quantitate the degree of ventilation/perfusion mismatching (V/Q). Since the normal PaO2 in an adult breathing room air with an FIO2 of 0.21 is 80 to 100 mm Hg, the normal value for PaO2/FIO2 is between 400 and 500 mm Hg. A PaO2/FIO2 ratio of less than 200 most often indicates a shunt of greater than 20%. A notable limitation of the PaO2/FIO2 is that it does not take into account changes in PaCO2 at a low FIO2, which tends to have a considerable effect on the ratio.
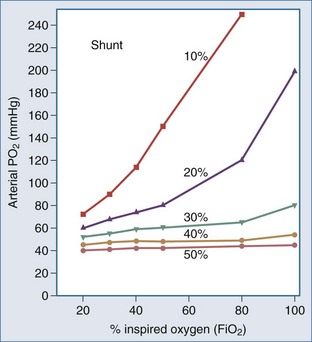
TABLE 45-1 Formulas for Evaluating Patients in Respiratory Failure
Age
The normal arterial oxygen tension decreases with age (see Table 45-1). The normal PaO2 at sea level and breathing room air is approximately 85 to 90 mm Hg at the age of 60 and 80 to 85 mm Hg at the age of 80 years.
The PaO2 is primarily used for assessment of oxygenation status, since PaO2 accurately assesses arterial oxygenation from 30 to 200 mm Hg, whereas SaO2 is normally a reliable predictor of PaO2 only in the range of 30 to 60 mm Hg. However, oxygen saturation as measured by pulse oximetry (SpO2) or by ABG analysis (SaO2) is a better indicator of arterial oxygen content than PaO2, since approximately 98% of oxygen is carried in blood combined with Hb. Hypoxemia is defined as a PaO2 of less than 80 mm Hg at sea level in an adult patient breathing room air; the concomitant decrease in cell/tissue oxygen tension is known as hypoxia (or tissue hypoxia). The degree of hypoxia in patients with hypoxemia depends on the severity of the hypoxemia and the ability of the cardiovascular system to compensate. Hypoxia is unlikely in mild hypoxemia (PaO2 = 60-79 mm Hg). Moderate hypoxemia (PaO2 = 45-59 mm Hg) may be associated with hypoxia in patients with anemia or cardiovascular dysfunction. Hypoxia is almost always (but with a few exceptions) associated with severe hypoxemia (PaO2 <45 mm Hg). However, it must be recognized that the human body has an extraordinary capacity to adapt to hypoxemia. Indeed, patients with cyanotic heart disease do not have evidence of tissue hypoxia at rest. Most remarkably, at the top of Mount Everest (29,028 ft; 253 torr) and without supplemental oxygen, experienced mountain climbers have been reported to have a mean PaO2 of between 24 and 28 mm Hg in the absence of tissue hypoxia.12,13
Acid-Base Balance
The history of assessing the acid-base equilibrium and associated disorders is intertwined with the evolution of the definition of an acid. In the 1950s, clinical chemists combined the Henderson-Hasselbalch equation and the Brønsted-Lowry definition of an acid to produce the current bicarbonate ion–centered approach to metabolic acid-base disorders.14 Stewart repackaged pre-1950 ideas of acid-base in the late 1970s, including the Van Slyke definition of an acid.15 Stewart also used laws of physical chemistry to produce a new acid-base approach.14 This approach, using the strong ion difference (SID) and the concentration of weak acids (particularly albumin), pushes bicarbonate into a minor role as an acid-base indicator rather than as an important mechanism:

As the SID approaches zero, anions “accumulate” and acidity increases. This approach provides a physicochemical model for “hyperchloremic acidosis” following 0.9% saline administration,21 and the systemic alkalosis of hypoalbuminemia (regarded as a weak acid).
Most clinicians use the bicarbonate ion–centered approach for the diagnosis and management of acid-base disorders; this approach is easier to understand and more practical. Furthermore, there are no clinical data to suggest that the Steward approach has any advantages over the classic (bicarbonate) approach.16 The Henderson-Hasselbalch equation describes the fixed interrelationship between PaCO2, pH, and HCO3− being described as pH = pKc log HCO3−/dissCO2. If all the constants are removed, the equation can be simplified to pH = HCO3−/PaCO2 (∼Kidney/Lung). The HCO3− is controlled mainly by the kidney and blood buffers. The lungs control the level of PaCO2 by regulating the level of volatile acid, carbonic acid, in the blood. Buffer systems can act within a fraction of a second to prevent excessive change in pH. The respiratory system takes about 1 to 15 minutes and kidneys many minutes to days to readjust H+ ion concentration.
The Anion Gap
Following the principle of electrochemical neutrality, total [cations] must equal total [anions], and so in considering the commonly measured cations and anions and subtracting them, a fixed number should be derived. The measured cations are in excess; mathematically this “gap” is filled with unmeasured anions ensuring electrochemical neutrality. There is never a “real” AG, in line with the law of electrochemical neutrality; it is rather an index of nonroutinely measured anions. The anion gap is calculated using the following formula17:

Critical illness is typically associated with a rapid fall in the plasma albumin concentration. Albumin is an important contributor of the “normal” AG. Therefore, as the albumin concentration falls, it tends to reduce the size of the AG, or have an alkalinizing effect. Various corrections are available; however, Figge’s AG correction (AGcorr) is most commonly used17:


A Stepwise Approach to Acid-Base Disorders
Step 1: Do a Comprehensive History and Physical Exam
A comprehensive history and physical examination can often give clues as to the underlying acid-base disorder (Table 45-2). For example, patients who present with gastroenteritis manifested as diarrhea typically have a non–anion gap metabolic acidosis from loss of fluid containing HCO3−. Patients who present with chronic obstructive lung disease usually have underlying chronic respiratory acidosis from retention of CO2.
TABLE 45-2 Common Clinical States and Associated Acid-Base Disorders
| Clinical State | Acid-Base Disorder |
|---|---|
| Pulmonary embolus | Respiratory alkalosis |
| Hypotension/shock | Metabolic acidosis (lactic acidosis) |
| Severe sepsis | Metabolic acidosis, respiratory alkalosis |
| Vomiting | Metabolic alkalosis |
| Severe diarrhea | Metabolic acidosis |
| Renal failure | Metabolic acidosis |
| Cirrhosis | Respiratory alkalosis |
| Pregnancy | Respiratory alkalosis |
| Diuretic use | Metabolic alkalosis |
| COPD | Respiratory acidosis |
| Diabetes | Metabolic acidosis (ketoacidosis) |
| Ethylene glycol poisoning | Metabolic acidosis |
| Post normal saline resuscitation | Metabolic acidosis (non–anion gap) |
Step 2: Order Simultaneous Arterial Blood Gas Measurement and Chemistry Profile
Step 4: Identify the Primary Disturbance
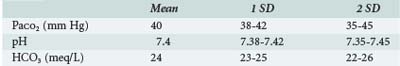
The next step is to determine whether the patient is acidemic (pH <7.35) or alkalemic (pH >7.45) and whether the primary process is metabolic (initiated by change in HCO3−) or respiratory (initiated by a change in PaCO2) (Table 45-4).
| Acid-Base Disorder | Criteria |
|---|---|
| Respiratory acidosis | PaCO2 >45 mm Hg |
| Respiratory alkalosis | PaCO2 <35 mm Hg |
| Acute respiratory failure | PaCO2 >45 mm Hg; pH < 7.35 |
| Chronic respiratory failure | PaCO2 >45 mm Hg; pH 7.36-7.44 |
| Acute respiratory alkalosis | PaCO2 <35 mm Hg; pH > 7.45 |
| Chronic respiratory alkalosis | PaCO2 <35 mm Hg; pH 7.36-7.44 |
| Acidemia | pH <7.35 |
| Alkalemia | pH >7.45 |
| Acidosis | HCO3 <22 mEq/L |
| Alkalosis | HCO3 >26 mEq/L |
Step 5: Calculate the Expected Compensation
Any alteration in acid-base equilibrium sets into motion a compensatory response by either the lungs or the kidneys. The compensatory response attempts to return the ratio between PaCO2 and HCO3− to normal and thereby normalize the pH. Compensation is predictable; the adaptive responses for the simple acid-base disorders have been quantified experimentally18 (Table 45-5). Determine whether the compensatory response is of the magnitude expected—that is, is there a secondary (uncompensated) acid-base disturbance?
TABLE 45-5 Compensation Formulas for Simple Acid-Base Disorders
| Acid-Base Disorder | Compensation Formula |
|---|---|
| Metabolic acidosis | Change in PaCO2 = 1.2 × change in HCO3− |
| Metabolic alkalosis | Change in PaCO2 = 0.6 × change in HCO3− |
| Acute respiratory acidosis | Change in HCO3− = 0.1 × change in PaCO2 |
| Chronic respiratory acidosis | Change in HCO3− = 0.35 × change in PaCO2 |
| Acute respiratory alkalosis | Change in HCO3− = 0.2 × change in PaCO2 |
| Chronic respiratory alkalosis | Change in HCO3− = 0.5 × change in PaCO2 |
Step 6. Calculate the “Gaps”
Calculate the Anion Gap


Common Acid Base Disturbances in the ICU
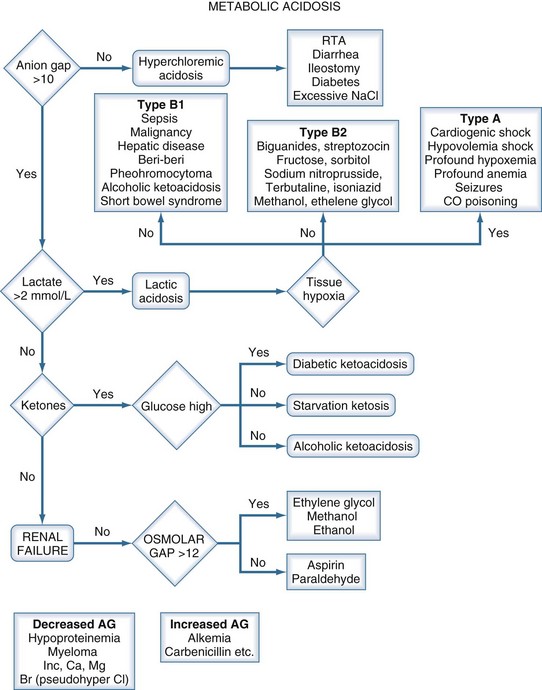
Metabolic Acidosis
A metabolic acidosis in the critically ill patient is an ominous sign and warrants an aggressive approach to the diagnosis and management of the cause(s) of the disorder (Figure 45-2 and Table 45-7). In the vast majority of patients the cause(s) of the metabolic acidosis are usually clinically obvious, with lactic acidosis (from tissue hypoxia/hypermetabolism), ketoacidosis, and renal failure being the most common causes. In patients with an unexplained AG, metabolic acidosis methanol or ethylene-glycol toxicity should always be considered.19 Accumulation of 5-oxoproline related to the use of acetaminophen is a rare cause of an anion-gap metabolic acidosis.20 Prolonged high-dose administration of lorazepam can result in the accumulation of the vehicle, propylene glycol, resulting in worsening renal function, metabolic acidosis, and altered mental status.21,22 Toxicity is typically observed after prolonged (>7 days), high-dose (average 14 mg/h), continuous lorazepam infusion and can be recognized by an increased osmolal gap.23 Similarly, prolonged high-dose propofol (>100 µg/kg/min) is rarely associated with the “propofol infusion syndrome” characterized by rhabdomyolysis, metabolic acidosis, and renal and cardiac failure.24
| Elevated Anion Gap |
The prognosis is related to the underlying disorder causing the acidosis. In almost all circumstances, the treatment of a metabolic acidosis involves treatment of the underlying disorder. Except in specific circumstances (outlined later), there is no scientific evidence to support treating a metabolic or respiratory acidosis with sodium bicarbonate.25 Furthermore, it is the intracellular pH which is of importance in determining cellular function. The intracellular buffering system is much more effective in restoring pH to normal than the extracellular buffers. Consequently, patients have tolerated a pH as low as 7.0 during sustained hypercapnia, without obvious adverse effects. Paradoxically, sodium bicarbonate can decrease intracellular pH (in circumstances where CO2 elimination is fixed). The infusion of bicarbonate can lead to a variety of problems in patients with acidosis, including fluid overload, a postrecovery metabolic alkalosis, and hypernatremia. Furthermore, studies in both animals and humans suggest that alkali therapy may only transiently raise the plasma bicarbonate concentration. This finding appears to be related in part to CO2 generated as the administered bicarbonate buffers excess hydrogen ions. Unless the minute ventilation is increased (in ventilated patients), CO2 elimination will not be increased, and this will paradoxically worsen the intracellular acidosis. Currently, there are no data to support the use of bicarbonate in patients with lactic acidosis.25,26
Bicarbonate is frequently administered to “correct the acidosis” in patients with diabetic ketoacidosis (DKA). However, paradoxically, bicarbonate has been demonstrated to increase ketone and lactate production. Studies have demonstrated an increase in acetoacetate levels during alkali administration, followed by an increase in 3-hydroxybutyrate levels after its completion.27,28 In pediatric patients, treatment with bicarbonate has been demonstrated to prolong hospitalization.29 In addition, bicarbonate may decrease CSF pH, as increased CO2 produced by buffering acid crosses the blood-brain barrier, combines with H2O, and regenerates H+. It is generally believed that adjunctive bicarbonate is unnecessary and potentially disadvantageous in severe DKA.30
Lactic Acidosis

Hyperlactatemia refers to an elevated plasma concentration of lactate anions. In clinical practice, lactic acidemia is defined as a pH less than 7.35 with a lactate concentration greater than 4 mmol/L. Lactic acidemia typically develops as a result of endogenously produced lactic acid, with lactate being measured as the dissociated base. During critical illness, the source of lactate is often believed to be ischemic anaerobically metabolizing tissues, such as the gut and muscle. However, lactate metabolism in critical illness is complex and often does not indicate ischemic tissues.31 The anatomic source of lactate in critical illness is not consistent and may be dependent on the disease process and timing. Furthermore, it should be noted that both the pH and AG are insensitive markers of an elevated lactate; patients with an elevated lactate may have a normal pH and AG.32
D-Lactic Acidosis
Certain bacteria in the GI tract may convert carbohydrate into organic acids. The two factors that make this possible are slow GI transit (blind loops, obstruction) and change of the normal flora (usually with antibiotic therapy). The most prevalent organic acid is D-lactic acid. Since humans metabolize this isomer more slowly than L-lactate, and production rates can be very rapid, life-threatening acidosis can be produced.33 The usual laboratory test for lactate is specific for the L-lactate isomer. Therefore, to confirm the diagnosis, the plasma D-lactate must be measured.
Metabolic Alkalosis
Metabolic alkalosis is a common acid-base disturbance in ICU patients, characterized by an elevated serum pH (>7.45) secondary to plasma bicarbonate (HCO3−) retention. Metabolic alkalosis is usually the result of several therapeutic interventions in the critically ill patient (Table 45-8). Nasogastric drainage, diuretic-induced intravascular volume depletion, hypokalemia, and the use of corticosteroids are common causes of metabolic alkalosis in these patients. In addition, citrate in transfused blood is metabolized to bicarbonate, which may compound the metabolic alkalosis. Overventilation in patients with type II respiratory failure may result in a posthypercapnic metabolic alkalosis. In many patients, the events that generated the metabolic alkalosis may not be present at the time of diagnosis.
| Low Urine Chloride (Volume or Saline Responsive) |
The first therapeutic maneuver in patients with a metabolic alkalosis is to replace any fluid deficit with normal saline and correct electrolyte deficits. Aggressive potassium supplementation is warranted to achieve a K+ above 4.5 mEq/L. If these interventions fail, ammonium chloride, hydrochloric acid, or arginine hydrochloride may be given. The disadvantage of these solutions is that they are difficult to use and require the administration of a large volume of hypotonic fluid. Extravasation of hydrochloric acid may result in severe tissue necrosis, mandating administration through a well-functioning central line. Acetazolamide is a carbonic anhydrase inhibitor that promotes the renal excretion of bicarbonate and has been demonstrated to be effective in treating metabolic alkalosis in ICU patients. A single dose of 500 mg is recommended. The onset of action is within 1.5 hours, with duration of approximately 24 hours.34–37 Repeat doses may be required as necessary.
 Venous Blood Gas Analysis
Studies performed in the emergency room have demonstrated a strong correlation between arterial and venous blood pH and HCO3− levels in patients with DKA and uremia.36,37 In these studies, the difference between arterial and venous pH varied from 0.04 to 0.05, and the difference in bicarbonate levels varied from −1.72 to 1.88. However, as one would anticipate, the correlation between arterial and venous PCO2 was poor. These observations have been confirmed in a cohort of unselected emergency room patients38 and patients with tricyclic antidepressant poisoning.39 Similarly, an excellent correlation has been demonstrated between mixed venous pH and HCO3− with arterial pH and HCO3− in ICU patients.40,41 The association between arterial and venous pH, HCO3− and PCO2 is, however, not valid in patients with shock. In a now classic study, Weil and coauthors reported that during cardiopulmonary resuscitation, the arterial blood pH averaged 7.41, whereas the average mixed venous blood pH was 7.15.42 Similarly, the PaCO2 was 32 mm Hg, whereas the mixed venous PCO2 was 74 mm Hg. Androgue and colleagues have reported similar findings in patients with circulatory failure.43
In hemodynamically stable (and resuscitated patients) without known hypercarbia, ABG analysis may not be required; pulse oximetry and venous blood gas analysis should suffice in most circumstances. Furthermore, a venous blood gas can be useful to screen for arterial hypercarbia, with a venous PCO2 level > 45 mm Hg being highly predictive of arterial hypercarbia (sensitivity and negative predictive value of 100%). 44 In hemodynamically unstable patients and those with complex acid-base disorders, a venous blood gas cannot be substituted for an ABG analysis. In these situations, both arterial and mixed venous/central venous blood gas analysis provides useful information (see later discussion).
Mixed Venous/Central Venous Oxygen Saturation
Regional variations in the balance between DO2 and VO2 result in differences in the Hb saturation of blood in the superior and inferior venae cavae. Streaming of caval blood continues within the right atrium and ventricle, and complete mixing only occurs during ventricular contraction. The drainage of myocardial venous blood directly into the right atrium via the coronary sinus and cardiac chambers via the thebesian veins results in further discrepancies.45,46 Consequently, SmvO2 reflects the balance between oxygen supply and demand averaged across the entire body, but ScvO2 is affected disproportionately by changes in the upper body. In healthy individuals, ScvO2 is usually 2% to 5% less than SvO2, largely because of the high oxygen content of effluent venous blood from the kidneys.47 This relationship changes during periods of hemodynamic instability, because blood is redistributed to the upper body at the expense of the splanchnic and renal circulations. In shock states, therefore, the observed relationship between ScvO2 and SvO2 may reverse, and the absolute value of ScvO2 may exceed that of SvO2 by up to 20%.48 This lack of numerical equivalence has been demonstrated in various groups of critically ill patients, including those with cardiogenic, septic, and hemorrhagic shock. Based on these data, the Surviving Sepsis Campaign has recommended achieving an SmvO2 level of 65% or a ScvO2 level of 70% in patients with severe sepsis and septic shock.49 Although trends in ScvO2 may reflect those of SmvO2, the absolute values differ, and the variables cannot be used interchangeably.48,50–52 In addition to guiding resuscitation, ScvO2 may have prognostic significance, with low values during the first 24 hours of hospitalization or in the postoperative period being predictive of a worse outcome.53–55
In patients with sepsis and liver failure, a low ScvO2/SmvO2 is usually indicative of decreased cardiac output (oxygen delivery)56; however, normal values do not exclude adequate resuscitation or tissue hypoxia.57,58 The presence of functional and/or anatomic shunting results in “arterialization” of venous blood. In addition, cytopathic hypoxia may further decrease oxygen uptake and result in a “spuriously high” ScvO2.59 Indeed, patients dying of both sepsis and liver failure usually have a high ScvO2/SmvO2. In an intriguing study, Pope and colleagues demonstrated that in patients with sepsis, a high ScvO2 (90%-100%) at any time during hospitalization was an independent predictor of mortality, whereas a low ScvO2 (<70%) was only predictive of mortality if this value remained low following resuscitation.60 It is noteworthy that in a recent goal-directed sepsis study, the mean ScvO2 was 74% at enrollment, and less than 10% of patients required specific interventions to achieve ScvO2 above 70%.61
Experimental models have demonstrated that a high mixed venous–to-arterial PCO2 gradient is a reliable marker of decreased cardiac output and global tissue ischemia.62,63 This observation has been confirmed by Weil et al. and Androgue et al., who demonstrated that a high mixed venous–to-arterial PCO2 gradient is a sensitive marker of global tissue ischemia during cardiopulmonary resuscitation and in patients with circulatory failure.43,64,65 In patients with septic shock, Bakker and colleagues demonstrated that the venous-to-arterial PCO2 gradient was directly related to cardiac output.66 In resuscitated patients (ScvO2 > 70%) with septic shock, Vallee and coworkers demonstrated that a widened central venous-to-arterial PCO2 gradient (>6 mm Hg) identified patients with a low cardiac index who were inadequately resuscitated.58 The central venous-to-arterial PCO2 gradient may prove to be a better endpoint for resuscitation of septic patients than the ScvO2.
Key Points
1 Clark LC. Monitor and control of blood and tissue O2 tensions. Trans Am Soc Artif Intern Organs. 1956;2:41-48.
2 Severinghaus JW, Bradley AF. Electrodes for blood pO2 and pCO2 determination. J Appl Physiol. 1958;13:515-520.
3 Stow RW, Baer RF, Randall B. Rapid measurement of the tension of carbon dioxide in the blood. Arch Phys Med Rehabil. 1957;38:646-650.
4 Roberts D, Ostryzniuk P, Loewen E, et al. Control of blood gas measurements in intensive-care units. Lancet. 1991;337:1580-1582.
5 Haupt MT, Bekes CE, Brilli RJ, et al. Guidelines on critical care services and personnel: Recommendations based on a system of categorization of three levels of care. Crit Care Med. 2003;31:2677-2683.
6 AARC clinical practice guideline. Sampling for arterial blood gas analysis. American Association for Respiratory Care. Resp Care. 1992;37:913-917.
7 Muakkassa FF, Rutledge R, Fakhry SM, et al. ABGs and arterial lines: the relationship to unnecessarily drawn arterial blood gas samples. J Trauma. 1990;30:1087-1093.
8 Cohen A, Reyes R, Kirk M, et al. Osler’s nodes, pseudoaneurysm formation, and sepsis complicating percutaneous radial artery cannulation. Crit Care Med. 1984;12:1078-1079.
9 Evren EH, Tuzuner A, Yilmaz AA, et al. The impact of two arterial catheters, different in diameter and length, on postcannulation radial artery diameter, blood flow, and occlusion in atherosclerotic patients. J Anesth. 2009;23:347-352.
10 Cakar N, Tuorul M, Demirarslan A, et al. Time required for partial pressure of arterial oxygen equilibration during mechanical ventilation after a step change in fractional inspired oxygen concentration. Intensive Care Med. 2001;27:655-659.
11 Rickard CM, Couchman BA, Schmidt SJ, et al. A discard volume of twice the deadspace ensures clinically accurate arterial blood gases and electrolytes and prevents unnecessary blood loss. Crit Care Med. 2003;31:1654-1658.
12 Grocott MP, Martin DS, Levett DZ, et al. Arterial blood gases and oxygen content in climbers on Mount Everest. N Engl J Med. 2009;360:140-149.
13 West JB, Hackett PH, Maret KH, et al. Pulmonary gas exchange on the summit of Mount Everest. J Appl Physiol. 1983;55:678-687.
14 Sirker AA, Rhodes A, Grounds RM, et al. Acid-base physiology: the ‘traditional’ and the ‘modern’ approaches. Anaesthesia. 2002;57:348-356.
15 Stewart PA. Modern quantitative acid-base chemistry. Can J Physiol Pharmacol. 1983;61:1444-1461.
16 Carreira F, Anderson RJ. Assessing metabolic acidosis in the intensive care unit: does the method make a difference? Crit Care Med. 2004;32:1227-1228.
17 Figge J, Jabor A, Kazda A, et al. Anion gap and hypoalbuminemia. Crit Care Med. 1998;26:1807-1810.
18 Narins RG, Emmett M. Simple and mixed acid-base disorders: a practical approach. Medicine. 1980;59:161-187.
19 Takayesu JK, Bazari H, Linshaw M. Case records of the Massachusetts General Hospital. Case 7-2006. A 47-year-old man with altered mental status and acute renal failure. N Engl J Med. 2006;354:1065-1072.
20 Fenves AZ, Kirkpatrick HMIII, Patel VV, et al. Increased anion gap metabolic acidosis as a result of 5-oxoproline (pyroglutamic acid): a role for acetaminophen. Clin J Am Soc Nephrol. 2006;1:441-447.
21 Arroliga AC, Shehab N, McCarthy K, et al. Relationship of continuous infusion lorazepam to serum propylene glycol concentration in critically ill adults. Crit Care Med. 2004;32:1709-1714.
22 Yaucher NE, Fish JT, Smith HW, et al. Propylene glycol-associated renal toxicity from lorazepam infusion. Pharmacotherapy. 2003;23:1094-1099.
23 Yahwak JA, Riker RR, Fraser GL, et al. Determination of a lorazepam dose threshold for using the osmol gap to monitor for propylene glycol toxicity. Pharmacotherapy. 2008;28:984-991.
24 Marik PE. Propofol: Therapeutic indications and side effects. Curr Pharm Design. 2004;10:3639-3649.
25 Aschner JL, Poland RL. Sodium bicarbonate: basically useless therapy. Pediatrics. 2008;122:831-835.
26 Boyd JH, Walley KR. Is there a role for sodium bicarbonate in treating lactic acidosis from shock. Curr Opin Crit Care. 2008;14:379-383.
27 Okuda Y, Adrogue HJ, Field JB, et al. Counterproductive effects of sodium bicarbonate in diabetic ketoacidosis. J Clin Endocrinol Metab. 1996;81:314-320.
28 Beech JS, Williams SC, Iles RA, et al. Haemodynamic and metabolic effects in diabetic ketoacidosis in rats of treatment with sodium bicarbonate or a mixture of sodium bicarbonate and sodium carbonate. Diabetologia. 1995;38:889-898.
29 Green SM, Rothrock SG, Ho JD, et al. Failure of adjunctive bicarbonate to improve outcome in severe pediatric diabetic ketoacidosis. Ann Emerg Med. 1998;31:41-48.
30 Viallon A, Zeni F, Lafond P, et al. Does bicarbonate therapy improve the management of severe diabetic ketoacidosis? Crit Care Med. 1999;27:2690-2693.
31 James JH, Luchette FA, McCarter FD, et al. Lactate is an unreliable indicator of tissue hypoxia in injury or sepsis. Lancet. 1999;354:505-508.
32 Iberti TJ, Leibowitz AB, Papadakos PJ, et al. Low sensitivity of the anion gap as a screen to detect hyperlactatemia in critically ill patients. Crit Care Med. 1990;18:275-277.
33 Uribarri J, Oh MS, Carroll HJ. D-lactic acidosis. A review of clinical presentation, biochemical features, and pathophysiologic mechanisms. Medicine. 1998;77:73-82.
34 Marik PE, Kussman BD, Lipman J, et al. Acetazolamide in the treatment of metabolic alkalosis in critically ill patients. Heart Lung. 1991;20:455-459.
35 Mazur JE, Devlin JW, Peters MJ, et al. Single versus multiple doses of acetazolamide for metabolic alkalosis in critically ill medical patients: A randomized, double-blind trial. Crit Care Med. 1999;27:1257-1261.
36 Gokel Y, Paydas S, Koseoglu Z, et al. Comparison of blood gas and acid-base measurements in arterial and venous blood samples in patients with uremic acidosis and diabetic ketoacidosis in the emergency room. Am J Nephrol. 2000;20:319-323.
37 Brandenburg MA, Dire DJ. Comparison of arterial and venous blood gas values in the initial emergency department evaluation of patients with diabetic ketoacidosis. Ann Emerg Med. 1998;31:459-465.
38 Rang LC, Murray HE, Wells GA, et al. Can peripheral venous blood gases replace arterial blood gases in emergency department patients? Can J Emerg Med Care. 2002;4:7-15.
39 Eizadi-Mood N, Moein N, Saghaei M. Evaluation of relationship between arterial and venous blood gas values in the patients with tricyclic antidepressant poisoning. Clin Toxicol. 2005;43:357-360.
40 Malinoski DJ, Todd SR, Slone S, et al. Correlation of central venous and arterial blood gas measurements in mechanically ventilated trauma patients. Arch Surg. 2005;140:1122-1125.
41 Treger R, Pirouz S, Kamangar N, et al. Agreement between Central Venous and Arterial Blood Gas Measurements in the Intensive Care Unit. Clin J Am Soc Nephrol. 2010;5:390-394.
42 Weil MH, Rackow E, Trevino R. Difference in acid-base state between venous and arterial blood during cardiopulmonary resuscitation. N Engl J Med. 1986;315:153-156.
43 Androgue HJ, Rashad MN, Gorin AB. Assessing acid-base status in circulatory failure. N Engl J Med. 1989;320:1312-1316.
44 Kelly AM, Kerr D, Middleton P. Validation of venous pCO2 to screen for arterial hypercarbia in patients with chronic obstructive airways disease. J Emerg Med. 2005;28:377-379.
45 Shepherd SJ, Pearse RM. Role of central and mixed venous oxygen saturation measurement in perioperative care. Anesthesiol. 2009;111:649-656.
46 Glamann DB, Lange RA, Hillis LD. Incidence and significance of a “step-down” in oxygen saturation from superior vena cava to pulmonary artery. Am J Cardiol. 1991;68:695-697.
47 Dahn MS, Lange MP, Jacobs LA. Central mixed and splanchnic venous oxygen saturation monitoring. Intensive Care Med. 1988;14:373-378.
48 Reinhart K, Rudolph T, Bredle DL, et al. Comparison of central-venous to mixed-venous oxygen saturation during changes in oxygen supply/demand. Chest. 1989;95:1216-1221.
49 Dellinger RP, Levy MM, Carlet JM, et al. Surviving sepsis Campaign: International guidelines for management of severe sepsis and septic shock: 2008. Crit Care Med. 2008;36:296-327.
50 Yazigi A, El Khoury C, Jebara S, et al. Comparison of central venous to mixed venous oxygen saturation in patients with low cardiac index and filling pressures after coronary artery surgery. J Cardiothorac Vasc Anesth. 2008;22:77-83.
51 El Masry A, Mukhtar AM, el-Sherbeny AM, et al. Comparison of central venous oxygen saturation and mixed venous oxygen saturation during liver transplantation. Anaesthesia. 2009;64:378-382.
52 Scheinman MM, Brown MA, Rapaport E. Critical assessment of use of central venous oxygen saturation as a mirror of mixed venous oxygen in severely ill cardiac patients. Circulation. 1969;40:165-172.
53 Di Filippo A, Gonnelli C, Perretta L, et al. Low central venous saturation predicts poor outcome in patients with brain injury after major trauma: a prospective observational study. Scand J Trauma Resus Emerg Med. 2009;17:23.
54 Pearse R, Dawson D, Fawcett J, et al. Changes in central venous saturation after major surgery, and association with outcome. Crit Care. 2005;9:R694-R699.
55 Multicentre study on peri- and postoperative central venous oxygen saturation in high-risk surgical patients. Crit Care. 2006;10:R158.
56 Perner A, Haase N, Wiis J, et al. Central venous oxygen saturation for the diagnosis of low cardiac output in septic shock patients. Acta Anaesthesiol Scand. 2010;54:98-102.
57 Marik PE, Varon J. Early goal directed therapy (EGDT): on terminal life support? Am J Emerg Med.. 2010;28:243-245.
58 Vallee F, Vallet B, Mathe O, et al. Central venous-to-arterial carbon dioxide difference: an additional target for goal-directed therapy in septic shock? Intensive Care Med. 2008;34:2218-2225.
59 Fink MP. Bench-to-bedside review: Cytopathic hypoxia. Crit Care. 2002;6:491-499.
60 Pope JV, Jones AE, Gaieski DF, et al. Multicenter study of central venous oxygen saturation (ScvO(2)) as a predictor of mortality in patients with sepsis. Ann Emerg Med. 2010;55:40-46.
61 Jones AE, Shapiro NI, Trzeciak S, et al. Lactate clearance vs central venous oxygen saturation as goals of early sepsis therapy: a randomized clinical trial. JAMA. 2010;303:739-746.
62 Mathias DW, Clifford PS, Klopfenstein HS. Mixed venous blood gases are superior to arterial blood gases in assessing acid-base status and oxygenation during acute cardiac tamponade in dogs. J Clin Invest. 1988;82:833-838.
63 Rackow EC, Astiz ME, Mecher CE, et al. Increased venous-arterial carbon dioxide tension difference during severe sepsis in rats. Crit Care Med. 1994;22:121-125.
64 The International Stroke Trial (IST). a randomised trial of aspirin, subcutaneous heparin, both, or neither among 19 435 patients with acute ischaemic stroke. Lancet. 1997;349:1569-1581.
65 Mecher CE, Rackow EC, Astiz ME, et al. Venous hypercarbia associated with severe sepsis and systemic hypoperfusion. Crit Care Med. 1990;18:585-589.
66 Bakker J, Vincent JL, Gris P, et al. Veno-arterial carbon dioxide gradient in human septic shock. Chest. 1992;101:509-515.
