[level-membership-for-pulmolory-and-respiratory-category]
Arterial Blood Gas Assessments
After reading this chapter, you will be able to:
• Identify the following respiratory acid-base disturbances:
• Acute alveolar hyperventilation (acute respiratory alkalosis)
• Acute alveolar hyperventilation with partial renal compensation (partially compensated respiratory alkalosis)
• Chronic alveolar hyperventilation with complete renal compensation (compensated respiratory alkalosis)
• Acute ventilatory failure (acute respiratory acidosis)
• Acute ventilatory failure with partial renal compensation (partially compensated respiratory acidosis)
• Chronic ventilatory failure with complete renal compensation (compensated respiratory acidosis)
• Acute alveolar hyperventilation superimposed on chronic ventilatory failure
• Acute ventilatory failure superimposed on chronic ventilatory failure
• Identify the following metabolic acid-base disturbances:
• Metabolic acidosis with partial respiratory compensation
• Metabolic acidosis with complete respiratory compensation
• Metabolic alkalosis with partial respiratory compensation
• Metabolic alkalosis with complete respiratory compensation
• Identify the following combined acid-base disturbances:
• Combined metabolic and respiratory acidosis
• Combined metabolic and respiratory alkalosis
• Describe the pH, Paco2, and  relationship, and include the following:
• How acute Pco2 increases affect the pH and  values
• How acute Pco2 decreases affect the pH and  values
• The quick clinical calculation commonly used for acute Pco2 changes on pH and  values
• The general rule of thumb for the Paco2/ /pH relationship
• Describe the following six most common acid-base abnormalities seen in the clinical setting:
• Acute alveolar hyperventilation (acute respiratory alkalosis)
• Acute ventilatory failure (acute respiratory acidosis)
• Chronic ventilatory failure (compensated respiratory acidosis)
• Acute alveolar hyperventilation superimposed on chronic ventilatory failure
• Acute ventilatory failure superimposed on chronic ventilatory failure
• Lactic acidosis (metabolic acidosis)
• Describe the metabolic acid-base abnormalities including metabolic acidosis, anion gap, and metabolic alkalosis.
• List the causes of metabolic acidosis and metabolic alkalosis.
• Describe the potential hazards of oxygen therapy in patients with chronic ventilatory failure with hypoxemia.
• Define key terms and complete self-assessment questions at the end of the chapter and on Evolve.
 nomogram
 relationship
Acid-Base Abnormalities
As the pathologic processes of a respiratory disorder intensify, the patient’s arterial blood gas (ABG) values are usually altered to some degree. Table 4-1 lists the normal ABG values. Box 4-1 provides an overview of the respiratory and metabolic acid-base disturbances. In the profession of respiratory care, a basic knowledge and understanding of the acid-base disturbances is an absolute—and unconditional—prerequisite to the assessment and treatment of the patient with a respiratory disorder. Because of the fundamental importance of this subject, this chapter provides the following review:
Table 4-1
| Blood Gas Value* | Arterial | Venous |
| pH | 7.35 to 7.45 | 7.30 to 7.40 |
| Pco2 | 35 to 45 mm Hg | 42 to 48 mm Hg |
 |
22 to 28 mEq/L | 24 to 30 mEq/L |
| Po2 | 80 to 100 mm Hg | 35 to 45 mm Hg |
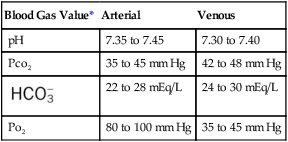
*Technically, only the oxygen (Po2) and carbon dioxide (Pco2) pressure readings are true blood gas values. The pH indicates the balance between the bases and acids in the blood. The bicarbonate ( ) reading is an indirect measurement that is calculated from the pH and Pco2 levels.
• The Pco2/ /pH relationship—an essential cornerstone of ABG interpretations
• The six most common acid-base abnormalities seen in the clinical setting
• The metabolic acid-base abnormalities
• The hazards of oxygen therapy in patients with chronic ventilatory failure with hypoxemia
The PCO2/ /pH Relationship
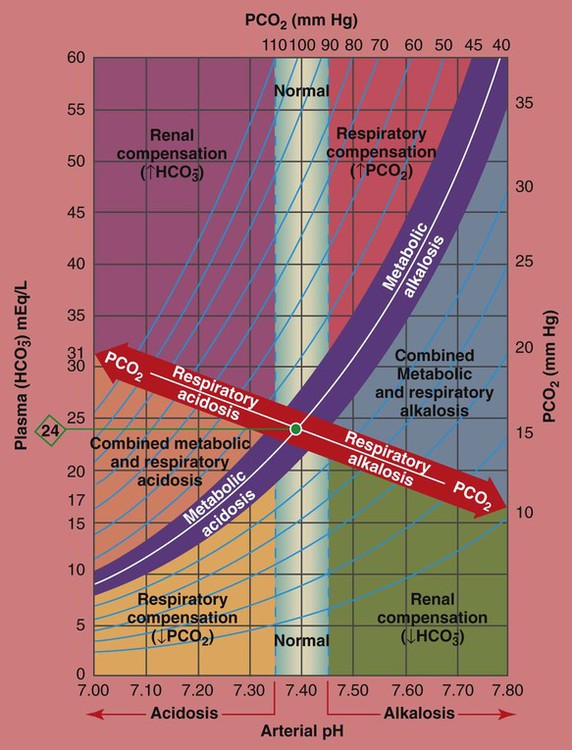
To fully understand the clinical significance of the acid-base disturbances listed in Box 4-1, a fundamental knowledge base of the Pco2/ /pH relationship is essential. The Pco2/
 /pH relationship is graphically illustrated in the
  nomogram shown in Figure 4-1.*
 /pH relationship. For explanation see text. (Used with permission from author, Terry DesJardins.)
How to Read the PCO2/ /pH Nomogram
The thick red bar moving from left to right across the Pco2/ /pH nomogram represents the normal Pco2 blood buffer line. This red bar is used to identify the pH and
  changes that occur immediately in response to an acute increase or decrease in Pco2. The purple bar is used to identify the pH and
  changes that occur in response to acute metabolic acidosis and metabolic alkalosis conditions. The colored areas that surround the red and purple bars are used to identify (1) partial and complete renal compensation, (2) partial and complete respiratory compensation, and (3) combined metabolic and respiratory acid-base disturbances (see Figure 4-1).
 values all intersect in the light purple area—shown in the upper left hand corner of the P
 /pH nomogram—partial renal compensation has occurred in response to a chronically high P
 increases enough to move the pH into the light-blue normal bar, complete renal compensation is confirmed. When the pH, P
 values all intersect in the in the green area—shown in the lower right hand corner of the P
 /pH nomogram—partial renal compensation has occurred in response to a chronically low P
 decreases enough to move the pH into the light-blue normal bar, complete renal compensation is confirmed.
 values all intersect in the in the orange area—shown immediately below the red bar on the left side of the P
 /pH nomogram—a combined respiratory and metabolic acidosis is confirmed. When the pH, P
 values all intersect in the in the blue area—shown immediately above the red bar on the right side of the P
 /pH nomogram—a combined respiratory and metabolic alkalosis is confirmed.
 values all intersect in the yellow area—shown in the lower left corner of the P
 /pH nomogram—respiratory compensation has occurred in response to metabolic acidosis. When the pH, P
 values all intersect in the pink area—shown in the upper right corner of the P
 /pH nomogram—respiratory compensation has occurred in response to metabolic alkalosis.
Although it is beyond the scope of this textbook to fully explain how each of the acid-base disturbances listed in Box 4-1 can be identified on the Pco2/ /pH nomogram, a basic understanding of the following two most commonly encountered Pco2/
 /pH relationships is important: (1) an acute Pco2 increase and its effects on the pH and
  values, and (2) an acute Pco2 decrease and its effects on the pH and
  values.*
How Acute PCO2 Increases Affect the pH and  Values
As mentioned previously, the red normal Pco2 blood buffer bar shown on the Pco2/ /pH nomogram is used to identify the pH and
  values that will result immediately in response to a sudden increase in Pco2. For example, if the patient’s Paco2 were to suddenly increase to, say, 60 mm Hg, the pH would immediately fall to about 7.28 and the
  level would increase to about 26 mEq/L. Furthermore, the Pco2/
 /pH nomogram shows that these ABG values represent acute ventilatory failure (acute respiratory acidosis). This is because (1) all of the ABG values (i.e., Pco2,
  , and pH) intersect within the red normal Pco2 blood buffer bar, and (2) the pH and
  readings are precisely what is expected for an acute increase in the Pco2 of 60 mm Hg (Figure 4-2).

 values all intersect within the red-colored respiratory acidosis bar to the left of the light blue, vertical bar labeled “normal”. For example, when the P
 is 26 mEq/L, acute ventilatory failure is confirmed. (Used with permission from author, Terry DesJardins.)
How Acute PCO2 Decreases Affect the pH and  Values
On the other hand, the red normal Pco2 blood buffer bar shown on the Pco2/ /pH nomogram is also used to identify the pH and
  values that will result immediately in response to a sudden decrease in Pco2. For example, if the patient’s Paco2 were suddenly to decrease to, say, 25 mm Hg, the pH would immediately increase to about 7.55 and the
  level would decrease to about 21 mEq/L. In addition, the Pco2/
 /pH nomogram shows that these ABG values represent acute alveolar hyperventilation (acute respiratory alkalosis). This is because (1) all of the ABG values (i.e., Pco2,
  , and pH) intersect within the red normal Pco2 blood buffer bar, and (2) the pH and
  readings are precisely what is expected for an acute increase in the Pco2 of 25 mm Hg (Figure 4-3).
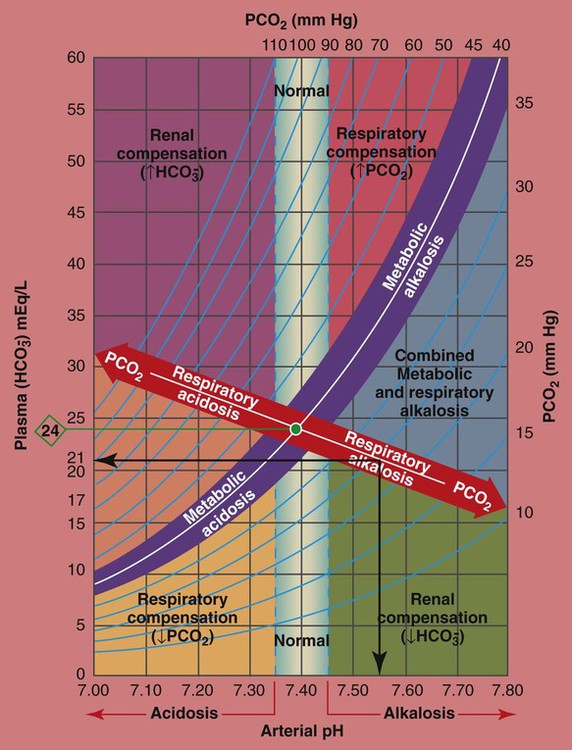
 values all intersect within the red-colored “Respiratory alkalosis” bar. For example, when the reported P
 is 21 mEq/L, acute alveolar hyperventilation is confirmed. (Used with permission from author, Terry DesJardins.)
A Quick Clinical Calculation for the Effect of Acute PaCO2 Changes on pH and 
In addition to using the graphic Pco2/ /pH nomogram (see Figure 4-1), the following simple calculations can also be used to estimate the expected pH and
  value changes that will immediately occur in response to a sudden increase or decrease in Paco2.
 24 mEq/L), for every 10 mm Hg the Pa
 will increase about 1 mEq/L (from 24). Or, by way of another example, for every 20 mm Hg the Pa
 will increase about
  would be about 26 mEq/L.
 values would both be lower than expected for a particular Pa
Acute decreases in PaCO2 (e.g., acute hyperventilation)
 24 mEq/L), for every 5 mm Hg the Pa
 will decrease about 1 mEq/L. Or, by way of another example, for every 10 mm Hg the Pa
 will decrease about 2 mEq/L. Thus, if a patient’s Pa
 would be about 22 mEq/L.
 values would both be lower than expected for a particular Pa
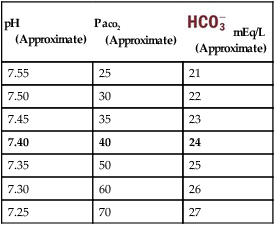
Using these calculations, Table 4-2 provides a general rule of thumb for the expected pH and  changes that occur in response to an acute increase or decrease in the Pco2 level.
Table 4-2
General Rule of Thumb for the Paco2/ /pH Relationship
| pH (Approximate) |
Paco2 (Approximate) |
 mEq/L mEq/L(Approximate) |
| 7.55 | 25 | 21 |
| 7.50 | 30 | 22 |
| 7.45 | 35 | 23 |
| 7.40 | 40 | 24 |
| 7.35 | 50 | 25 |
| 7.30 | 60 | 26 |
| 7.25 | 70 | 27 |
The Six Most Common Acid-Base Abnormalities Seen in the Clinical Setting
| Acute Alveolar Hyperventilation (Acute Respiratory Alkalosis) | |
| ABG Changes | Example |
| pH: increased | 7.55 |
| Paco2: decreased | 29 mm Hg |
 : decreased : decreased |
22 mEq/L |
| Pao2: decreased | 61 mm Hg (when pulmonary pathology is present) |
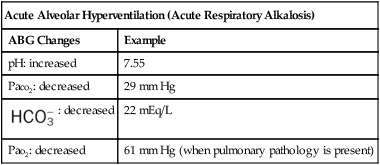
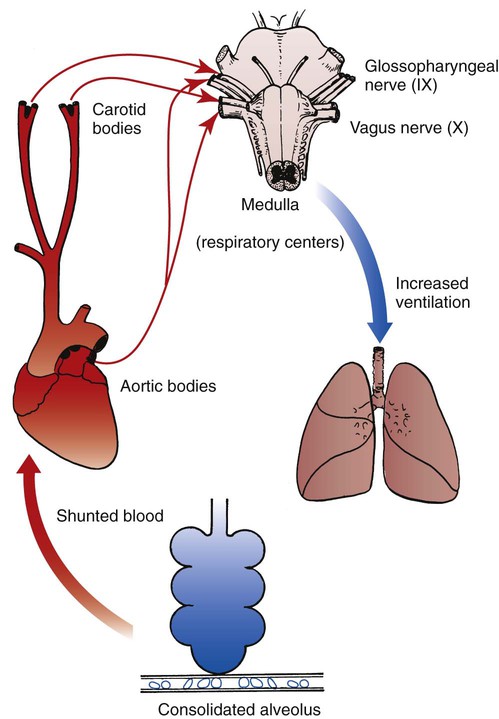
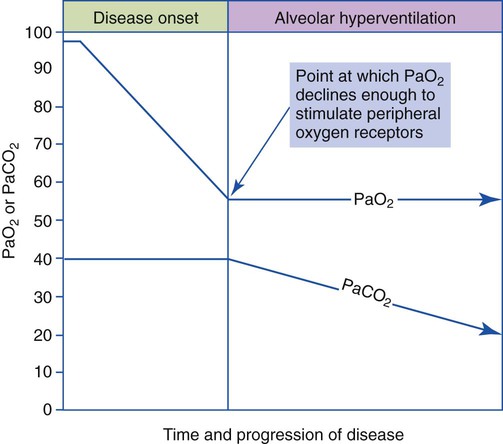
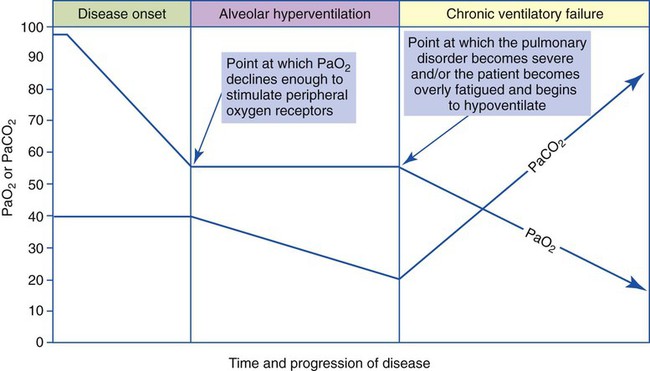
The most common cause of acute alveolar hyperventilation is hypoxemia. The decreased Pao2 seen during acute alveolar hyperventilation usually develops from the decreased ventilation-perfusion ratio ( ratio), capillary shunting (or a relative shunt or shuntlike effect), and venous admixture associated with the pulmonary disorder. The Pao2 continues to drop as the pathologic effects of the disease intensify. Eventually the Pao2 may decline to a point sufficiently low (a Pao2 of about 60 mm Hg) to stimulate the peripheral chemoreceptors, which in turn causes the ventilatory rate to increase (Figure 4-4). The increased ventilatory response in turn causes the Paco2 to decrease and the pH to increase (Figure 4-5). Box 4-2 lists additional pathophysiologic mechanisms in respiratory disorders that can contribute to an increased ventilatory rate and a reduction in the Paco2.
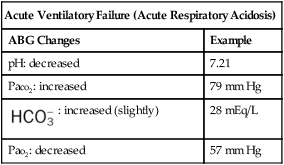
| Acute Ventilatory Failure (Acute Respiratory Acidosis) | |
| ABG Changes | Example |
| pH: decreased | 7.21 |
| Paco2: increased | 79 mm Hg |
 : increased (slightly) : increased (slightly) |
28 mEq/L |
| Pao2: decreased | 57 mm Hg |
| Chronic Ventilatory Failure (Compensated Respiratory Acidosis) | |
| ABG Changes | Example |
| pH: normal | 7.38 |
| Paco2: increased | 66 mm Hg |
 : increased (significantly) : increased (significantly) |
35 mEq/L |
| Pao2: decreased | 63 mm Hg |
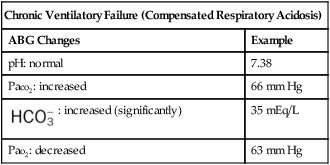
Chronic ventilatory failure is defined as a greater-than-normal Paco2 level with a normal pH status. Although chronic ventilatory failure is most commonly seen in patients with severe chronic obstructive pulmonary disease, it is also seen in several chronic restrictive lung disorders (e.g., severe tuberculosis, kyphoscoliosis). Box 4-3 lists common respiratory diseases associated with chronic ventilatory failure during the advanced stages of the disorder.
The basic pathophysiologic mechanisms that produce ABGs associated with chronic ventilatory failure are these: As a respiratory disorder gradually worsens, the work of breathing progressively increases to a point at which more oxygen is consumed than is gained. Although the exact mechanism is unclear, the patient slowly develops a breathing pattern that uses the least amount of oxygen for the energy expended. In essence, the patient selects a breathing pattern based on work efficiency rather than ventilatory efficiency.* As a result, the patient’s alveolar ventilation slowly decreases, which in turn causes the Pao2 to decrease and the Paco2 to increase further (Figure 4-6). As the Paco2 increases, the pH falls.
When an individual hypoventilates for a long period of time, the kidneys work to correct the decreased pH by retaining  in the blood. Renal compensation in the presence of chronic hypoventilation can be shown when the calculated
  and pH readings are higher than expected for a particular Pco2 level. For example, in terms of the absolute
  relationship, when the Pco2 level is about 70 mm Hg, the
  level should be about 27 mEq/L and the pH should be about 7.22, according to the normal blood buffer line (see Figure 4-2).
If the  and pH levels are greater than these values (i.e., the pH and
  readings cross a Pco2 isobar† above the normal blood buffer line in the upper left-hand corner of the nomogram), renal retention of
  (partial renal compensation) has occurred. When the
  level increases enough to return the acidic pH to normal, complete renal compensation is said to have occurred (chronic ventilatory failure).
 , and pH levels on a moment-to-moment basis. The kidneys play an important role in maintaining the
  and pH levels during long periods of hyperventilation or hypoventilation.
Acute Ventilatory Changes Superimposed on Chronic Ventilatory Failure
| Acute Alveolar Hyperventilation Superimposed on Chronic Ventilatory Failure (Acute Hyperventilation on Compensated Respiratory Acidosis) | |
| ABG Changes | Example |
| pH: increased | 7.53 |
| Paco2: increased | 51 mm Hg |
 : increased : increased |
37 mEq/L |
| Pao2: decreased | 46 mm Hg |
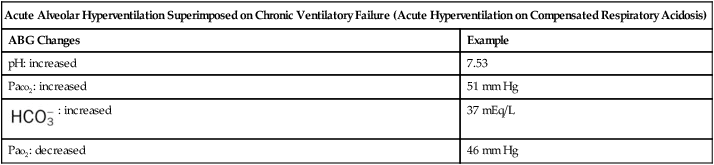
When excessive alveolar ventilation occurs, the patient’s Paco2 rapidly decreases. This action causes the patient’s Paco2 to decrease from its normally high baseline level. As the Paco2 decreases, the arterial pH increases. As this condition intensifies, the patient’s baseline ABG values can quickly change from chronic ventilatory failure to acute alveolar hyperventilation superimposed on chronic ventilatory failure (Table 4-3).
Table 4-3
Examples of Acute Changes in Chronic Ventilatory Failure
| Acute Ventilatory Failure on Chronic Ventilatory Failure | Chronic Ventilatory Failure (Baseline Values) | Acute Alveolar Hyperventilation on Chronic Ventilatory Failure |
7.21  |
pH 7.39 |
7.53  |
110  |
Paco2 76 |
51  |
43  |
 41 |
37  |
34  |
Pao2 61 |
46  |
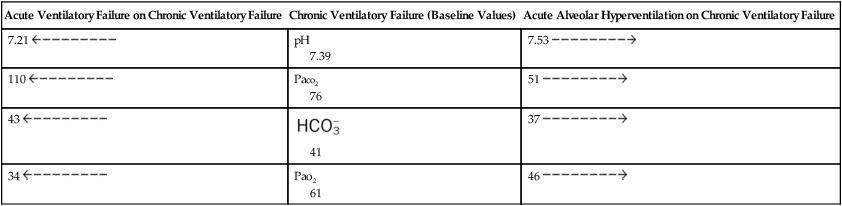
If the clinician does not know the past history of the patient with acute alveolar hyperventilation superimposed on chronic ventilatory failure, he or she might initially interpret the ABG values as signifying partially compensated metabolic alkalosis with severe hypoxemia (see Box 4-1). However, the clinical situation that offsets this interpretation is the presence of marked hypoxemia. A low oxygen level is not normally seen in patients with pure metabolic alkalosis. Thus, whenever the ABG values appear to reflect partially compensated metabolic alkalosis but the condition is accompanied by significant hypoxemia, the respiratory care practitioner should be alert to the possibility of acute alveolar hyperventilation superimposed on chronic ventilatory failure.
| Acute Ventilatory Failure Superimposed on Chronic Ventilatory Failure (Acute Hypoventilation on Compensated Respiratory Acidosis) | |
| ABG Changes | Example |
| pH: decreased | 7.21 |
| Paco2: increased | 110 mm Hg |
 : increased : increased |
43 mEq/L |
| Pao2: decreased | 34 mm Hg |
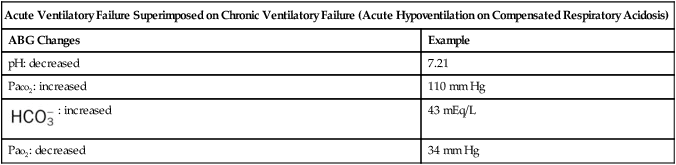
Often patients with chronic ventilatory failure do not have the mechanical reserve to meet the hypoxemic challenge of a respiratory disorder. When these patients attempt to maintain their baseline Pao2, by increasing alveolar ventilation, they consume more oxygen than is gained. When this happens, the patient begins to breathe less. This action causes the Paco2 to increase and eventually to rise above the patient’s normally high Paco2 baseline level. This action causes the patient’s arterial pH level to fall, or become acidic. In short, the patient’s baseline ABG values shift from chronic ventilatory failure to acute ventilatory failure superimposed on chronic ventilatory failure (see Table 4-3).
| Lactic Acidosis (Metabolic Acidosis) | |
| ABG Changes | Example |
| pH: decreased | 7.21 |
| Paco2: Normal or decreased | 35 mm Hg |
 : decreased : decreased |
19 mEq/L |
| Pao2: decreased | 34 mm Hg |
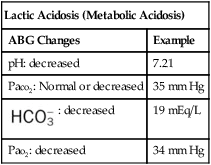
As shown in Box 4-1, metabolic acid-base disturbances are subdivided into the following two categories: metabolic acidosis and metabolic alkalosis. An overview of the metabolic acid-base disturbances are presented in the following section.
Metabolic Acid-Base Abnormalities
| Metabolic Acidosis | |
| ABG Changes | Example |
| pH: decreased | 7.26 |
| Paco2: normal | 37 mm Hg |
 : decreased : decreased |
18 mEq/L |
| Pao2: normal (or decreased if lactic acidosis is present) | 94 mm Hg (or 52 mm Hg if lactic acidosis is present) |
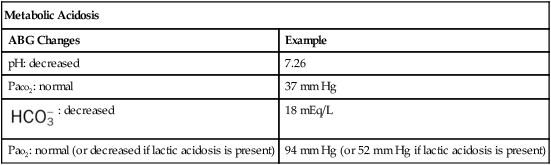
Metabolic Acidosis
The presence of other acids not related to an increased Paco2 level or renal compensation can be identified by using the isobars of the  nomogram shown in Figure 4-1. The presence of other acids is verified when the calculated
  reading and pH level are both lower than expected for a particular Paco2 level in terms of the absolute
  relationship. For example, according to the normal blood buffer line, an
  reading of 15 mEq/L and a pH of 7.20 would both be less than expected in a patient who has a Pco2 of 40 mm Hg. This condition is referred to as metabolic acidosis.
Anion Gap
 .
. ) ions. The normal plasma concentrations of these cations and anions are the following:
 : 24 mEq/L
The anion gap is the calculated difference between the Na+ ions and the sum of the  and Cl− ions:
< ?xml:namespace prefix = "mml" />
 . This action causes (1) the
  level to fall, and (2) the anion gap to rise.
 (e.g., from renal disease or severe diarrhea) does not cause an increase in the anion gap. This is because as the
  level decreases, the Cl− level usually increases to maintain electroneutrality. In short, for every
  ion that is lost, a Cl− anion takes its place (i.e., the law of electroneutrality). This action maintains a normal anion gap. Metabolic acidosis caused by decreased
  is commonly called hyperchloremic metabolic acidosis.
 (e.g., caused by renal failure or severe diarrhea).
| Metabolic Alkalosis | |
| ABG Changes | Example |
| pH: increased | 7.56 |
| Paco2: normal | 44 mm Hg |
 : increased : increased |
27 mEq/L |
| Pao2: normal | 94 mm Hg |
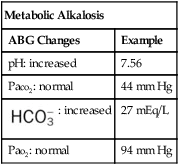
Metabolic Alkalosis
The presence of other bases not related to either a decreased Paco2 level or renal compensation also can be identified by using the  nomogram illustrated in Figure 4-1. The presence of metabolic alkalosis is verified when the calculated
  and pH readings are both higher than expected for a particular Paco2 level in terms of the absolute
  relationship. For example, according to the normal blood buffer line, an
  reading of 35 mEq/L and a pH level of 7.54 would both be higher than expected in a patient who has a Paco2 level of 40 mm Hg (see Figure 4-1). This condition is known as metabolic alkalosis.
Clinically, metabolic alkalosis is seen more often than metabolic acidosis. Box 4-4 provides common causes of the metabolic abnormalities.
 relationships to deteriorate, leading to an acute rise in P
 ratio. Regardless of the precise cause of oxygen-induced hypercapnia, the respiratory care practitioner must always exercise caution when providing oxygen therapy to patients with chronic hypercapnia. Clinically, patients with chronic hypercapnia (e.g., obstructive pulmonary disease) are typically oxygenated with low and precisely controlled concentrations of oxygen. In such patients, oxygen devices that provide a fixed F
*The Pco2/ /pH nomogram is an excellent clinical tool to identify acid-base disturbances. See Appendix xiv for a pocket-size Pco2/
 /pH nomogram card that can be cut out, laminated, and used as a handy arterial blood gas reference tool in the clinical setting.
*For a complete review of the role of the Pco2/ /pH relationship in acid-base balance, see Des Jardins T: Cardiopulmonary anatomy and physiology: essentials of respiratory care, ed 5, 2008, Delmar/Cengage Learning.
*See the discussion of airway resistance and its effect on the ventilatory pattern in Chapter 2.
†The isobars on the Pco2/ /pH nomogram illustrate the pH changes that develop in the blood as a result of (1) metabolic changes (i.e.,
  changes) or (2) a combination of metabolic and respiratory (CO2) changes.
[/level-membership-for-pulmolory-and-respiratory-category][not-level-membership-for-pulmolory-and-respiratory-category]
Arterial Blood Gas Assessments
After reading this chapter, you will be able to:
• Identify the following respiratory acid-base disturbances:
• Acute alveolar hyperventilation (acute respiratory alkalosis)
• Acute alveolar hyperventilation with partial renal compensation (partially compensated respiratory alkalosis)
• Chronic alveolar hyperventilation with complete renal compensation (compensated respiratory alkalosis)
• Acute ventilatory failure (acute respiratory acidosis)
• Acute ventilatory failure with partial renal compensation (partially compensated respiratory acidosis)
• Chronic ventilatory failure with complete renal compensation (compensated respiratory acidosis)
• Acute alveolar hyperventilation superimposed on chronic ventilatory failure
• Acute ventilatory failure superimposed on chronic ventilatory failure
• Identify the following metabolic acid-base disturbances:
• Metabolic acidosis with partial respiratory compensation
• Metabolic acidosis with complete respiratory compensation
• Metabolic alkalosis with partial respiratory compensation
• Metabolic alkalosis with complete respiratory compensation
• Identify the following combined acid-base disturbances:
• Combined metabolic and respiratory acidosis
• Combined metabolic and respiratory alkalosis
• Describe the pH, Paco2, and relationship, and include the following:
• How acute Pco2 increases affect the pH and values
• How acute Pco2 decreases affect the pH and values
• The quick clinical calculation commonly used for acute Pco2 changes on pH and values
• The general rule of thumb for the Paco2//pH relationship
• Describe the following six most common acid-base abnormalities seen in the clinical setting:
• Acute alveolar hyperventilation (acute respiratory alkalosis)
• Acute ventilatory failure (acute respiratory acidosis)
• Chronic ventilatory failure (compensated respiratory acidosis)
• Acute alveolar hyperventilation superimposed on chronic ventilatory failure
• Acute ventilatory failure superimposed on chronic ventilatory failure
• Lactic acidosis (metabolic acidosis)
• Describe the metabolic acid-base abnormalities including metabolic acidosis, anion gap, and metabolic alkalosis.
• List the causes of metabolic acidosis and metabolic alkalosis.
• Describe the potential hazards of oxygen therapy in patients with chronic ventilatory failure with hypoxemia.
• Define key terms and complete self-assessment questions at the end of the chapter and on Evolve.
Acid-Base Abnormalities
As the pathologic processes of a respiratory disorder intensify, the patient’s arterial blood gas (ABG) values are usually altered to some degree. Table 4-1 lists the normal ABG values. Box 4-1 provides an overview of the respiratory and metabolic acid-base disturbances. In the profession of respiratory care, a basic knowledge and understanding of the acid-base disturbances is an absolute—and unconditional—prerequisite to the assessment and treatment of the patient with a respiratory disorder. Because of the fundamental importance of this subject, this chapter provides the following review:
Table 4-1
| Blood Gas Value* | Arterial | Venous |
| pH | 7.35 to 7.45 | 7.30 to 7.40 |
| Pco2 | 35 to 45 mm Hg | 42 to 48 mm Hg |
|
22 to 28 mEq/L | 24 to 30 mEq/L |
| Po2 | 80 to 100 mm Hg | 35 to 45 mm Hg |
*Technically, only the oxygen (Po2) and carbon dioxide (Pco2) pressure readings are true blood gas values. The pH indicates the balance between the bases and acids in the blood. The bicarbonate () reading is an indirect measurement that is calculated from the pH and Pco2 levels.
• The Pco2//pH relationship—an essential cornerstone of ABG interpretations
• The six most common acid-base abnormalities seen in the clinical setting
• The metabolic acid-base abnormalities
• The hazards of oxygen therapy in patients with chronic ventilatory failure with hypoxemia
The PCO2//pH Relationship
To fully understand the clinical significance of the acid-base disturbances listed in Box 4-1, a fundamental knowledge base of the Pco2//pH relationship is essential. The Pco2//pH relationship is graphically illustrated in the nomogram shown in Figure 4-1.*
How to Read the PCO2//pH Nomogram
The thick red bar moving from left to right across the Pco2//pH nomogram represents the normal Pco2 blood buffer line. This red bar is used to identify the pH and changes that occur immediately in response to an acute increase or decrease in Pco2. The purple bar is used to identify the pH and changes that occur in response to acute metabolic acidosis and metabolic alkalosis conditions. The colored areas that surround the red and purple bars are used to identify (1) partial and complete renal compensation, (2) partial and complete respiratory compensation, and (3) combined metabolic and respiratory acid-base disturbances (see Figure 4-1).
Although it is beyond the scope of this textbook to fully explain how each of the acid-base disturbances listed in Box 4-1 can be identified on the Pco2//pH nomogram, a basic understanding of the following two most commonly encountered Pco2//pH relationships is important: (1) an acute Pco2 increase and its effects on the pH and values, and (2) an acute Pco2 decrease and its effects on the pH and values.*
How Acute PCO2 Increases Affect the pH and Values
As mentioned previously, the red normal Pco2 blood buffer bar shown on the Pco2//pH nomogram is used to identify the pH and values that will result immediately in response to a sudden increase in Pco2. For example, if the patient’s Paco2 were to suddenly increase to, say, 60 mm Hg, the pH would immediately fall to about 7.28 and the level would increase to about 26 mEq/L. Furthermore, the Pco2//pH nomogram shows that these ABG values represent acute ventilatory failure (acute respiratory acidosis). This is because (1) all of the ABG values (i.e., Pco2, , and pH) intersect within the red normal Pco2 blood buffer bar, and (2) the pH and readings are precisely what is expected for an acute increase in the Pco2 of 60 mm Hg (Figure 4-2).
How Acute PCO2 Decreases Affect the pH and Values
On the other hand, the red normal Pco2 blood buffer bar shown on the Pco2//pH nomogram is also used to identify the pH and values that will result immediately in response to a sudden decrease in Pco2. For example, if the patient’s Paco2 were suddenly to decrease to, say, 25 mm Hg, the pH would immediately increase to about 7.55 and the level would decrease to about 21 mEq/L. In addition, the Pco2//pH nomogram shows that these ABG values represent acute alveolar hyperventilation (acute respiratory alkalosis). This is because (1) all of the ABG values (i.e., Pco2, , and pH) intersect within the red normal Pco2 blood buffer bar, and (2) the pH and readings are precisely what is expected for an acute increase in the Pco2 of 25 mm Hg (Figure 4-3).
A Quick Clinical Calculation for the Effect of Acute PaCO2 Changes on pH and
In addition to using the graphic Pco2//pH nomogram (see Figure 4-1), the following simple calculations can also be used to estimate the expected pH and value changes that will immediately occur in response to a sudden increase or decrease in Paco2.
