[level-membership-for-pulmolory-and-respiratory-category]
5 Advanced Cardiopulmonary Monitoring
Note 1: This book is written to cover every item listed as testable on the Entry Level Examination (ELE), Written Registry Examination (WRE), and Clinical Simulation Examination (CSE).
The listed code for each item is taken from the National Board for Respiratory Care’s (NBRC) Summary Content Outline for CRT (Certified Respiratory Therapist) and Written RRT (Registered Respiratory Therapist) Examinations (see http://evolve.elsevier.com/Sills/resptherapist/). For example, if an item is testable on both the ELE and the WRE, it will simply be shown as: (Code: …). If an item is only testable on the ELE, it will be shown as: (ELE code: …). If an item is only testable on the WRE, it will be shown as: (WRE code: …).
MODULE A
1. Capnography (exhaled CO2 monitoring)
b. Recommend capnography to obtain additional data (Code: IC10) [Difficulty: ELE: R, Ap; WRE: An]
There are three main reasons to recommend capnography. The first reason is to assess a patient’s ventilation. General anesthesia and even conscious sedation can result in a blunting of the patient’s normal drive to breathe. Several clinical or pathologic situations (discussed later in this chapter) can result in an abnormal increase or decrease in the carbon dioxide level. Second, capnography helps evaluate the effectiveness of cardiopulmonary resuscitation efforts. See the discussion in Chapter 11. Third, capnography can be used to help identify the proper placement of an endotracheal tube. If the tube is within the patient’s trachea or a main stem bronchus, the exhaled tidal volume will contain carbon dioxide. See the discussion in Chapter 12.
c. Perform the bedside procedure (Code: IB9c and IIIE3d) [Difficulty: ELE: R; WRE: Ap, An]
The capnometer is calibrated by comparing a gas sample without carbon dioxide (possibly room air) with a second gas sample containing a known amount of carbon dioxide. The first gas sample without CO2 should give a “zero” reading. Adjust the calibration control to zero if needed. The second sample usually contains 5% to 10% carbon dioxide. The capnometer should display a CO2 level that matches the amount in the known gas sample. Adjust the calibration control as necessary. The carbon dioxide level can be documented as a percent or fraction (FACO2) or as a partial pressure (PACO2).
The capnograph is a strip chart recorder that provides a copy of the patient’s exhaled carbon dioxide curve. There are at least two paper speeds that are useful for different purposes. The fast speed is most useful for evaluating sudden changes in the patient’s condition. Each individual breath is easily seen (Figure 5-1). The slow speed is most useful for trend monitoring (Figure 5-2).
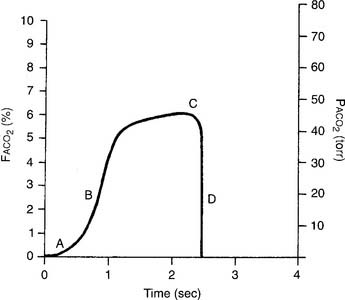
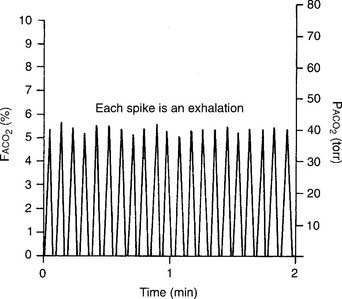
Figure 5-2 Normal capnograph tracing taken at a slow speed. The percentage of exhaled alveolar CO2 is shown on the left vertical scale as FACO2. The partial pressure of exhaled alveolar CO2 is shown on the right vertical scale as PACO2. The slow speed results in a blending of parts A, B, and C of the fast-speed tracing (Figure 5-1). Each spike is part C of the curve and marks an exhalation. A slow-speed tracing is more useful in trend monitoring of a patient than a fast-speed tracing.
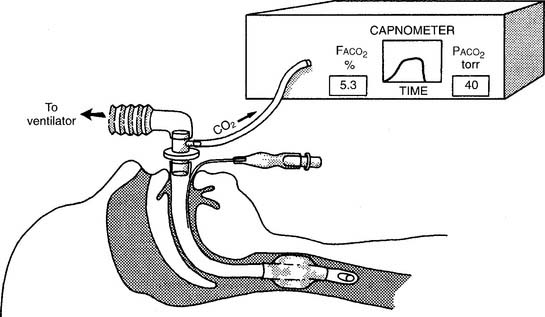
Two different gas sampling methods exist: mainstream and sidestream. The mainstream method involves having the infrared sensing unit at the airway; usually it is attached directly to the endotracheal/tracheostomy tube. If the patient is on a ventilator, the sampling adapter must be placed between the endotracheal tube and the ventilator circuit (with or without mechanical dead space). All inspired and expired gas passes through the sensor (Figure 5-3).

The sidestream method employs a capillary tube placed so that a small sampling of the patient’s exhaled gas can be drawn into the capnometer for analysis. It is not necessary for the patient’s entire breath to pass through the sampling adapter; therefore it can be used in an unintubated patient by taping the sampling catheter a short distance into a nostril. If the patient is on a ventilator, the sampling adapter must be placed between the endotracheal tube and the ventilator circuit (with or without mechanical dead space). Remember that the patient’s exhaled tidal volume (VT) and minute volume ( E) are reduced by the amount that is drawn into the capnometer (Figure 5-4).
d. Interpret the results from the procedure (Code: IB10c, IIIE4e) [Difficulty: ELE: R, Ap; WRE: An]
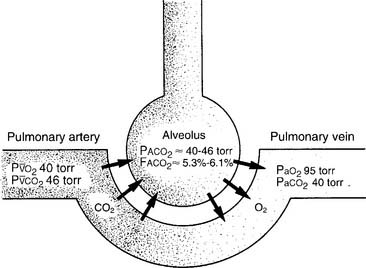
It is known that carbon dioxide diffuses from the higher concentration in the tissues to the venous blood and to the lungs to be exhaled. Figure 5-5 shows the normal physiology behind capnography. This diffusion or “flow” of CO2 results in a measurable gradient or difference. In a healthy, upright sitting person, a close relationship exists between carbon dioxide levels in both venous blood and arterial blood and the amount of exhaled carbon dioxide gas. The carbon dioxide level at the end of exhalation is most frequently monitored during patient care. This is called the end-tidal carbon dioxide pressure (PetCO2). When ventilation and perfusion match well, as in a healthy upright person, the gradient between the arterial carbon dioxide level (PaCO2) and the PetCO2 is between 2 and 3 torr, with a range of 1 to 5 torr. The gradient will show the PetCO2 level to be less than the PaCO2 level. This is because the PetCO2 value is an average of exhaled carbon dioxide levels from all lung areas.
Box 5-1 lists normal values of capnography. Three factors influence capnography’s use and the interpretation of the results. (1) The first factor is the patient’s metabolism. The average resting adult produces about 200 mL of CO2 per minute, and fever and exercise increase this value. Hypothermia, sleep, and sedation decrease CO2 production. Exhaled CO2 is monitored during a cardiopulmonary resuscitation (CPR) attempt to determine the effectiveness of circulation and ventilation attempts and to decide if the efforts should be continued or stopped. If no carbon dioxide is being exhaled despite proper CPR procedures, the physician may conclude that the patient’s metabolism has stopped altogether and death has occurred. There would then be nothing to gain by continuing cardiopulmonary resuscitation (CPR) efforts.
BOX 5-1 Normal Blood Gas and Capnography Values (Based on a Sea Level Barometric Pressure of 760 torr)*
PaCO2† is 40 torr (range of 35 to 45 torr).
The pressure of exhaled alveolar CO2 (PACO2) ranges from 35 to 43 torr with the breathing cycle.
The percentage of end-tidal CO2 (FACO2) is about 4%-6% and trends with the PaCO2 level.
(2) Although not a major factor, the patient’s cardiac output is another factor that influences the use of capnography. Sepsis, which might double a patient’s cardiac output, reduces the PCO2 level only a few torr (millimeters of mercury [mm Hg]). Cardiogenic shock, which reduces the cardiac output, raises the partial pressure of CO2 (PCO2) only a few torr.
(3) The third and most important factor is alveolar ventilation. A doubling of alveolar ventilation, under steady-state conditions for carbon dioxide production, results in a halving of the PCO2 levels in arterial blood and alveolar gas. However, a reduction of alveolar ventilation to half of its previous level will result in the PaCO2 and PACO2 levels being doubled (Figure 5-6).
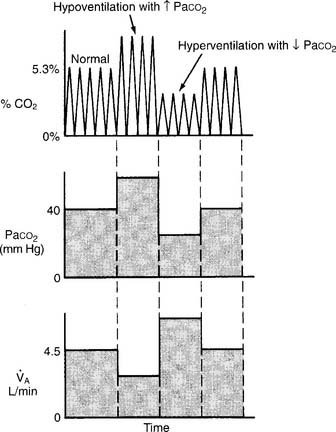
Figure 5-6 Relationship between alveolar ventilation, PaCO2, and exhaled percent CO2.
(From Pilbeam SP: Mechanical ventilation: physiological and clinical applications, ed 4, St Louis, 2006, Mosby.)
 O2). However, in questions referring to capnography, the NBRC has used both mm Hg and torr in its questions that relate to exhaled CO2 (such as PACO2 and PETCO2).
 O2). However, in questions regarding capnography, the NBRC has used both mm Hg and torr in its questions that relate to exhaled CO2 (such as PACO2 and PetCO2).
2. Arterial–end-tidal carbon dioxide gradient
a. Perform the bedside procedure (Code: IB9c and IIIE3d) [Difficulty: ELE: R; WRE: Ap, An]
b. Interpret the results from the procedure (Code: IB10c, IIIE4e) [Difficulty: ELE: R, Ap; WRE: An]
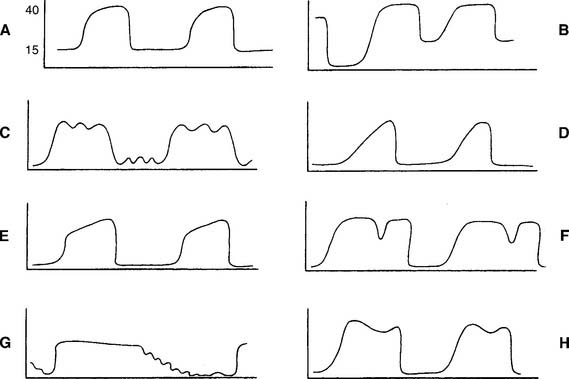
Review the components of a fast-speed capnography tracing in Figure 5-1 to understand a normal person’s expiratory pattern. Figure 5-7 shows eight different abnormal fast-speed capnography tracings. See the figure legend for an explanation of each problem. As the patient returns to normal, the tracing should approach that shown in Figure 5-1.
3. Arterial–residual volume alveolar carbon dioxide gradient
a. Perform the bedside procedure (Code: IB9c and IIIE3d) [Difficulty: ELE: R; WRE: Ap, An]
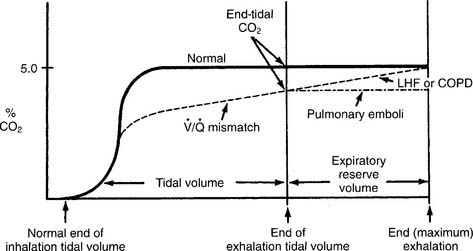
Have a cooperative patient exhale maximally to residual volume (RV) through the capnography unit. The graphic results will be similar to that shown in Figure 5-8. The usual P(a-RV)CO2 gradient in a healthy person is about 3 to 5 torr, and should be less than 7 torr. The wider the gradient, the greater is the ventilation to perfusion ( /
/ ) mismatching. A gradient of more than 13 torr is considered to be markedly abnormal. This may be the case in patients with chronic obstructive pulmonary disease (COPD), pulmonary emboli, left heart failure (LHF), or hypotension.
b. Interpret the results from the procedure (Code: IB10c, IIIE4e) [Difficulty: ELE: R, Ap; WRE: An]
When comparing the normal (solid line) tracing in Figure 5-8 with the  /
/ mismatching (dashed line) tracing, note the increased gradient at end-tidal CO2. With continued exhalation to residual volume, the left heart failure and COPD patients have a narrowing of the gradient. This can be used clinically to follow these patients’ progress and response to treatment. The patient with a large pulmonary embolism will not have such a narrowing of the gradient as he or she exhales to residual volume. This patient’s gradient will narrow to normal as the embolism is resolved and the physiologic dead space returns to normal.
Past exams have often had one question that requires the interpretation of capnography results, especially the end-tidal CO2 value (PetCO2). Examples include a change in alveolar ventilation, shallow breathing, and CPR attempt.
MODULE B
1. Review dead space to tidal volume data in the patient’s chart (Code: IA7e) [Difficulty: ELE: R; WRE: Ap]
2. Perform the bedside procedure (ELE Code: IB9l) [Difficulty: ELE: R, An]
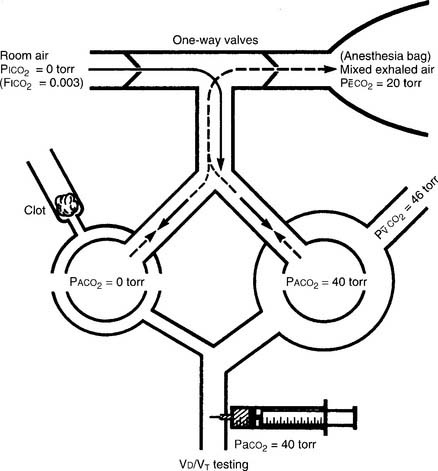
The procedure is the mathematical comparison of a person’s dead space volume with tidal volume. Steps in the traditional procedure follow (Figure 5-9):
a. Determine the decimal fraction or percentage of dead space
Place both carbon dioxide values into this formula, which is derived from the original Bohr formula:
VD/VT or VD the patient’s physiologic dead space
PaCO2 = the patient’s arterial carbon dioxide pressure
PĒCO2 = the patient’s average exhaled carbon dioxide pressure
The following example is based on an abnormal adult:
b. Determine the dead space volume
Place both carbon dioxide values into this formula, which is derived from the original Bohr formula:
VD VT or VD the patient’s physiologic dead space
VT = the average exhaled tidal volume
PaCO2 = the patient’s arterial carbon dioxide pressure
PĒCO2 = the patient’s average exhaled carbon dioxide pressure
The following example is based on a normal adult:
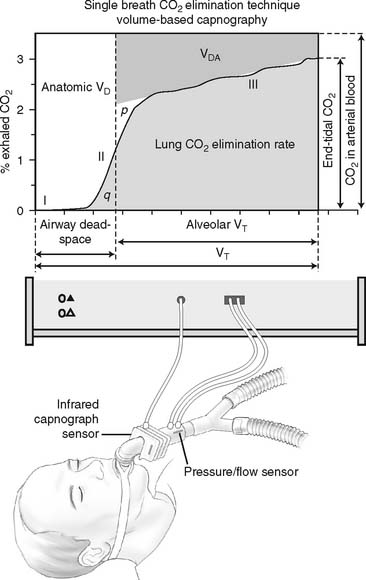
The recent advent of volumetric capnography technology allows the patient’s dead space to be rapidly determined. These units can simultaneously measure the patient’s exhaled tidal volume and the variable percentage of carbon dioxide found during the exhalation (Figure 5-10). The computer that is integrated with the volumetric capnography unit then calculates the volume of dead space as a fraction of the exhaled tidal volume. Figure 5-11 shows how volumetric capnography can be set up to measure the dead space of a patient requiring mechanical ventilation. This technology permits the rapid assessment of a patient as treatment is being performed. For example, if a patient had a large pulmonary embolism resulting in significant dead space, a clot-dissolving medication such as streptokinase (Kabikinase or Streptase) or alteplase (Activase) would be given. These “clot buster” medications will rapidly dissolve the patient’s pulmonary embolism. With volumetric capnography, the dead space volume can be monitored as it normalizes when blood flow through the lungs is restored.
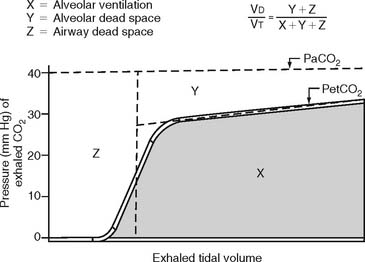
Figure 5-10 A graphic representation of the factors involved in the calculation of a patient’s dead space volume, or dead space to tidal volume (VD/VT) ratio, through volumetric capnography. These units can measure exhaled carbon dioxide (by pressure or percentage) at time intervals as the patient’s tidal volume is exhaled. Review Figure 5-1, as needed, for a normal capnograph tracing.
3. Interpret the results of the VD/VT calculation (Code: IB10l) [Difficulty: ELE: R, Ap; WRE: An]
Physiologic dead space is composed of the following:
The following conditions or pulmonary disorders can cause the ratio to vary from the normal range:
a. Decreased VD/VT ratio
c. Increased dead space effect with ventilation greater than perfusion ( >
>  )
)
MODULE C
1. Blood pressure
b. Recommend blood pressure measurement to obtain additional data (Code: IC11) [Difficulty: ELE: R, Ap; WRE: An]
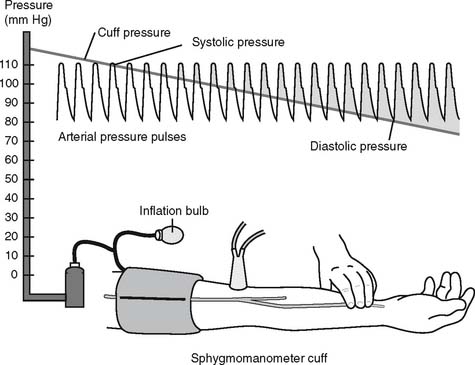
c. Perform blood pressure measurement (Code: IB9m, IIIE3e) [Difficulty: ELE: R, Ap; WRE: An]
The general steps in measuring blood pressure were described in Chapter 1. The BP is usually measured on either of the patient’s arms. Necessary equipment includes the proper size of blood pressure cuff, a sphygmomanometer to measure the pressure, and a stethoscope to hear the sounds of bloodflow returning through the brachial artery. Figure 5-12 shows the basic elements of the procedure. The cuff is inflated to a pressure that is greater than the patient’s systolic pressure. As the pressure in the cuff is gradually decreased, the first sound heard (Korotkoff sounds) is the systolic pressure. The pressure reading at which this sound ceases is the diastolic pressure. Blood pressure measurement can usually be performed manually by a respiratory therapist or other trained health care professional. If BP measurement is needed on a frequent basis, an automated blood pressure measurement system can be set up on the patient’s arm. This unit can be programmed to measure the BP on a schedule and can also have high and low blood pressure alarm limits established as a safety feature.
e. Interpret the results of the blood pressure measurement (Code: IB10m, IIIE4c) [Difficulty: ELE: R, Ap; WRE: An]
Review the general discussion on blood pressure in Chapter 1. The following are normal blood pressure values:
Patients who have values that are higher or lower than these should be further evaluated. Know the following values since they represent a serious patient problem:
2. Central venous pressure (CVP) monitoring
a. Review central venous pressure measurement data in the patient’s chart (Code: IA8b) [Difficulty: ELE: R; WRE: Ap]
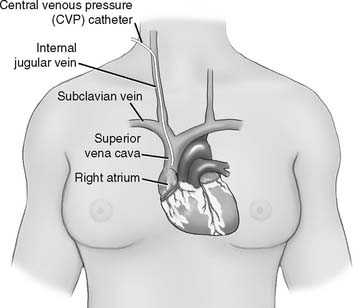
The central venous pressure (CVP) is the pressure measured in a patient’s superior vena cava, just above the right atrium. See Figure 5-13. Review previous patient data to understand whether there is an abnormality. Compare the current data with the earlier information to determine if there has been a change in the patient’s condition. See Box 5-2 for normal values.
b. Recommend the insertion of a central venous pressure catheter to obtain additional data (WRE code: IC12) [WRE Difficulty: R, Ap, An]
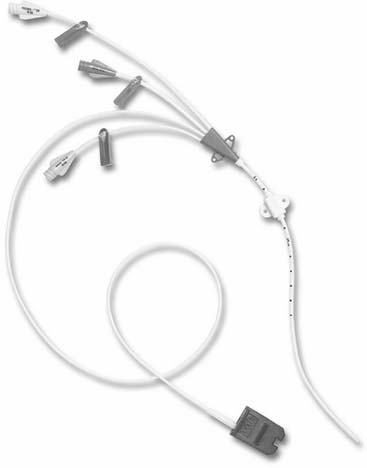
A single-lumen central venous pressure catheter (also called a CVP line) is inserted into many patients for one or more reasons: (1) to monitor the patient’s right-sided (right atrium) heart pressure, (2) to rapidly administer a large volume of intravenous fluids, and (3) to administer cardiac medications during a CPR attempt (preferred route). Recently, the development of a triple-lumen CVP catheter with integrated fiberoptic channel (Edwards Lifesciences, LLC) has enabled the continuous monitoring of central venous oxygen saturation (ScvO2), in addition to the previously mentioned uses. See Figure 5-14.
c. Recommend central venous pressure measurement to obtain additional data (Code: IC11) [Difficulty: ELE: R, Ap; WRE: An]
d. Perform central venous pressure measurement (Code: IB9e) [Difficulty: R, Ap, An]
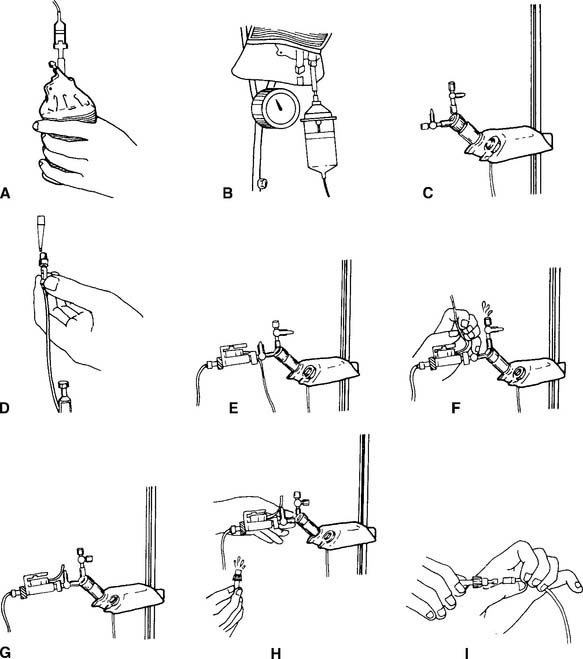
The catheter is usually inserted into the right jugular vein or right subclavian vein and advanced to just above the superior vena cava. When set up for monitoring pressure, it measures the right atrial pressure (see Figure 5-15 for how to perform the procedure). Note that the stopcock must be kept at the midchest (midheart) level. Usually a mark is placed at this location (on the patient’s chest) for consistency. Raising the stopcock above the mark results in an incorrectly low reading. Lowering the stopcock below the mark results in an incorrectly high reading. See Figure 5-16. Clinical practice is very important in learning how to perform this procedure. It is important that the patient breathes spontaneously if at all possible. Peak pressures during inspiration on a mechanical ventilator may artificially raise the CVP reading. Positive end-expiratory pressure (PEEP) may also raise the CVP reading. If the patient cannot be removed from the ventilator, take the reading during exhalation. Make a note of the settings and that the reading was taken with the patient on the ventilator. Record the data in the patient’s chart or flow sheet.
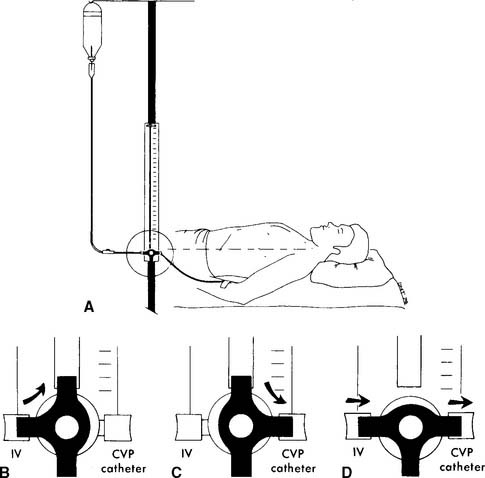
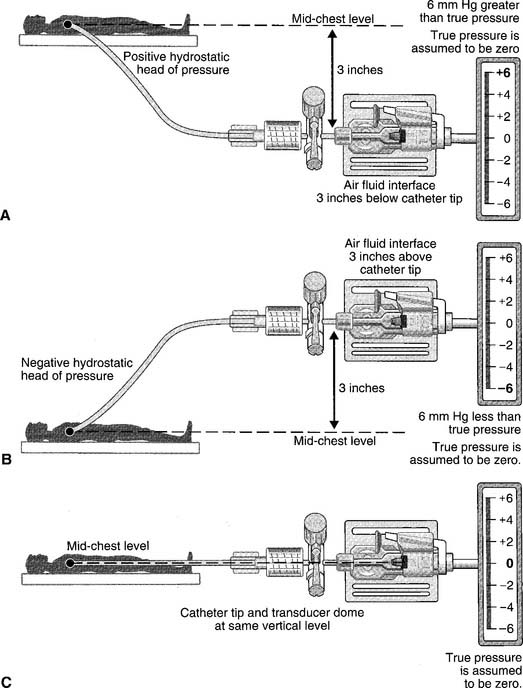
Past exams have asked about the proper placement of the CVP stopcock or arterial pressure transducer at the midchest (midheart) location to ensure accurate pressure measurements. Usually a mark is placed on the patient’s chest for a consistent measurement point. Review Figure 5-16 for the effects of misplacement.
Past exams have asked about the proper placement of the CVP stopcock or arterial pressure transducer at the midchest (midheart) location to ensure accurate pressure measurements. Usually a mark is placed on the patient’s chest for a consistent measurement point. Review Figure 5-16 for the effects of misplacement.
e. Interpret the results of the central venous pressure measurement (Code: IB10m, IIIE4c) [Difficulty: ELE: R, Ap; WRE: An]
As noted earlier, the CVP is a measure of the pressure in the right atrium. The two main factors that influence the right atrial pressure are the blood volume returning to it and the functioning of the right ventricle (see Box 5-2 for normal CVP readings).
Memorize the values listed in Box 5-2. Expect to see several questions in which these values are used as patient data or as options to answer a question. The normal values must be understood to identify abnormal values and know why they are abnormal.
Memorize the values listed in Box 5-2. Expect to see several questions in which these values are used as patient data or as options to answer a question. The normal values must be understood to identify abnormal values and know why they are abnormal.
3. Pulmonary artery pressure monitoring
a. Review pulmonary artery pressure data in the patient’s chart (Code: IA8b) [Difficulty: ELE: R; WRE: Ap]
The pulmonary artery pressure (PAP) is the systolic and diastolic pressure found in either pulmonary artery. It can be measured only through a pulmonary artery catheter. (The NBRC often refers to this as a flow-directed pulmonary artery catheter.) Review the patient’s previous values before taking another pressure reading to make a comparison. Box 5-2 shows normal cardiopulmonary values.
b. Recommend the insertion of a pulmonary artery catheter for additional data (WRE code: IC12) [WRE Difficulty: R, Ap, An]
To read the PAP, a pulmonary artery catheter (PAC) must be inserted through a vein and passed through the right atrium and right ventricle into the pulmonary artery. The common insertion sites, in descending order of preference, are the basilic vein in either the right or the left arm, the right internal jugular or subclavian vein, or the right or left femoral vein. The pulmonary artery catheter is also commonly called a Swan-Ganz catheter after the inventors who gave their names to a particular brand. The catheters are available in different lengths and diameters for pediatric and adult patients. See Figure 5-17 for a typical adult catheter.
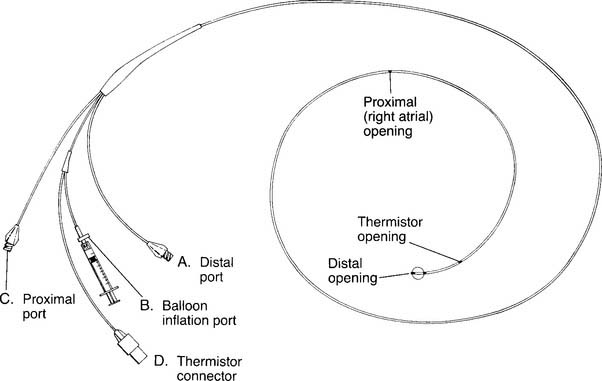
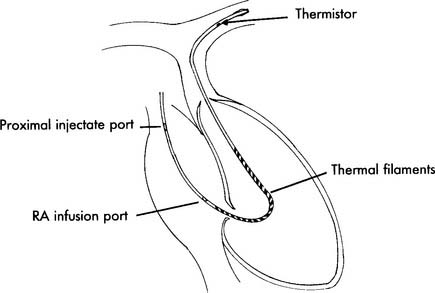
 O2 determination. B, Balloon inflation port is used to inflate the balloon for inserting the catheter and for obtaining a PCWP reading. C, Proximal port is used for measuring central venous pressure and for injecting iced saline for a thermodilution cardiac output study. The iced saline exits from the right atrial opening. D, Thermistor connector attaches to the cardiac output computer. A bimetallic wire runs through the catheter to the thermistor opening, where it is exposed to temperature changes of the blood and cold injectate. (NOTE: Not all catheters are capable of measuring cardiac output. Some catheters have other special features such as continuously measuring venous saturation or cardiac pacemaker leads.)
c. Recommend pulmonary artery pressure measurement to obtain additional data (Code: IC11) [Difficulty: ELE: R, Ap; WRE: An]
d. Perform pulmonary artery pressure measurement (Code: IB9m, IIIE3e) [Difficulty: ELE: R, Ap; WRE: An]
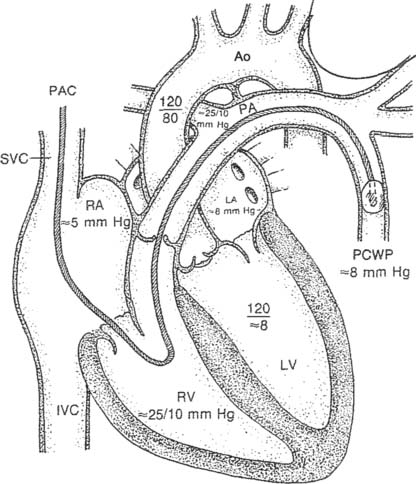
Figure 5-17 is an illustration of a 7-French quadruple-lumen thermodilution pulmonary artery catheter. Besides measurement of PAP, it is capable of being used to measure cardiac output. Figure 5-18 illustrates how a pulmonary artery catheter could be arranged with a pressure transducer and pressure monitor. Figure 5-19 shows a representation of the series of pressure waveforms seen as the catheter is advanced through the heart and into the wedged position in a branch of the pulmonary artery. Figure 5-20 shows a larger cutaway view of the heart with a PAC and normal heart chambers and related pressures.
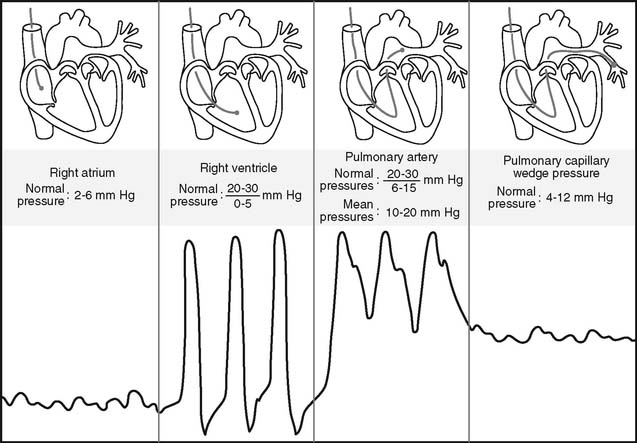
e. Interpret the results of pulmonary artery pressure measurement (Code: IB10m, IIIE4c) [Difficulty: ELE: R, Ap; WRE: An]
Again, the PAP is the systolic and diastolic pressure found in the pulmonary artery (see Box 5-2 for normal values). Elevated PAP values are usually seen with the following conditions:

It can be concluded that this person’s PAd-PCWP gradient is normal.

It can be concluded that this person’s PAd-PCWP gradient is elevated.
Decreased pulmonary artery pressure values are not frequently seen. Patients with hypovolemic shock, anaphylaxis (allergic shock), or excessive use of vasodilating drugs may have a decreased pulmonary artery pressure. The most obvious clinical sign in these patients is a low systemic blood pressure.
4. Pulmonary capillary wedge pressure monitoring
a. Review pulmonary capillary wedge pressure data in the patient’s chart (Code: IA8b) [Difficulty: ELE: R; WRE: Ap]
The pulmonary capillary wedge pressure (PCWP) refers to the pressure measured in the pulmonary capillary bed under no-flow conditions. It is important to review previous patient data before measuring another pressure. Normal values are listed in Box 5-2.
b. Recommend pulmonary capillary wedge pressure measurement to obtain additional data (Code: IC11) [Difficulty: ELE: R, Ap; WRE: An]
c. Perform pulmonary capillary wedge pressure measurement (Code: IB9m, IIIE3e) [Difficulty: ELE: R, Ap; WRE: An]
A pulmonary artery catheter must be placed into a patient’s pulmonary artery for the PCWP to be measured. The PCWP is obtained by inflating the balloon at the tip of the catheter. This obstructs that branch of the pulmonary artery so that the downstream pressure from the left ventricle is seen on the monitor (see Figures 5-19 and 5-20). The balloon volume varies with the diameter of the catheter. The necessary volume is printed on the catheter near where the air is injected into the balloon. For example, the 5-French catheter balloon holds 0.8 mL of air and the 7-French catheter balloon holds 1.5 mL of air. It is important to inject only the required amount of air. Overinflating may burst the balloon or rupture the pulmonary artery. If the balloon wedges at less than the required volume, the catheter is probably too far down in the artery and may need to be withdrawn a short distance. The balloon is only inflated long enough to obtain the PCWP and then the balloon is deflated. Pulmonary infarction will occur if the balloon is left inflated and the blood in the pulmonary artery is stagnant and allowed to clot. Record the PCWP value in the patient’s chart or flow sheet.
d. Interpret the results of pulmonary capillary wedge pressure measurement (Code: IB10m, IIIE4c) [Difficulty: ELE: R, Ap; WRE: An]
5. Cardiac output
a. Review cardiac output data in the patient’s chart (Code: IA8b) [Difficulty: ELE: R; WRE: Ap]
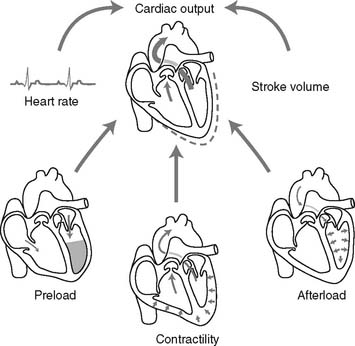
Cardiac output (CO) is the volume of blood pumped in 1 minute. It is calculated as the product of heart rate (HR) for 1 minute and stroke volume (SV): (CO = HR × SV). CO is a measurement of the heart’s pumping ability to meet the body’s needs. As always, review previous data before repeating the test. Box 5-2 lists normal values.
b. Recommend a cardiac output measurement to obtain additional data (Code: IC11) [Difficulty: ELE: R, Ap; WRE: An]
A cardiac output measurement is performed on patients with serious cardiovascular disease to assess the condition of the heart. A major change in vital signs or new cardiovascular treatment justifies a measurement. See Figure 5-21 for the interplay of factors that can impact a patient’s cardiac output. To measure CO, the patient must have a pulmonary artery catheter in place that is capable of measuring cardiac output.
c. Perform a cardiac output measurement (Code: IB9m, IIIE3e) [Difficulty: ELE: R, Ap; WRE: An]
The first type of thermodilution catheter is used to inject a cool solution into the heart. This cool solution is diluted with the patient’s blood. As the blood and cool solution mix passes a thermistor at the catheter tip, the computer calculates the patient’s cardiac output based on the time required to pump the cooler blood past the thermistor (see Figure 5-17).
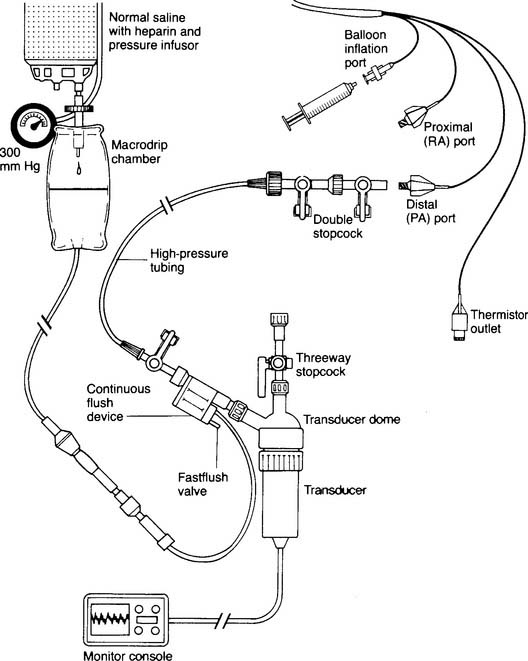
This procedure requires an injectable saline solution or a 5% dextrose, ice-water bath to cool the injectate, necessary tubing and connections, thermometer, 10-mL syringes, and injector system (Figure 5-22). It is beyond the scope of this text to describe all of the steps in the different types of adult and neonatal thermodilution cardiac output procedures. Hands-on experience is necessary. Only the most important and common features are presented here:
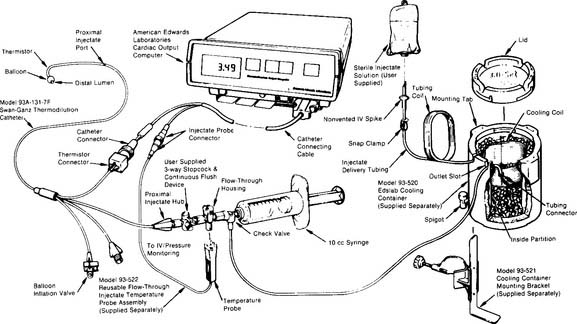
Figure 5-22 Complete system for performing thermodilution cardiac output studies.
(From Edwards Lifesciences LLC, Irvine, Calif, 1985.)
The second type of thermodilution cardiac output catheter uses a thermal filament (a heated wire) that wraps around the catheter (Figure 5-23). With this catheter, the computer periodically directs electricity to the filament. This results in periodic warming of the blood from the heated wire. The computer calculates the patient’s cardiac output by determining the time needed to pump the heated blood past the thermistor at the tip of the catheter. The advantages of the “heated wire” cardiac output catheter are that it gives an updated cardiac output value every 30 seconds, requires no additional time from the nurse or respiratory therapist after the initial setup, and does not add any additional fluid to the patient’s intake.
d. Calculate the patient’s cardiac output value (ELE code: IB9l) [Difficulty: ELE: R, Ap]
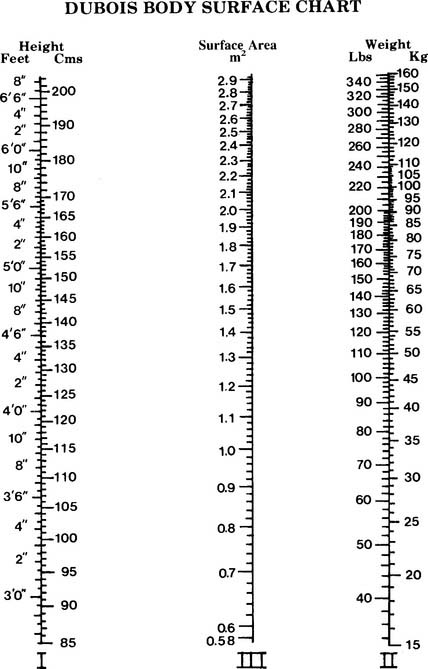
BSA is the body surface area and can be calculated mathematically or determined from a data table (Figure 5-24). See the following discussion on cardiac index for information on calculating BSA.
The following two methods can be used to calculate the patient’s cardiac output:
e. Interpret the results of the patient’s cardiac output measurement (Code: IB10l) [Difficulty: ELE: R, Ap; WRE: An]
As listed in Box 5-2, the healthy, resting adult has a cardiac output in the range of 4 to 8 L/min and a healthy, resting neonate has a cardiac output in the range of 0.6 to 0.8 L/min.
6. Stroke volume
b. Recommend a stroke volume measurement to obtain additional data (Code: IC11) [Difficulty: ELE: R, Ap; WRE: An]
A stroke volume (and cardiac output) measurement is performed on patients with serious cardiovascular disease to assess the condition of the heart. A major change in vital signs or new cardiovascular treatment justifies a measurement. As shown in Figure 5-21, preload, contractility of each ventricle, and afterload can impact a patient’s stroke volume.
c. Calculate the patient’s stroke volume (ELE code: IB9l) [Difficulty: ELE: R, Ap]
The normal stroke volume is based on a person’s age. See Box 5-2 for normal values. Stroke volume can be determined through a cardiac ultrasound procedure or can be calculated from the patient’s heart rate and cardiac output measurements.
7. Cardiac index
b. Recommend a cardiac index measurement to obtain additional data (Code: IC11) [Difficulty: ELE: R, Ap; WRE: An]
c. Calculate the patient’s cardiac index value (ELE code: IB9l) [Difficulty: ELE: R, Ap]
Since CI is the cardiac output per square meter of body surface area, both cardiac output and body surface area must be known. Cardiac output is usually measured by the thermodilution cardiac output method via a special pulmonary artery catheter. The body surface area (BSA) can be determined from the DuBois Body Surface Chart as shown in Figure 5-24. The body surface area can also be determined with the following equation:

8. Mixed venous blood sampling
a. Review mixed venous oxygen data in the patient’s chart (Code: IA8b) [Difficulty: ELE: R; WRE: Ap]
 O2) and the saturation of mixed venous oxygen (S
 O2) represent tissue oxygenation. This is because the blood has returned from the body after having some of its oxygen extracted. (Remember that Pa
 O2 or ScvO2 value(s) should be reviewed before performing another measurement.
b. Recommend a mixed venous oxygen measurement to obtain additional data (Code: IC11) [Difficulty: ELE: R, Ap; WRE: An]
 O2, S
O2, S O2, and ScvO2 values are often seen in patients with heart failure because the slow flow of blood through the tissues results in more oxygen being extracted. In addition, P
 O2 and S
 O2 values are needed to calculate a patient’s arterial-venous oxygen content difference or shunt percentage.
c. Perform mixed venous oxygen measurement (Code: IB10m, IIIE4c) [Difficulty: ELE: R, Ap; WRE: An]
 O2) value (and the other blood gas values as well). There are currently three methods of performing the bedside procedure.
 O2 and S
 O2 values are the same in all blood samples. The patient with a ventricular septal defect shows a significant increase in P
 O2 and S
 O2 values when measurements are taken from the right atrium to the right ventricle and pulmonary artery. This is because the oxygenated blood from the left ventricle is forced though the ventricular septal defect to raise the oxygen value of the right ventricular blood.
2. Use a pulmonary artery catheter with reflectance oximetry capability
These catheters have fiberoptic bundles built into them and use technology similar to that used in pulse oximeters. See Figure 5-25. The processing unit sends two narrow wavebands of light down the transmitting fiberoptic bundle to be illuminated on the passing blood in the pulmonary artery. Oxyhemoglobin in the red blood cells absorbs some of the light. The rest is reflected. The receiving fiberoptic bundle picks up some of this light and transmits it back to the monitoring unit.
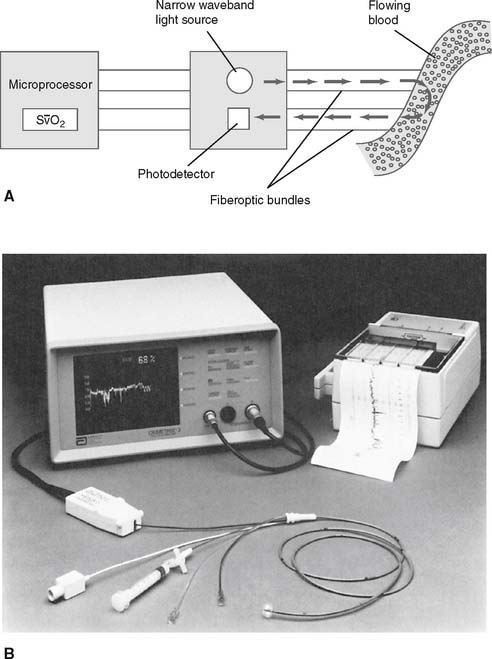
 O2) can be monitored continuously by reflection spectrophotometry (spectroscopy) in the appropriate pulmonary artery catheter. (Note that the same technology is used in a CVP catheter that measures continuous central venous oxygen saturation [ScvO2].) A, Detail of the fiberoptic bundles in the catheter. Specific wavelengths of light are directed at passing blood. Some of the light is absorbed by the passing red blood cells and some is reflected back to the photodetector. The microprocessor calculates the percentage S
 O2. B, Components of the system include (1) microprocessor that connects to the catheter, displays the S
 O2 % values, and has high and low saturation alarms; (2) strip-chart recorder to copy the saturation values over time; and (3) fiberoptic reflective spectroscopy-type pulmonary artery catheter. The catheter can also be used for measuring pulmonary artery pressure, pulmonary capillary wedge pressure, and cardiac output; and for obtaining a mixed venous blood gas sample.
 O2 is determined by the monitoring unit based on the light waves that were transmitted and received. Care must be taken when using this catheter in patients with elevated carboxyhemoglobin or methemoglobin levels. As with pulse oximetry, COHb and MetHb will be interpreted as oxyhemoglobin. Thus inaccurately high readings will be seen.
 O2 value will drop or fluctuate dramatically. The alarms should warn the clinician of a problem with the equipment.
3. Use the distal lumen of a “standard” pulmonary artery catheter
A true mixed venous blood sample is obtained by withdrawing blood from the distal lumen of the catheter. This is the same lumen that is used for the PAP and PCWP readings. Using sterile technique, a 5- to 10-mL syringe is used to withdraw the heparinized solution in the lumen until about 1 to 2 mL of blood are removed. A second preheparinized syringe is then used to withdraw about 2 mL of mixed venous blood. It is important to withdraw the intravenous (IV) solution and blood at a rate no faster than 0.5 mL per second. Withdrawing at a faster rate can pull preoxygenated blood back through the capillary bed and give falsely elevated oxygen values. After sampling the blood, the lumen must be fast-flushed with the heparinized solution to prevent the blood from clotting (see Figure 5-18). Flush for several seconds until the solution flows freely. This blood sample may be reliably analyzed for S O2, P
O2, P O2, and P
 CO2 values.
 O2 and P
 O2 values from a PAC. In other words, if the patient’s S
 O2 and/or P
 O2 values increase (or decrease) so will the ScvO2 values. However, because the ScvO2 values are less consistent than true mixed venous oxygen values, the patient’s clinical goal for ScvO2 monitoring is >70% saturation.
d. Interpret the results of the mixed venous blood measurement (Code: IB10m, IIIE4c) [Difficulty: ELE: R, Ap; WRE: An]
This topic is discussed in some detail in Chapter 3. The normal values follow:
True mixed venous blood oxygen values are useful for monitoring the patient’s oxygen consumption. The most accurate methods of calculating percent shunt and cardiac output (Fick method) use mixed venous blood oxygen values with arterial blood oxygen values. A P O2 value of less than 30 torr or an S
 O2 value of less than 56% is considered to show tissue hypoxemia. Quick steps must be taken to reverse this. Increase the inspired oxygen percentage as needed. Low stroke volume and cardiac output measurements can be increased by giving digoxin (Lanoxin) or other inotropic agents. Low blood pressure can be increased by administering vasopressors such as dopamine hydrochloride (Intropin).
9. Arterial-venous oxygen content difference
a. Review arterial-venous oxygen content difference data in the patient’s chart (Code: IA8b) [Difficulty: ELE: R; WRE: Ap]
The arterial-venous oxygen content difference [C(a-v)O2] is a calculation of oxygen consumption by the body. It is the difference between the oxygen content of arterial blood and the oxygen content of mixed venous blood. Box 5-2 lists normal values. As always, check previous values to compare with present values to determine if the patient’s condition has changed.
b. Recommend an arterial-venous oxygen content measurement to obtain additional data (Code: IC11) [Difficulty: ELE: R, Ap; WRE: An]
c. Perform the arterial-venous oxygen content difference measurement (Code: IB9m, IIIE3e) [Difficulty: ELE: R, Ap; WRE: An]
The following steps must be performed to make the arterial-venous oxygen content calculation:
d. Calculate the patient’s arterial-venous oxygen content difference (ELE code: IB9l) [Difficulty: ELE: R, Ap]
CaO2 =(Hb×1.34×Sao2 × 0.003)
 O2 = the content of oxygen in mixed venous blood = vol % of oxygen in mixed venous blood:
C o2 =(Hb ×1.34 ×S
 o2) + (P
 o2 × 0.003)
 )o2 = Cao2 − C


e. Interpret the results of the patient’s arterial-venous oxygen content difference (Code: IB10l) [Difficulty: ELE: R, Ap; WRE: An]
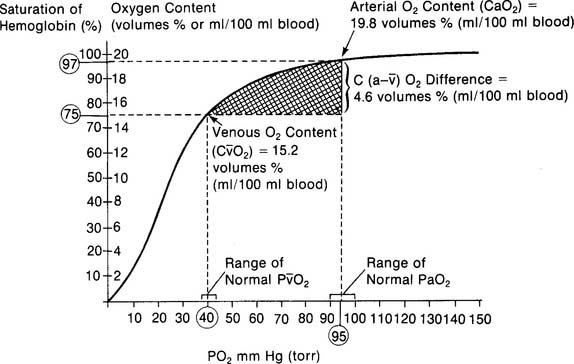
The normal range for the C(a- )O2 difference is 3 to 5.5 vol %. Measurements in this range show normal levels of oxygen consumption by the tissues, cardiac output, and cardiopulmonary function. (See Figure 5-26 for a graphic presentation of C(a-
 )O2 on the oxyhemoglobin dissociation curve.) A C(a-
 )O2 difference of greater than 5.5 to 6 vol % is seen in patients with a low cardiac output. As the blood flows more slowly than normal through the tissues, more oxygen is consumed per mL of blood. The S
 O2 and P
 O2 values drop and the C(a-
 )O2 difference widens.
 )O2 difference of less than 4 vol % in the healthy patient commonly indicates good cardiovascular reserve with an increased cardiac output. As the blood flows more quickly than normal through the tissues, less oxygen is consumed per mL of blood. The S
 O2 and P
 O2 values increase and the C(a-
 )O2 difference narrows. The septic patient may have a narrowed C(a-
 )O2 difference because of peripheral shunting and decreased oxygen consumption by the tissues caused by the infection. The C(a-
 )O2 difference is necessary to accurately calculate the percent of pulmonary shunting as discussed next.
10. Shunt study
a. Review shunt study data in the patient’s chart (Code: IA8b) [Difficulty: ELE: R; WRE: Ap]
Shunt ( s/
s/ t) is the amount of blood pumped by the heart that passes through the lungs but does not participate in gas exchange. A pulmonary artery catheter must be inserted into the patient for a shunt study to be performed. Review previous (
 s/
s/ t) study results and compare with current information to see if there has been a change in the patient’s status. See Box 5-2 for normal values.
b. Recommend a shunt study measurement to obtain additional data (Code: IC11) [Difficulty: ELE: R, Ap; WRE: An]
d. Calculate the patient’s shunt percentage (ELE code: IB9l) [Difficulty: ELE: R, Ap]
 O2, and C(a-
 )O2.
)O2. O2, and C(a-
 )O2.
)O2.1. Modified clinical shunt equation
 )o2 The oxygen content of arterial blood minus the oxygen content of mixed venous blood
Modified clinical shunt equation
PB = Localbarometricpressure;760torr for sea level inthisexample
PH2O 47 torr; water vapor pressure in the lungs at normal body temperature
FIo2 = inhaled oxygen percent of 100% or 1.0


0.8 = The normal respiratory quotient (An exact value can be determined by a metabolic study.)
15 g/dL = The patient’s hemoglobin concentration
0.003 = The oxygen-carrying capacity of blood plasma per torr Po2
2. Classic shunt equation
This equation is widely used because of the clinical limitations of the clinical shunt equation:
Cco2 The content of oxygen in the end pulmonary capillary blood
Cao2 = The content of oxygen in the arterial blood
C O2 = The content of oxygen in the mixed venous blood
 O2 and S
 O2 levels in both of these equations. An arterial blood gas sample is also needed. There are clinical situations in which either of these equations will work and will result in the same answer.
Classic shunt equation
PB = Local barometric pressure; 760 torr for sea level in this example
PH2o 47 torr; water vapor pressure in the lungs at normal body temperature
FIo2 = Inhaled oxygen percent of 30% or 0.3


0.8 = The normal respiratory quotient (An exact value can be determined by a metabolic study.)
15 g/dL = The patient’s hemoglobin concentration
0.003 = The oxygen-carrying capacity of blood plasma per torr Po2

11. Pulmonary vascular resistance
a. Review pulmonary vascular resistance data in the patient’s chart (Code: IA8b) [Difficulty: ELE: R; WRE: Ap]
b. Recommend a pulmonary vascular resistance measurement to obtain additional data (Code: IC11) [Difficulty: ELE: R, Ap; WRE: An]
c. Perform the pulmonary vascular resistance measurement (Code: IB9m, IIIE3e) [Difficulty: ELE: R, Ap; WRE: An]
12. Systemic vascular resistance
a. Review systemic vascular resistance data in the patient’s chart (Code: IA8b) [Difficulty: ELE: R; WRE: Ap]
b. Recommend a systemic vascular resistance measurement to obtain additional data (Code: IC11) [Difficulty: ELE: R, Ap; WRE: An]
c. Perform a systemic vascular resistance measurement (Code: IB9m, IIIE3e) [Difficulty: ELE: R, Ap; WRE: An]
MODULE D
1. Manipulate capnography equipment by order or protocol (Code: IIA26) [Difficulty: ELE: R; WRE: Ap, An]
a. Get the necessary equipment for the procedure
As discussed earlier, a capnograph is used to measure a patient’s exhaled carbon dioxide level and expiratory pattern. There are two different types of capnography systems. Their main difference is in how the gas is sampled from the patient. Figure 5-3 shows the patient connection for a mainstream capnograph. Figure 5-4 shows a sidestream capnograph. Both work equally well if the patient is intubated. The capnography connector is attached between the endotracheal tube and the ventilator circuit or T-piece (Brigg’s adapter). The sidestream unit may also be used with a spontaneously breathing patient because the capillary tube may be taped into a patient’s nostril for gas sampling.
b. Put the equipment together and make sure that it works properly
The following are components of a capnography system:
2. Manipulate pressure transducers by order or protocol (WRE: code: IIA20a) [Difficulty: WRE: R, Ap, An]
b. Put the equipment together and make sure that it works properly
A disposable, sterile, clear plastic dome should be firmly attached to the transducer. Noncompliant pressure tubing should connect the transducer with the patient’s arterial or pulmonary artery catheter. The automatic fluid drip system (Sorenson) should be pressurized to 300 mm Hg. Heparin must be added to the fluid (usually normal saline) to prevent clotting in the patient’s catheter. Because this is a continuous fluid “plumbing” system, all connections must be tightly joined to be watertight. There must be a continuous flow of fluid through the tubing system and into the patient’s blood vessel. Any air bubbles must be removed or the measured pressure reading will be lower than the actual reading (see Figures 5-18 and 5-27).
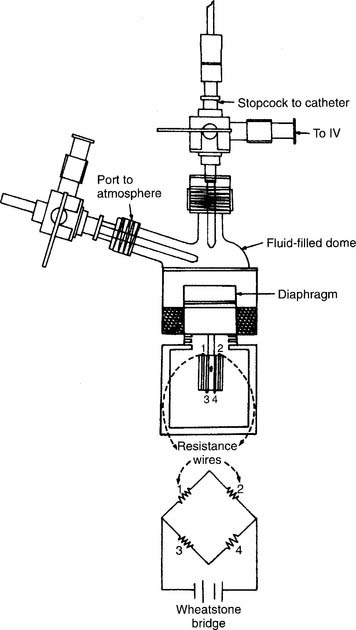
The transducer must be kept at the patient’s midchest (midheart) level during calibration and measurement. Calibrate the electronics in the monitor by placing known pressures against the fluid system. The electronics should first be adjusted to “zero” pressure by opening the transducer to room air (atmospheric pressure). Adjust the electronic controls as needed. A sphygmomanometer is then used to pressurize the fluid system. A pulmonary artery catheter system is pressurized to relatively low pressures such as 30 and 50 mm Hg. An arterial system is adjusted to higher pressures such as 100 and 150 mm Hg. The monitored pressure should match the sphygmomanometer pressure. If not, adjust the electronic controls on the monitor to match.
3. Manipulate central venous catheters by order or protocol (WRE code: IIA20b) [Difficulty: WRE: R, Ap, An]
b. Put the equipment together and make sure that it works properly
See Figure 5-15 for the traditional assembly of the equipment and the procedure for measuring the central venous pressure (CVP). The equipment must be properly calibrated to ensure that the data are accurate. Calibrating a central venous pressure water-column manometer usually involves only making sure that it reads zero at atmospheric pressure.
4. Indwelling arterial catheters (WRE code: IIA20b) [Difficulty: WRE: R, Ap, An]
a. Get the necessary equipment for the procedure
b. Put the equipment together and make sure that it works properly
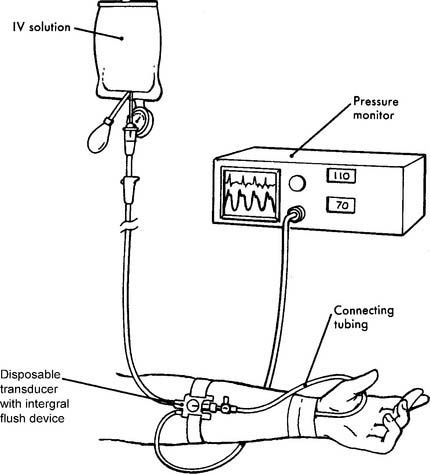
See Figures 5-18 and 5-28 for illustrations of how the pressure transducer, connecting tubing, stopcocks, infusion system, and monitoring electronics are assembled. See Figure 5-29 for a completed radial artery system. Clinical experience is needed with these types of systems.
c. Troubleshoot any problems with the equipment
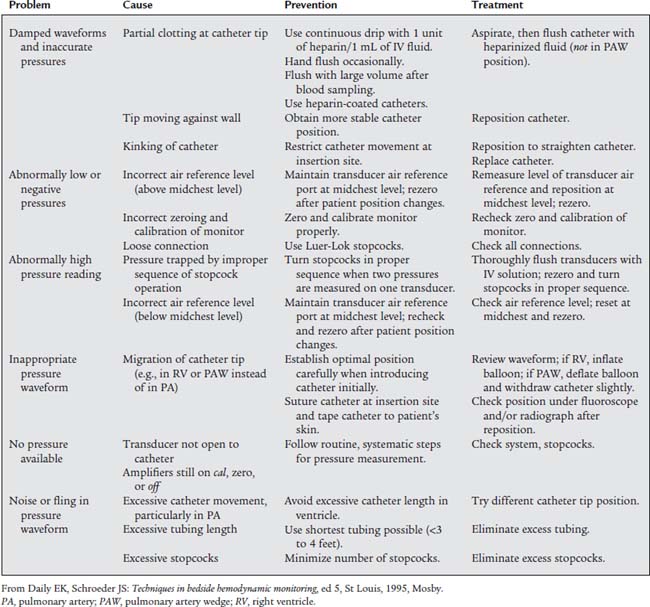
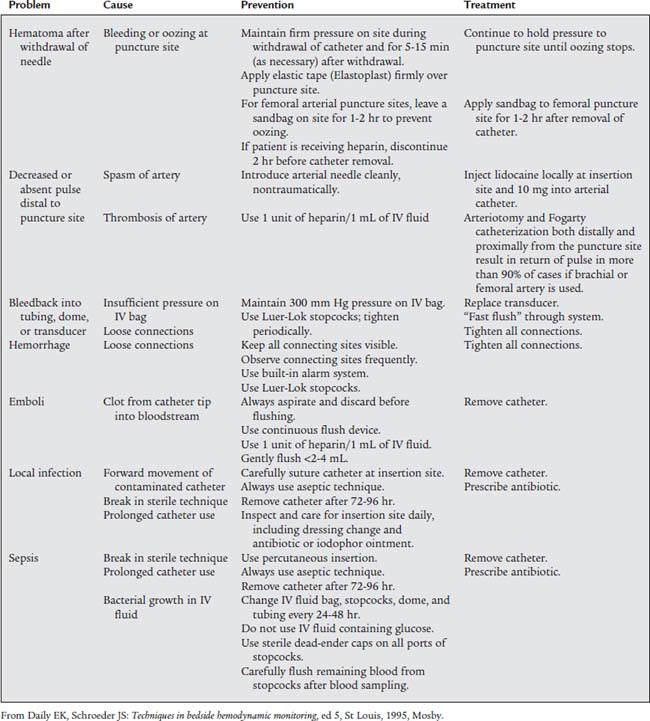
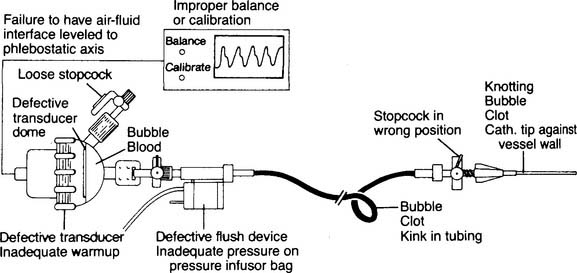
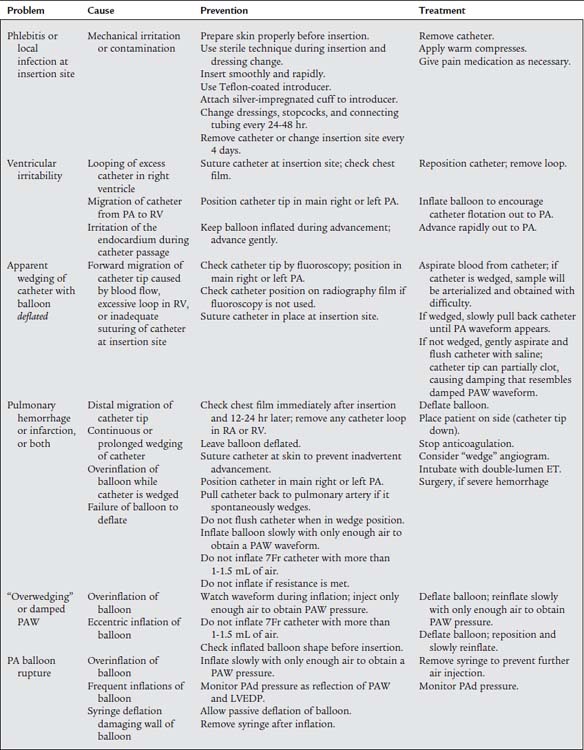
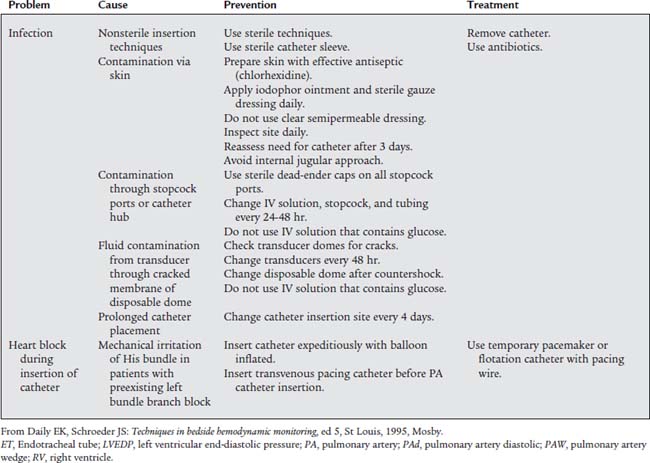
Table 5-1 lists problems, causes, prevention, and treatment for inaccurate pressure measurements with arterial or pulmonary artery catheters. Table 5-2 specifically lists problems with arterial lines. Figure 5-30 shows common problem areas with arterial lines. Pulmonary artery catheters can have problems in the same areas.
d. Perform arterial line insertion (Code: IB9s) [Difficulty: ELE: R, Ap; WRE: An]
The most widely used arterial line insertion site is the radial artery in the patient’s nondominant hand. The procedure for inserting a radial arterial line is very similar to the procedure for drawing a blood sample from the radial artery. See Chapter 3 to review the procedure. As presented previously, the necessary fluid infusion system and pressure monitoring system must be assembled and working properly. A significant difference is the use of a needle with covering catheter, rather than a needle and syringe, to puncture the artery (Figure 5-31). As the needle and catheter enter the artery, bright red blood will pulse out. In rapid succession, withdraw the needle and advance the catheter into the artery (Figure 5-32). Place a gloved fingertip over the proximal hub of the catheter to stop the bleeding. Next, screw the prepared three-way stopcock and high-pressure tubing to the hub of the catheter. Flush some heparinized saline solution through the arterial catheter to prevent any blood from clotting. Make sure the automatic drip system and arterial pressure monitoring system are working properly. The patient’s blood pressure should be displayed on the monitor (see Figures 5-28 and 5-29).
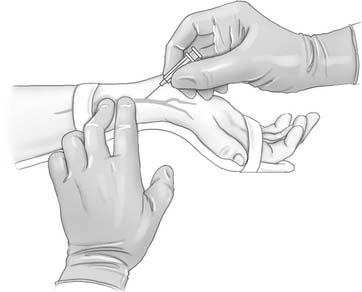
Figure 5-31 Proper positioning of the patient’s hand enables the respiratory therapist to insert a needle and covering catheter into the radial artery for the continuous measurement of blood pressure. The therapist is about to insert the needle with catheter (cannula) into the patient. Steps in the cannulation procedure are very much the same as those for an arterial puncture as described in Chapter 3.
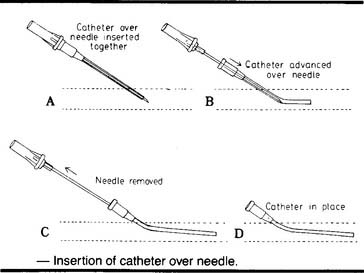
Figure 5-32 Steps in the procedure for the percutaneous insertion of an arterial catheter (cannula) for the continuous measurement of arterial pressure. Once the needle and catheter are inserted into the artery, the needle is withdrawn and the flexible catheter is advanced into the artery. The proximal end of the catheter is connected to a tubing circuit and pressure transducer as shown in Figures 5-28 and 5-29.
(From Oblouk Darovic G: Hemodynamic monitoring, Philadelphia, 1987, WB Saunders.)
5. Manipulate a pulmonary artery catheter by order or protocol (WRE code: IIA20b) [Difficulty: WRE: R, Ap, An]
a. Get the necessary equipment for the procedure
Pulmonary artery catheters are available in several diameter sizes. The smallest can be advanced into a pediatric patient’s vein. Most adults will have either a 5-French or a 7-French catheter inserted. Once the appropriate size is determined, select a catheter that provides the information that is needed. A standard 5-French catheter can be used to measure pulmonary artery pressure and pulmonary capillary wedge pressure, and a mixed venous blood sample can be withdrawn from it for analysis. A 7-French thermodilution cardiac output catheter can perform all the functions just mentioned and in addition provide a central venous pressure measurement and measure cardiac output through the computer (see Figures 5-17 and 5-22). A 7-French fiberoptic catheter can measure continuous S O2 as well as PAP, PCWP, CVP, and cardiac output by the thermodilution method. Mixed venous blood can also be sampled for analysis.
b. Put the equipment together and make sure that it works properly
The 5-French and 7-French catheters are packaged self-contained as a single unit. The general assembly of the related tubing circuit and pressure transducer was discussed earlier and illustrated in Figures 5-18 and 5-28. Clinical experience is needed. Make sure that all connections are watertight, the transducer calibrates accurately, and the balloon inflates and deflates properly.
6. Manipulate a cardiac output computer by order or protocol (WRE code: IIA20b) [Difficulty: WRE: R, Ap, An]
a. Get the correct cardiac output computer for the procedure
The manufacturers of cardiac output pulmonary artery catheters (e.g., Edwards Laboratories LLC) also make thermodilution cardiac output computers. However, the computer is usually designed only for use with their brand of catheter. Make sure that you have a compatible catheter and computer.
b. Put the equipment together and make sure that it works properly
Figure 5-17 shows a thermodilution cardiac output pulmonary artery catheter. Note the thermistor connection to the cardiac output computer and the proximal port where the cooled solution is injected. See Figure 5-22 for the assembly of the cardiac output computer to the catheter. In addition, the computer must be programmed with the size of catheter, injectate volume, and injectate temperature.
7. Manipulate a continuous mixed venous oxygen saturation monitor by order or protocol (WRE code: IIA20b) [Difficulty: WRE: R, Ap, An]
b. Put the equipment together and make sure that it works properly
See Figure 5-25 for a photograph of a continuous mixed venous oxygen saturation pulmonary artery catheter and its connection to the required monitor and analyzer. Make sure the monitor is properly connected to the catheter. Calibrate the equipment as directed by the manufacturer so that accurate patient values will be measured.
MODULE E
1. Analyze the available information to determine the patient’s pathophysiologic state (Code: IIIH1) [Difficulty: ELE: R, Ap; WRE: An]
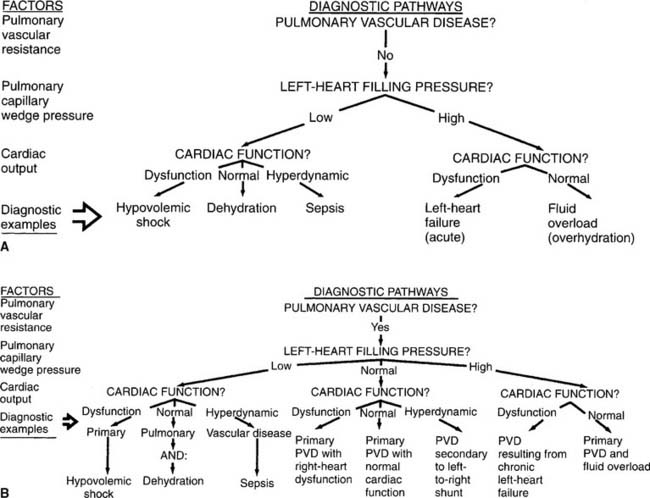
See Figure 5-33 for examples of diagnostic pathways. These can be used to help the clinician evaluate all the patient data. The diagnosis or pathophysiologic state can be determined by following the data on a given pathway. Normal values and common conditions associated with abnormal values were discussed earlier in this chapter.
2. Recommend adjustment of the patient’s fluid balance (Code: IIIG1d) [Difficulty: ELE: R, Ap; WRE: An]
3. Determine the appropriateness of the prescribed respiratory care plan and recommend modifications when indicated
a. Determine the appropriateness of the prescribed therapy and goals for the patient’s pathophysiologic state (Code: IIIH3) [Difficulty: ELE: R, Ap; WRE: An]
b. Review the planned therapy to establish the therapeutic plan (Code: IIIH2a) [Difficulty: ELE: R, Ap; WRE: An]
c. Recommend changes in the therapeutic plan when indicated (Code: IIIH4) [Difficulty: ELE: R, Ap; WRE: An]
4. Record and evaluate the patient’s response to the treatment(s) or procedure(s), including the following
a. Record and interpret the following: heart rate and rhythm, respiratory rate, blood pressure, body temperature, and pain level (Code: IIIA1b4) [Difficulty: ELE: R, Ap; WRE: An]
b. Record and interpret the patient’s breath sounds (Code: IIIAb3) [Difficulty: ELE: R, Ap; WRE: An]
There is a risk of puncturing the right lung during the insertion of a central venous catheter by way of the subclavian vein (see Figure 5-13). Assess the patient for equal, bilateral breath sounds after this procedure has been attempted. Know the signs and symptoms of a pneumothorax. Review them in Chapter 1, if needed.
c. Recheck any math work and make note of incorrect data (Code: IIIA1b2) [Difficulty: ELE: R, Ap; WRE: An]
Closely review the following concepts because they have been tested on previous examinations.
AARC Clinical Practice Guideline. Capnography/capnometry during mechanical ventilation, 2003 revision & update. Respir Care. 2003;48(5):534.
Aggarwal NK, Kiran U, Kapoor PM, Chowdhury UK. Intraoperative central venous oxygen saturation as a surrogate for mixed venous oxygen saturation in patients undergoing cardiac surgery. J Anesth Clin Pharmacology. 2007;23(1):29-33.
Anton WR, Raghu G. Measuring end-tidal carbon dioxide tension at maximal exhalation to improve its utility during T -piece weaning trials. Respir Care. 1990;35(11):1082-1083.
Bakow ED. A limitation of capnography. Respir Care. 1982;27(2):167-168.
Branson RD, Campbell RS. Cardiovascular monitoring. In Branson RD, Hess DR, Chatburn RL, editors: Respiratory care equipment, ed 2, Philadelphia: Lippincott Williams & Wilkins, 1999.
Cairo JM. Assessment of cardiovascular function. In Cairo JM, Pilbeam SP, editors: Mosby’s respiratory care equipment, ed 8, St Louis: Mosby, 2010.
Cairo JM. Hemodynamic monitoring. In Pilbeam SP, Cairo JM, editors: Mechanical ventilation—physiologic and clinical applications, ed 4, St Louis: Mosby, 2006.
Carlon GC, Ray C, Miodownik S, et al. Capography in mechanically ventilated patients. Crit Care Med. 1988;16(5):550-556.
Clark DB, Marshall SG. Mixed venous oxygen saturation measurement. II. General and specific clinical applications. Respir Ther. 81-86, Nov/Dec 1986.
Daily EK, Schroeder JS. Techniques in bedside hemodynamic monitoring, ed 5. St Louis: Mosby, 1994.
Deshpande VM, Pilbeam SP, Dixon RJ. A comprehensive review in respiratory care. Norwalk, Conn: Appleton & Lange, 1988.
Divertie MB, McMichan JC. Continuous monitoring of mixed venous oxygen saturation. Chest. 1984;85(3):423-428.
Fahey PJ, Harris K, Vanderwarf C. Clinical experience with continuous monitoring of mixed venous oxygen saturation in respiratory failure. Chest. 1984;86(5):748-752.
Fink JB, Hunt GE, editors. Clinical practice in respiratory care. Philadelphia: Lippincott-Raven, 1999.
Gravenstein JS, Jaffe MB, Paulus DA, editors. Capnography—clinical aspects. Cambridge UK: Cambridge University Press, 2004.
Harris K. Noninvasive monitoring of gas exchange. Respir Care. 1987;32(7):544-557.
Hess D. Capnometry and capnography: technical aspects, physiologic aspects, and clinical applications. Respir Care. 1990;35(6):557-576.
Hess DR, Branson RD. Noninvasive respiratory monitoring equipment. In Branson RD, Hess DR, Chatburn RL, editors: Respiratory care equipment, ed 2, Philadelphia: Lippincott Williams & Wilkins, 1999.
Hess D. Respiratory care monitoring. In Burton GC, Hodgkin JE, Ward JJ, editors: Respiratory care: a guide to clinical practice, ed 4, Philadelphia: Lippincott-Raven, 1997.
Hunt GE. Diagnostic procedures at the bedside. In: Fink JB, Hunt GE, editors. Clinical practice in respiratory care. Philadelphia: Lippincott-Raven, 1999.
Jaquith SM. The oximetric opticath: what is it and how can it facilitate nursing management of the critically ill patient? Crit Care Nurse. 55-58, May/June 1984.
Kandel G, Aberman A. Mixed venous oxygen saturation: its role in the assessment of the critically ill patient. Arch Intern Med. 1983;143:1400-1402.
Kinasewitz GT. Use of end-tidal capnography during mechanical ventilation. Respir Care. 1982;25(2):169-171.
Krider SJ. Cardiac output assessment. In Wilkins RL, Sheldon RL, Krider SJ, editors: Clinical assessment in respiratory care, ed 4, St Louis: Mosby, 2000.
Krider SJ. Invasively monitored hemodynamic pressures. In Wilkins RL, Sheldon RL, Krider SJ, editors: Clinical assessment in respiratory care, ed 4, St Louis: Mosby, 2000.
Malinowski T. Respiratory monitoring in the intensive care unit. In Wilkins RL, Krider SJ, Sheldon RL, editors: Clinical assessment in respiratory care, ed 3, St Louis: Mosby, 1990.
Malley WJ. Clinical blood gases, ed 2. St Louis: Saunders, 2005.
Marini JJ. Obtaining meaningful data from the Swan-Ganz catheter. Respir Care. 1985;30(7):572-585.
Mathews PJ, Gregg BL. Monitoring and management of the patient in the ICU. In Scanlan CL, Wilkins RL, Stoller JK, Kacmarek RM, editors: Egan’s fundamentals of respiratory care, ed 9, St Louis: Mosby, 2009.
McMichan JC. Continuous monitoring of mixed venous oxygen saturation in clinical practice. Mount Sinai J Med. 1984;51(5):569-572.
Nuzzo PF, Anton WR. Practical applications of capnography. Respir Ther. 12-17, Nov/Dec 1986.
Oblouk Darovic G. Hemodynamic monitoring. Philadelphia: WB Saunders, 1987.
Oblouk Darovic G. Hemodynamic monitoring—invasive and noninvasive clinical application, ed 3. Philadelphia: WB Saunders, 2002.
Osgood CF, Watson MH, Slaughter MS, et al. Hemodynamic monitoring in respiratory care. Respir Care. 1984;29(1):25-34.
Paulus DA. Invasive monitoring of respiratory gas exchange: continuous measurement of mixed venous oxygen saturation. Respir Care. 1987;32(7):535-543.
Pilbeam SP. Mechanical ventilation: physiological and clinical applications, ed 3. St Louis: Mosby, 1998.
Ragosta M. Textbook of clinical hemodynamics. Philadelphia: Saunders, Inc, 2008.
Reinhart K, Kuhn H, Hartog C, Bredle DL. Continuous central venous and pulmonary artery oxygen saturation in the critically ill. Intensive Care Med. 2004;30:1572-1578.
Restrepo RD. Assessment of cardiac output. In Wilkins RL, Dexter JR, Heuer AJ, editors: Clinical assessment in respiratory care, ed 6, St Louis: Mosby, 2010.
Ruppel G. Manual of pulmonary function testing, ed 9. St Louis: Mosby, 2009.
Shapiro BA, Harrison RA, Cane RD, et al. Clinical application of blood gases, ed 5. St Louis: Mosby, 1994.
Shapiro BA, Kacmarek RM, Cane RD, et al, editors. Clinical application of respiratory care, ed 4, St Louis: Mosby, 1991.
Whitaker K. Comprehensive perinatal & pediatric respiratory care, ed 2. Albany, NY: Delmar, 1997.
White GC. Equipment theory for respiratory care, ed 4. Albany, NY: Delmar, 2005.
Wiedemann HP. Invasive monitoring techniques in the ventilated patient. In: Kacmarek RM, Stoller JK, editors. Current respiratory care. Toronto: BC Decker, 1988.
Wilkins RL., Bedside assessment of the patient. Wilkins, Stoller JK, Kacmarek RM. Egan’s fundamentals of respiratory care, ed 9, St Louis: Mosby, 2009.
Wilkins RL., Analysis and monitoring in gas exchange. Wilkins, Stoller JK, Kacmarek RM. Egan’s fundamentals of respiratory care, ed 9, St Louis: Mosby, 2009.
Wilkins RL, Dexter JR. Assessment of hemodynamic pressures. In Wilkins RL, Dexter JR, Heuer AJ, editors: Clinical assessment in respiratory care, ed 6, St Louis: Mosby, 2010.
Wilkins RL, Heuer AJ. Vital signs. In Wilkins RL, Dexter JR, Heuer AJ, editors: Clinical assessment in respiratory care, ed 6, St Louis: Mosby, 2010.
SELF-STUDY QUESTIONS FOR THE ENTRY LEVEL EXAM See page 586 for answers
| PaCO2 | 53 torr |
| Pao2 | 67 torr |
| PETCO2 | 33 torr |
| PĒCO2 | 20 torr |
| PaCO2 | 43 torr |
| Pao2 | 79 torr |
P O2 O2 |
32 torr |
| PETCO2 | 38 torr |
| PĒCO2 | 22 torr |
 O2 of 38 torr
 O2 value would indicate the patient is oxygenating adequately?
SELF-STUDY QUESTIONS FOR WRITTEN REGISTRY EXAM See page 610 for answers
| 9:00 AM | 11:00 AM | |
|---|---|---|
| Pao2 | 75 torr | 53 torr |
| pulmonary vascular resistance | 120 dynes/sec/cm− 5 | 340 dynes/sec/cm− 5 |
| pulmonary capillary wedge pressure | 8 mm Hg | 10 mm Hg |
| pulmonary artery pressure | 25/10 mm Hg | 42/21 mm Hg |
| 4:00 pm | 6:00 pm | |
|---|---|---|
| Set tidal volume | 700 mL | 700 mL |
| Set rate | 10 | 10 |
| PETCO2 | 33 torr | 41 torr |
| PaCO2 | 42 torr | 43 torr |
| Pulmonary artery pressure | 22/8 mm Hg |
| Pulmonary capillary wedge pressure | 3 mm Hg |
| Central venous pressure | 0 mm Hg |
| Blood pressure | 90/60 mm Hg |
| Pulse | 142 beats/min |
 O2 value of 35 torr. After being mechanically ventilated and given digitalis, the P
 O2 value is found to be 41 torr. How should this be interpreted?
 O2 value from the pulmonary artery.
 O2 value from the right atrium and right ventricle.
Which of these patient’s should have an arterial line placed?
[/level-membership-for-pulmolory-and-respiratory-category][not-level-membership-for-pulmolory-and-respiratory-category]
5 Advanced Cardiopulmonary Monitoring
Note 1: This book is written to cover every item listed as testable on the Entry Level Examination (ELE), Written Registry Examination (WRE), and Clinical Simulation Examination (CSE).
The listed code for each item is taken from the National Board for Respiratory Care’s (NBRC) Summary Content Outline for CRT (Certified Respiratory Therapist) and Written RRT (Registered Respiratory Therapist) Examinations (see http://evolve.elsevier.com/Sills/resptherapist/). For example, if an item is testable on both the ELE and the WRE, it will simply be shown as: (Code: …). If an item is only testable on the ELE, it will be shown as: (ELE code: …). If an item is only testable on the WRE, it will be shown as: (WRE code: …).
MODULE A
1. Capnography (exhaled CO2 monitoring)
b. Recommend capnography to obtain additional data (Code: IC10) [Difficulty: ELE: R, Ap; WRE: An]
There are three main reasons to recommend capnography. The first reason is to assess a patient’s ventilation. General anesthesia and even conscious sedation can result in a blunting of the patient’s normal drive to breathe. Several clinical or pathologic situations (discussed later in this chapter) can result in an abnormal increase or decrease in the carbon dioxide level. Second, capnography helps evaluate the effectiveness of cardiopulmonary resuscitation efforts. See the discussion in Chapter 11. Third, capnography can be used to help identify the proper placement of an endotracheal tube. If the tube is within the patient’s trachea or a main stem bronchus, the exhaled tidal volume will contain carbon dioxide. See the discussion in Chapter 12.
c. Perform the bedside procedure (Code: IB9c and IIIE3d) [Difficulty: ELE: R; WRE: Ap, An]
The capnometer is calibrated by comparing a gas sample without carbon dioxide (possibly room air) with a second gas sample containing a known amount of carbon dioxide. The first gas sample without CO2 should give a “zero” reading. Adjust the calibration control to zero if needed. The second sample usually contains 5% to 10% carbon dioxide. The capnometer should display a CO2 level that matches the amount in the known gas sample. Adjust the calibration control as necessary. The carbon dioxide level can be documented as a percent or fraction (FACO2) or as a partial pressure (PACO2).
The capnograph is a strip chart recorder that provides a copy of the patient’s exhaled carbon dioxide curve. There are at least two paper speeds that are useful for different purposes. The fast speed is most useful for evaluating sudden changes in the patient’s condition. Each individual breath is easily seen (Figure 5-1). The slow speed is most useful for trend monitoring (Figure 5-2).
Figure 5-2 Normal capnograph tracing taken at a slow speed. The percentage of exhaled alveolar CO2 is shown on the left vertical scale as FACO2. The partial pressure of exhaled alveolar CO2 is shown on the right vertical scale as PACO2. The slow speed results in a blending of parts A, B, and C of the fast-speed tracing (Figure 5-1). Each spike is part C of the curve and marks an exhalation. A slow-speed tracing is more useful in trend monitoring of a patient than a fast-speed tracing.
Two different gas sampling methods exist: mainstream and sidestream. The mainstream method involves having the infrared sensing unit at the airway; usually it is attached directly to the endotracheal/tracheostomy tube. If the patient is on a ventilator, the sampling adapter must be placed between the endotracheal tube and the ventilator circuit (with or without mechanical dead space). All inspired and expired gas passes through the sensor (Figure 5-3).
The sidestream method employs a capillary tube placed so that a small sampling of the patient’s exhaled gas can be drawn into the capnometer for analysis. It is not necessary for the patient’s entire breath to pass through the sampling adapter; therefore it can be used in an unintubated patient by taping the sampling catheter a short distance into a nostril. If the patient is on a ventilator, the sampling adapter must be placed between the endotracheal tube and the ventilator circuit (with or without mechanical dead space). Remember that the patient’s exhaled tidal volume (VT) and minute volume (E) are reduced by the amount that is drawn into the capnometer (Figure 5-4).
d. Interpret the results from the procedure (Code: IB10c, IIIE4e) [Difficulty: ELE: R, Ap; WRE: An]
It is known that carbon dioxide diffuses from the higher concentration in the tissues to the venous blood and to the lungs to be exhaled. Figure 5-5 shows the normal physiology behind capnography. This diffusion or “flow” of CO2 results in a measurable gradient or difference. In a healthy, upright sitting person, a close relationship exists between carbon dioxide levels in both venous blood and arterial blood and the amount of exhaled carbon dioxide gas. The carbon dioxide level at the end of exhalation is most frequently monitored during patient care. This is called the end-tidal carbon dioxide pressure (PetCO2). When ventilation and perfusion match well, as in a healthy upright person, the gradient between the arterial carbon dioxide level (PaCO2) and the PetCO2 is between 2 and 3 torr, with a range of 1 to 5 torr. The gradient will show the PetCO2 level to be less than the PaCO2 level. This is because the PetCO2 value is an average of exhaled carbon dioxide levels from all lung areas.
Box 5-1 lists normal values of capnography. Three factors influence capnography’s use and the interpretation of the results. (1) The first factor is the patient’s metabolism. The average resting adult produces about 200 mL of CO2 per minute, and fever and exercise increase this value. Hypothermia, sleep, and sedation decrease CO2 production. Exhaled CO2 is monitored during a cardiopulmonary resuscitation (CPR) attempt to determine the effectiveness of circulation and ventilation attempts and to decide if the efforts should be continued or stopped. If no carbon dioxide is being exhaled despite proper CPR procedures, the physician may conclude that the patient’s metabolism has stopped altogether and death has occurred. There would then be nothing to gain by continuing cardiopulmonary resuscitation (CPR) efforts.
BOX 5-1 Normal Blood Gas and Capnography Values (Based on a Sea Level Barometric Pressure of 760 torr)*
PaCO2† is 40 torr (range of 35 to 45 torr).
The pressure of exhaled alveolar CO2 (PACO2) ranges from 35 to 43 torr with the breathing cycle.
The percentage of end-tidal CO2 (FACO2) is about 4%-6% and trends with the PaCO2 level.
(2) Although not a major factor, the patient’s cardiac output is another factor that influences the use of capnography. Sepsis, which might double a patient’s cardiac output, reduces the PCO2 level only a few torr (millimeters of mercury [mm Hg]). Cardiogenic shock, which reduces the cardiac output, raises the partial pressure of CO2 (PCO2) only a few torr.
(3) The third and most important factor is alveolar ventilation. A doubling of alveolar ventilation, under steady-state conditions for carbon dioxide production, results in a halving of the PCO2 levels in arterial blood and alveolar gas. However, a reduction of alveolar ventilation to half of its previous level will result in the PaCO2 and PACO2 levels being doubled (Figure 5-6).
Figure 5-6 Relationship between alveolar ventilation, PaCO2, and exhaled percent CO2.
(From Pilbeam SP: Mechanical ventilation: physiological and clinical applications, ed 4, St Louis, 2006, Mosby.)
2. Arterial–end-tidal carbon dioxide gradient
a. Perform the bedside procedure (Code: IB9c and IIIE3d) [Difficulty: ELE: R; WRE: Ap, An]
b. Interpret the results from the procedure (Code: IB10c, IIIE4e) [Difficulty: ELE: R, Ap; WRE: An]
Review the components of a fast-speed capnography tracing in Figure 5-1 to understand a normal person’s expiratory pattern. Figure 5-7 shows eight different abnormal fast-speed capnography tracings. See the figure legend for an explanation of each problem. As the patient returns to normal, the tracing should approach that shown in Figure 5-1.
3. Arterial–residual volume alveolar carbon dioxide gradient
a. Perform the bedside procedure (Code: IB9c and IIIE3d) [Difficulty: ELE: R; WRE: Ap, An]
Have a cooperative patient exhale maximally to residual volume (RV) through the capnography unit. The graphic results will be similar to that shown in Figure 5-8. The usual P(a-RV)CO2 gradient in a healthy person is about 3 to 5 torr, and should be less than 7 torr. The wider the gradient, the greater is the ventilation to perfusion (/) mismatching. A gradient of more than 13 torr is considered to be markedly abnormal. This may be the case in patients with chronic obstructive pulmonary disease (COPD), pulmonary emboli, left heart failure (LHF), or hypotension.
b. Interpret the results from the procedure (Code: IB10c, IIIE4e) [Difficulty: ELE: R, Ap; WRE: An]
When comparing the normal (solid line) tracing in Figure 5-8 with the / mismatching (dashed line) tracing, note the increased gradient at end-tidal CO2. With continued exhalation to residual volume, the left heart failure and COPD patients have a narrowing of the gradient. This can be used clinically to follow these patients’ progress and response to treatment. The patient with a large pulmonary embolism will not have such a narrowing of the gradient as he or she exhales to residual volume. This patient’s gradient will narrow to normal as the embolism is resolved and the physiologic dead space returns to normal.
Past exams have often had one question that requires the interpretation of capnography results, especially the end-tidal CO2 value (PetCO2). Examples include a change in alveolar ventilation, shallow breathing, and CPR attempt.
MODULE B
1. Review dead space to tidal volume data in the patient’s chart (Code: IA7e) [Difficulty: ELE: R; WRE: Ap]
2. Perform the bedside procedure (ELE Code: IB9l) [Difficulty: ELE: R, An]
The procedure is the mathematical comparison of a person’s dead space volume with tidal volume. Steps in the traditional procedure follow (Figure 5-9):
a. Determine the decimal fraction or percentage of dead space
Place both carbon dioxide values into this formula, which is derived from the original Bohr formula:
VD/VT or VD the patient’s physiologic dead space
PaCO2 = the patient’s arterial carbon dioxide pressure
PĒCO2 = the patient’s average exhaled carbon dioxide pressure
The following example is based on an abnormal adult:
b. Determine the dead space volume
Place both carbon dioxide values into this formula, which is derived from the original Bohr formula:
VD VT or VD the patient’s physiologic dead space
VT = the average exhaled tidal volume
PaCO2 = the patient’s arterial carbon dioxide pressure
PĒCO2 = the patient’s average exhaled carbon dioxide pressure
The following example is based on a normal adult:
The recent advent of volumetric capnography technology allows the patient’s dead space to be rapidly determined. These units can simultaneously measure the patient’s exhaled tidal volume and the variable percentage of carbon dioxide found during the exhalation (Figure 5-10). The computer that is integrated with the volumetric capnography unit then calculates the volume of dead space as a fraction of the exhaled tidal volume. Figure 5-11 shows how volumetric capnography can be set up to measure the dead space of a patient requiring mechanical ventilation. This technology permits the rapid assessment of a patient as treatment is being performed. For example, if a patient had a large pulmonary embolism resulting in significant dead space, a clot-dissolving medication such as streptokinase (Kabikinase or Streptase) or alteplase (Activase) would be given. These “clot buster” medications will rapidly dissolve the patient’s pulmonary embolism. With volumetric capnography, the dead space volume can be monitored as it normalizes when blood flow through the lungs is restored.
Figure 5-10 A graphic representation of the factors involved in the calculation of a patient’s dead space volume, or dead space to tidal volume (VD/VT) ratio, through volumetric capnography. These units can measure exhaled carbon dioxide (by pressure or percentage) at time intervals as the patient’s tidal volume is exhaled. Review Figure 5-1, as needed, for a normal capnograph tracing.
3. Interpret the results of the VD/VT calculation (Code: IB10l) [Difficulty: ELE: R, Ap; WRE: An]
Physiologic dead space is composed of the following:
The following conditions or pulmonary disorders can cause the ratio to vary from the normal range:
a. Decreased VD/VT ratio
c. Increased dead space effect with ventilation greater than perfusion ( > )
MODULE C
1. Blood pressure
b. Recommend blood pressure measurement to obtain additional data (Code: IC11) [Difficulty: ELE: R, Ap; WRE: An]
c. Perform blood pressure measurement (Code: IB9m, IIIE3e) [Difficulty: ELE: R, Ap; WRE: An]
The general steps in measuring blood pressure were described in Chapter 1. The BP is usually measured on either of the patient’s arms. Necessary equipment includes the proper size of blood pressure cuff, a sphygmomanometer to measure the pressure, and a stethoscope to hear the sounds of bloodflow returning through the brachial artery. Figure 5-12 shows the basic elements of the procedure. The cuff is inflated to a pressure that is greater than the patient’s systolic pressure. As the pressure in the cuff is gradually decreased, the first sound heard (Korotkoff sounds) is the systolic pressure. The pressure reading at which this sound ceases is the diastolic pressure. Blood pressure measurement can usually be performed manually by a respiratory therapist or other trained health care professional. If BP measurement is needed on a frequent basis, an automated blood pressure measurement system can be set up on the patient’s arm. This unit can be programmed to measure the BP on a schedule and can also have high and low blood pressure alarm limits established as a safety feature.
e. Interpret the results of the blood pressure measurement (Code: IB10m, IIIE4c) [Difficulty: ELE: R, Ap; WRE: An]
Review the general discussion on blood pressure in Chapter 1. The following are normal blood pressure values:
Patients who have values that are higher or lower than these should be further evaluated. Know the following values since they represent a serious patient problem:
2. Central venous pressure (CVP) monitoring
a. Review central venous pressure measurement data in the patient’s chart (Code: IA8b) [Difficulty: ELE: R; WRE: Ap]
The central venous pressure (CVP) is the pressure measured in a patient’s superior vena cava, just above the right atrium. See Figure 5-13. Review previous patient data to understand whether there is an abnormality. Compare the current data with the earlier information to determine if there has been a change in the patient’s condition. See Box 5-2 for normal values.
b. Recommend the insertion of a central venous pressure catheter to obtain additional data (WRE code: IC12) [WRE Difficulty: R, Ap, An]
A single-lumen central venous pressure catheter (also called a CVP line) is inserted into many patients for one or more reasons: (1) to monitor the patient’s right-sided (right atrium) heart pressure, (2) to rapidly administer a large volume of intravenous fluids, and (3) to administer cardiac medications during a CPR attempt (preferred route). Recently, the development of a triple-lumen CVP catheter with integrated fiberoptic channel (Edwards Lifesciences, LLC) has enabled the continuous monitoring of central venous oxygen saturation (ScvO2), in addition to the previously mentioned uses. See Figure 5-14.
c. Recommend central venous pressure measurement to obtain additional data (Code: IC11) [Difficulty: ELE: R, Ap; WRE: An]
d. Perform central venous pressure measurement (Code: IB9e) [Difficulty: R, Ap, An]
The catheter is usually inserted into the right jugular vein or right subclavian vein and advanced to just above the superior vena cava. When set up for monitoring pressure, it measures the right atrial pressure (see Figure 5-15 for how to perform the procedure). Note that the stopcock must be kept at the midchest (midheart) level. Usually a mark is placed at this location (on the patient’s chest) for consistency. Raising the stopcock above the mark results in an incorrectly low reading. Lowering the stopcock below the mark results in an incorrectly high reading. See Figure 5-16. Clinical practice is very important in learning how to perform this procedure. It is important that the patient breathes spontaneously if at all possible. Peak pressures during inspiration on a mechanical ventilator may artificially raise the CVP reading. Positive end-expiratory pressure (PEEP) may also raise the CVP reading. If the patient cannot be removed from the ventilator, take the reading during exhalation. Make a note of the settings and that the reading was taken with the patient on the ventilator. Record the data in the patient’s chart or flow sheet.
Past exams have asked about the proper placement of the CVP stopcock or arterial pressure transducer at the midchest (midheart) location to ensure accurate pressure measurements. Usually a mark is placed on the patient’s chest for a consistent measurement point. Review Figure 5-16 for the effects of misplacement.
Past exams have asked about the proper placement of the CVP stopcock or arterial pressure transducer at the midchest (midheart) location to ensure accurate pressure measurements. Usually a mark is placed on the patient’s chest for a consistent measurement point. Review Figure 5-16 for the effects of misplacement.
e. Interpret the results of the central venous pressure measurement (Code: IB10m, IIIE4c) [Difficulty: ELE: R, Ap; WRE: An]
As noted earlier, the CVP is a measure of the pressure in the right atrium. The two main factors that influence the right atrial pressure are the blood volume returning to it and the functioning of the right ventricle (see Box 5-2 for normal CVP readings).
Memorize the values listed in Box 5-2. Expect to see several questions in which these values are used as patient data or as options to answer a question. The normal values must be understood to identify abnormal values and know why they are abnormal.
Memorize the values listed in Box 5-2. Expect to see several questions in which these values are used as patient data or as options to answer a question. The normal values must be understood to identify abnormal values and know why they are abnormal.
3. Pulmonary artery pressure monitoring
a. Review pulmonary artery pressure data in the patient’s chart (Code: IA8b) [Difficulty: ELE: R; WRE: Ap]
The pulmonary artery pressure (PAP) is the systolic and diastolic pressure found in either pulmonary artery. It can be measured only through a pulmonary artery catheter. (The NBRC often refers to this as a flow-directed pulmonary artery catheter.) Review the patient’s previous values before taking another pressure reading to make a comparison. Box 5-2 shows normal cardiopulmonary values.
b. Recommend the insertion of a pulmonary artery catheter for additional data (WRE code: IC12) [WRE Difficulty: R, Ap, An]
To read the PAP, a pulmonary artery catheter (PAC) must be inserted through a vein and passed through the right atrium and right ventricle into the pulmonary artery. The common insertion sites, in descending order of preference, are the basilic vein in either the right or the left arm, the right internal jugular or subclavian vein, or the right or left femoral vein. The pulmonary artery catheter is also commonly called a Swan-Ganz catheter after the inventors who gave their names to a particular brand. The catheters are available in different lengths and diameters for pediatric and adult patients. See Figure 5-17 for a typical adult catheter.
c. Recommend pulmonary artery pressure measurement to obtain additional data (Code: IC11) [Difficulty: ELE: R, Ap; WRE: An]
d. Perform pulmonary artery pressure measurement (Code: IB9m, IIIE3e) [Difficulty: ELE: R, Ap; WRE: An]
Figure 5-17 is an illustration of a 7-French quadruple-lumen thermodilution pulmonary artery catheter. Besides measurement of PAP, it is capable of being used to measure cardiac output. Figure 5-18 illustrates how a pulmonary artery catheter could be arranged with a pressure transducer and pressure monitor. Figure 5-19 shows a representation of the series of pressure waveforms seen as the catheter is advanced through the heart and into the wedged position in a branch of the pulmonary artery. Figure 5-20 shows a larger cutaway view of the heart with a PAC and normal heart chambers and related pressures.
e. Interpret the results of pulmonary artery pressure measurement (Code: IB10m, IIIE4c) [Difficulty: ELE: R, Ap; WRE: An]
Again, the PAP is the systolic and diastolic pressure found in the pulmonary artery (see Box 5-2 for normal values). Elevated PAP values are usually seen with the following conditions:
[/not-level-membership-for-pulmolory-and-respiratory-category]
