CHAPTER 97 Acute Pulmonary Thromboembolic Disease
Pulmonary embolism (PE) was clinically described in the early 1800s, and von Virchow first described the connection between venous thrombosis and PE.1,2 In 1922, Wharton and Pierson reported the first radiographic description of PE,3 a commonly encountered entity whose diagnosis is clinically challenging because of its nonspecific symptoms.
Prevalence and Epidemiology
PE is a potentially fatal condition with substantial morbidity and mortality in untreated patients. The annual incidence of pulmonary embolism is estimated to be between more than 300,000 cases, resulting in approximately 50,000 to 100,000 deaths in the United States every year.4 Nearly 90% of PEs arise from lower extremity deep venous thrombosis (DVT). Diagnosis of pulmonary embolism remains a clinical challenge because of its nonspecific presentation. Mortality ranges from 3.5% to 15% and can be as high as 31% to 58% in the presence of shock.5,6 Hence, prompt and accurate diagnosis is imperative because 65% of patients die within 1 hour of presentation and approximately 93% in the first 2.5 hours.7 Since its original description, imaging has played an important role in the diagnosis of PE. For many years, ventilation-perfusion (V/Q) scintigraphy has been the main imaging modality for the evaluation of patients with suspected PE. However, with the advent of and the widespread availability of faster computed tomography (CT) scanners, CT scanning has emerged as another important diagnostic test for the evaluation of not only PE but also DVT in select patients. Thus, familiarization with various aspects of imaging evaluation is of extreme importance for the interpreting physician.
Etiology and Pathophysiology
Three primary influences predispose a patient to thrombus formation, which form the so-called Virchow triad: (1) endothelial injury; (2) stasis or turbulence of blood flow; and (3) blood hypercoagulability.1,2,8
More than 90% of all PEs arise from thrombi within the large deep veins of the legs, typically the popliteal vein and the larger veins central to it.1,2,4 The pathophysiologic consequences of thromboembolism in the lung largely depend on the cardiopulmonary status of the patient and on the size of the embolus, which in turn dictates the size of the occluded pulmonary artery.
MANIFESTATIONS
Clinical Presentation and Pretest Probability
Many patients with suspected PE present with nonspecific findings such as acute chest pain, and some are even asymptomatic. Some observers have suggested that because of the decline in tolerance for diagnostic uncertainty, diagnostic studies for the evaluation of PE may be overused in current practice. Pretest probability is an important concept, because the sensitivity, specificity, and predictive values of diagnostic imaging modalities are based on the pretest probability of PE, which is usually determined by clinical findings and laboratory test results.9–11 The Wells criteria (Table 97-1)12 and Geneva score,13 which were devised and validated for clinical pretest probability, have been reported to have similar accuracy levels. Chagnon and colleagues14 have shown that these methods can be used to divide patients into low-, intermediate-, and high-probability groups for PE, although neither was accurate enough to diagnose PE in individual cases.
TABLE 97-1 Wells Clinical Decision Rule for Pulmonary Embolism
| Variable | Points |
|---|---|
| Clinical signs and symptoms of deep vein thrombosis | 3.0 |
| Alternative diagnosis less likely than pulmonary embolism | 3.0 |
| Heart rate > 100/min | 1.5 |
| Immobilization (> 3 days) or surgery in the previous 4 weeks | 1.5 |
| Previous pulmonary embolism or deep vein thrombosis | 1.5 |
| Hemoptysis | 1.0 |
| Malignancy (receiving treatment; treated in the last 6 months or palliative) | 1.0 |
Clinical probability of pulmonary embolism unlikely—4 points or less.
Clinical probability of pulmonary embolism likely—more than 4 points.
Adapted from Wells PS, Anderson DR, Rodger M, et al. Derivation of a simple clinical model to categorize patients probability of pulmonary embolism: increasing the models utility with the SimpliRED D-dimer. Thromb Haemost 2000; 83:416-420.
Serum D-dimer levels can be used to gauge the presence of PE. D-dimer is a fibrin degradation product that increases with clot lysis, suggesting the presence of thrombosis. It has been shown that this test with levels above a threshold value of 0.5 mg/L has an excellent sensitivity of 95%, but the specificity is lower (38% to 83%)15 because of elevated levels in some conditions, such as active inflammation, infection, pregnancy, malignancy, and liver failure. Of all the methods available for measurement of D-dimer levels (Table 97-2),10 the VIDAS D-dimer assay (bioMérieux, Marcy l’Etoile, France), a rapid, quantitative, enzyme-linked immunosorbent assay (ELISA) procedure, has been reported to have a 96.4% sensitivity,16 thus ruling out PE in the absence of a calculation of clinical pretest probability.16,17 However, this is not routine clinical practice. Several studies10,11,18 have demonstrated that a negative result of rapid quantitative ELISA D-dimer can be combined with the clinical probability score to exclude PE in up to 40% of patients, thereby eliminating further workup.
TABLE 97-2 Sensitivity and Specificity (%) of D-Dimer Based on Laboratory Technique
| Laboratory Technique | Mean (Range) | |
|---|---|---|
| Sensitivity | Specificity | |
| ELISA | 95 (85-100) | 44 (34-54) |
| Rapid quantitative ELISA | 95 (83-100) | 39 (28-51) |
| Rapid semiquantitative ELISA | 93 (79-100) | 36 (23-50) |
| Rapid qualitative ELISA | 93 (74-100) | 68 (50-87) |
| Quantitative latex agglutination | 89 (81-98) | 45 (36-53) |
| Semi quantitative latex agglutination | 92 (79-100) | 45 (31-59) |
| Whole blood agglutination | 78 (64-92) | 74 (60-88) |
ELISA, enzyme-linked immunosorbent assay.
Adapted from Ginsberg JS, Wells PS, Kearon C, et al. Sensitivity and specificity of a rapid whole-blood assay for D-dimer in the diagnosis of pulmonary embolism. Ann Intern Med 1998; 129: 1006-1011.
Imaging Techniques and Findings
Chest Radiography
The Westermark sign (Fig. 97-1)19 is a focal peripheral lucency beyond an occluded vessel accompanied by mild dilation of central pulmonary vessels, seen in 7% to 14% of cases of documented PE in the PIOPED study. It is a subtle finding caused by embolic obstruction or hypoxic vasoconstriction of pulmonary artery.
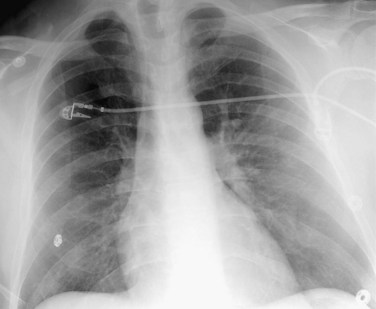
 FIGURE 97-1
Another finding is enlarged central pulmonary vasculature, which can be easily missed. It may be caused by vessel distention by thrombus or by an acute rise in pulmonary arterial pressure secondary to distal emboli. A sausage-like configuration of focal enlargement of the right descending interlobar pulmonary artery caused by the physical presence of a clot has also been noted in many patients with acute PE and referred to as the knuckle sign. Hampton hump20 is classically referred to as a conical peripheral opacity pointing toward the hilum. These are multiple, subpleural lower lobe infarcts seen as ill-defined opacities without air bronchography (Figs. 97-2 and 97-3).
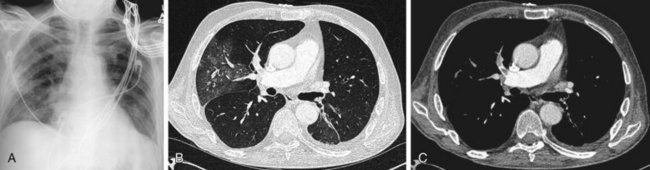
 FIGURE 97-2
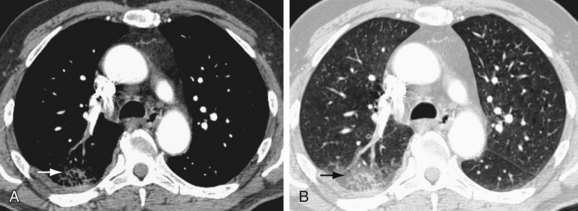
 FIGURE 97-3
Focal parenchymal abnormalities are the most commonly encountered lesions on chest radiographs in PIOPED series patients. These particularly include subsegmental atelectasis (Fleischner lines),21 seen as linear opacities in lung bases; these are transient in nature and thought to be caused by mucus plugging, hypoventilation, or distant airway closure. Focal air space consolidation represents true pulmonary infarction, with ischemic necrosis or pulmonary hemorrhage without infarction occurring in 10% to 60% of patients. Small, unilateral, pleural effusions and diaphragmatic elevation are seen in a large number of PE patients.
Lower and Upper Extremity Ultrasonography
As noted, 90% of PEs originate from thrombosis within the deep venous system of the lower extremities and are mostly clinically silent; other sources are the pelvic, renal, and upper extremity veins.22 Significant morbidity and mortality are associated with undiagnosed DVT; thus, methods such as contrast venography (CV), magnetic resonance venography (MRV), and lower extremity ultrasonography are commonly used for its detection. Real-time gray scale, continuous wave and pulsed Doppler, and color Doppler imaging, along with ancillary techniques such as the Valsalva maneuver and manual blood flow augmentation, are used to image the lower extremity veins.
Color Doppler imaging is useful to identify deeper veins such as the iliac veins and superficial femoral veins, for which direct venous compression is not possible, or for obese or swollen extremity patients. Thrombosis is identified as the absence of color flow within a vessel lumen at baseline and with augmentation; the sensitivity and specificity are 95% and 98%, respectively, for femoropopliteal DVT.22
Ventilation-Perfusion Scintigraphy
A normal perfusion scan excludes a diagnosis of PE, with its negative predictive value close to 100%.23–25 It is a safe, relatively inexpensive, and widely available test that allows the acquisition of single-breath, equilibrium, and washout images. A high-probability V/Q scan (Figs. 97-4 and 97-5), in combination with high-probability clinical findings, corresponded to PE in 96% of patients, whereas a low-probability clinical assessment showed PE in only 4% of patients in a major study.9
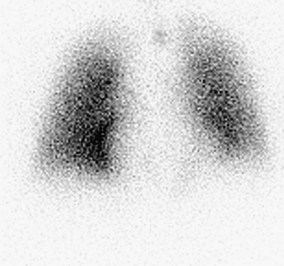
 FIGURE 97-4
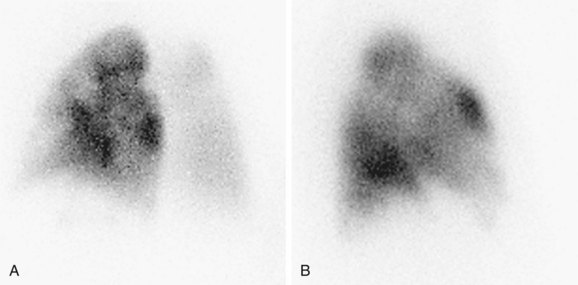
 FIGURE 97-5
In PIOPED-1, a V/Q scan in patients with a normal chest radiograph was diagnostic in 52% of patients with suspected PE,26 and one study has shown it to be diagnostic in 91% of patients.27 This PIOPED group retrospectively analyzed perfusion scans alone and found the results to be equivalent to those of the V/Q technique.28 In the PISA-PED trial,29 only perfusion scans were obtained. These were classified according to the shape of defects, yielding sensitivity and specificity of 86% and 93%, respectively, for abnormal perfusion scans compatible with PE, with the result being dichotomous. These studies indicate that the ventilation scan can be eliminated, thus reducing cost and radiation dose. It can also be used as a preferred alternative for patients unable to undergo CT angiography.
It can be used particularly for reproductive female patients whose chest radiograph is likely to be normal and in whom the breast irradiation dose from CT angiography can be minimized using the perfusion scan only.9,30 Another significant use is follow-up of proven PE patients undergoing anticoagulation.
Ventilation-Perfusion Single Photon Emission Computed Tomography
V/Q single photon emission computed tomography (SPECT) is a newer modality that may improve both sensitivity and specificity of the V/Q scan (Fig. 97-6). Reinartz and associates31 analyzed 83 patients who underwent four-slice spiral CT, V/Q planar, and V/Q SPECT studies, giving sensitivity, specificity, negative predictive value (NPV), and positive predictive value (PPV) of 97%, 91%, 98%, and 90%, respectively, for SPECT techniques. This study used aerosolized technetium 99m (Tc 99m) for the ventilation portion of the V/Q scan instead of the radioisotope xenon 133. Tc 99m is five times smaller in diameter and has a 20% efficiency of pulmonary deposition in comparison to 2% for xenon 133, thus helping improve the results.32,33 Unlike PIOPED, this study considered all the mismatched results as PE, regardless of the size. This technique has the potential to improve the interpretation of V/Q scanning by incorporating computerized interpretations.
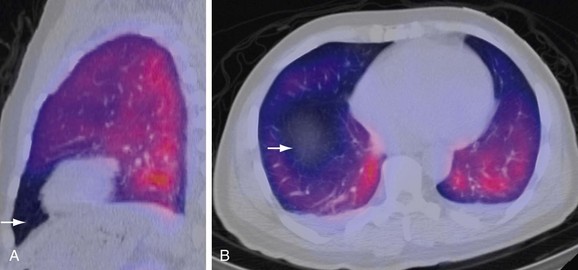
 FIGURE 97-6
Pulmonary Angiography
This method had served as a standard of reference for PE detection for decades before the advent and widespread use of CT. It was usually performed in cases of discrepancy between the clinical suspicion and results of the V/Q scan, or if there were coexisting conditions (e.g., pneumonia, lung cancer) that could result in a false-positive result. Angiography was also often performed prior to interventions such as mechanical clot fragmentation. The relative contraindications to this procedure are listed in Box 97-1.22


Computed Tomography of the Chest
CT Pulmonary Angiography
Single-detector helical CT pulmonary angiography (SCTA) is an older technique that is still in clinical use. It has a reported high accuracy, with sensitivity reported to range from 60% to 100% and specificity from 81% to 100%.34,35 This technique involves the use of a single detector and x-ray source that rotate around the patient, taking multiple cross-sectional images and allowing the entire study to be completed in 25 to 30 seconds. When it was first developed it represented an important advance, because it allows over 90% of patients to hold their breaths throughout the study, thus reducing motion artifact from breathing.36 Also, 3-mm slices can be obtained with the spiral technique which aid in higher quality imaging of the vasculature. By 2001, at many institutions, SCTA had surpassed the V/Q scan as the initial test for evaluation of PE.
There have been a few published reports challenging the accuracy of SCTA, reporting a high specificity and low sensitivity in the evaluation of PE. Most of these studies concluded that SCTA was inadequate as a single first-line test for PE evaluation, especially for acute thrombi in subsegmental pulmonary arteries and right middle lobe and lingular arteries.34,35 Several follow-up studies were performed to determine whether the sensitivity of SCTA could be improved. Perrier and coworkers37 found in 299 patients that SCTA combined with lower extremity ultrasonography yielded only a 70% sensitivity, despite the fact that ultrasonography yielded better false-negative rates. In another similar study, approximately 16% of the negative SCTA had positive lower extremity ultrasonography needing treatment.38 Thus, it was suggested that a negative SCTA along with lower extremity ultrasonography was important for ruling out a diagnosis of PE.
Technical Considerations
A specific imaging protocol is designed to optimize the diagnostic information, giving particular attention to various scan parameters to obtain high-quality images. Ideally, for a helical CT scan, it must include the entire pulmonary arterial system, without the other areas of thorax, to reduce radiation exposure and keep the timing of the study optimal. A caudocranial scanning direction is beneficial because most PEs are detected in the lung bases, where the blood flow is maximal. Therefore, even if the patient loses his or her breath-hold, the degradation of scan quality from motion would most likely occur in the upper lung region, where PE occurrence is less likely. An inspiratory breath-hold is desirable because it can increase the pulmonary vascular resistance, leading to better contrast enhancement. Various concentrations of contrast agent and protocols for injection rate have been used, each with its own advantages and disadvantages. High-contrast agent concentration (300 to 360 mg/mL) with a high rate of infusion (3 mL/second or higher) is the most popular, convenient, and effective because it maximizes pulmonary artery opacification and allows the use of preloaded syringes. Typically, 2- to 3-mm collimation imaging is done with or without narrow overlapping reconstruction. This technique provides excellent image quality, but also leads to a larger data storage requirement. Additionally, it is preferable to use larger pitch values with narrower collimation. Pitch values of 1.7 to 2 are commonly used. Also, proper timing of the contrast bolus is extremely important to obtain a high-quality image. Generally, a presumptive scan delay of 20 seconds for upper extremity injections works well to obtain adequate enhancement. Rapid viewing of contiguous scans in sequence is useful in clinical practice. Multiplanar reformatted images can be useful to identify small artery abnormalities, which usually follow an oblique course, and three-dimensional reconstructions with volume rendering aid in displaying complex anatomy.22
Classic Findings
A diagnosis of acute PE is established when a partial intraluminal filling defect is visualized with a sharp interface surrounded by varying degree of contrast (Fig. 97-7). Eccentric or peripheral intraluminal filling defects form acute angles with the vessel wall. Acute PE thrombus attenuation measures 33 ± 14 HU, whereas that of chronic PE thrombus measures 90 ± 30 HU. There are two very reliable signs for acute PE diagnosis—a thrombus usually appears to be central in the pulmonary artery when seen in cross section (the doughnut sign). Occasionally, it may be outlined by contrast agent when imaged along its axis (railroad track sign).22 Other findings include mosaic perfusion, right ventricular strain (Fig. 97-8), peripheral consolidation (representing pulmonary hemorrhage or infarction), and pleural effusions. Saddle embolus bridges can form across the right and left main pulmonary arteries and are a cause of sudden death (Fig. 97-9). Mosaic perfusions are inhomogeneous lung opacities caused by alteration in pulmonary blood flow. The Miller method39 is commonly used to measure the clot burden and indicates the severity of PE, but is a poor predictor of mortality. In this method, 1 point is given for a clot in each proximal artery, which is equivalent to each segment arising distally, thus resulting in a maximum score of 9 for right lung, 7 for left lung, and 16 total.
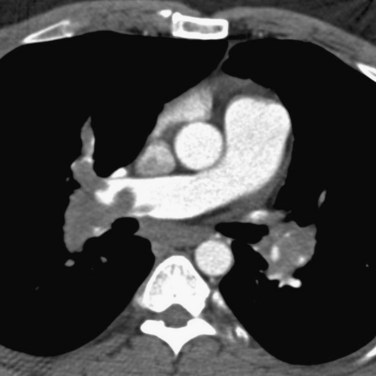
 FIGURE 97-7
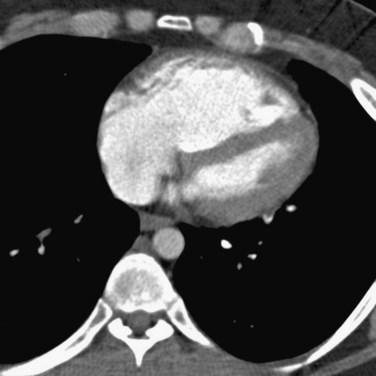
 FIGURE 97-8
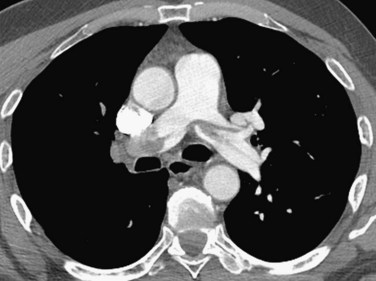
 FIGURE 97-9
Limitations
Pooled data from numerous studies have suggested a sensitivity of 90% and specificity over 90% in cases of suspected acute PE involving main, lobar, and segmental arteries, although a wider range has been observed in many studies. Contributing to the lower sensitivity is its resolution. The sensitivity and specificity rates are particularly diminished (61% to 79% at its best) for small subsegmental emboli, which are usually uncommon in an acute setting.34,40 Between 6% and 30% of patients with PE have isolated subsegmental emboli.41 Thus, studies that demonstrated the lowest sensitivity rates mainly consisted of patients with small thrombi.
CT scanning leads to significant radiation exposure; for all indications, it accounts for approximately 40% to 75% of medical radiation exposure.42,43 This increases the risk of malignancy in patients involved in serial studies. The radiation dose to the breast is of special concern. This radiation exposure is also an issue of concern for pregnant women.
Another limitation to be taken into account is reaction to the contrast medium used. Nearly 15% of patients experience mild reactions such as nausea, vomiting, and flushing.44 Severe reactions are less frequent; these include laryngeal edema, bronchospasm, convulsions, and cardiovascular collapse (0.04% to 0.22%). The incidence of these reactions is reduced substantially by using low-osmolality contrast media. Contrast-induced nephropathy (CIN) is another important life-threatening complication. Furthermore, patients with preexisting primary conditions such as pregnancy and renal failure are contraindicated from the use of this test.
Multidetector Computed Tomography
MDCT became available for clinical use in the late 1990s and is now widely accepted as the standard of care. In this technique, multiple detectors are rotated as the patient slides through the CT scanner gantry. In its earliest form, MDCT used four scanners. However, that number gradually increased to 64-detector technology, which is widely used currently, and scanners with 256 detectors or more are or will be available in the near future. The increase in the number of detectors has led to a reduction in study time by 10 seconds and slice thickness as low as 0.5 mm, greatly contributing to higher resolution and imaging, up to sixth-order pulmonary arteries.40 This has consequently led to improved detection of subsegmental PEs, higher sensitivity rate, and reduction in false-negative results. The coronal, sagittal, and axial reconstructions using thin axial collimation have different sensitivities and may aid in the reduction of artifacts and false-positive rates by three-dimensional visualization. Thin collimation also allows retrospective reconstruction of CT images using electrocardiographic reconstruction based on the R-R interval, which eliminates cardiac artifact and helps obtain better visualization of the coronary arteries and thoracic aorta.
Several studies have validated the use of MDCT for the evaluation of PE. The first evaluated patients with high clinical probability or an abnormal D-dimer test by the Geneva score.45 In the second study, inpatients and outpatients were evaluated with abnormal D-dimer or PE-like clinical probability by a modified Wells score.11
In the PIOPED II multicenter trial, 1090 patients were enrolled; 824 underwent CT pulmonary angiography (CTPA), CT venography (CTV), and a confirmatory test. Of these, 192 patients (24%) had PE and 51 patients (6%) had an inadequate CTPA result.46 The primary aim of PIOPED II was to determine the accuracy of MDCT for the diagnosis and exclusion of PE in suspected patients. The observed sensitivity was 83% specificity was 96%, and 87 patients (11%) had an inadequate CTV result. The combined sensitivity and specificity of CTA-CTV were 90% and 95%, respectively. This led to the conclusion that MDCT CTA-CTV is more accurate than CTPA alone for the diagnosis of PE. It also established that in the case of the clinical picture being dissonant with CTPA, further imaging should be undertaken. Because V/Q scanning was the reference test in this study, any discordance with CTPA led to the incorporation of another test, such as a positive lower extremity ultrasonography, low-probability V/Q, and low clinical probability using Wells criteria or a positive digital subtraction angiography (DSA) result. Additionally, the PIOPED investigators created a composite standard, which, if satisfied, could diagnose or exclude PE, in case MDCT was positive, with a negative angiography result. This is a powerful set of tests that can be reliably used for the exclusion of PE without pulmonary angiography or CT scanning (Table 97-3). The main limitation was the use of clinical probability as the decision point.
TABLE 97-3 Diagnostic Reference Standard for Prospective Investigation of Pulmonary Embolism Disorders (PIOPED) II
| PE Diagnosed | PE Excluded |
|---|---|
| High-probability V/Q scan in patient without prior history of PE | Normal findings on digital subtraction pulmonary angiography |
| Abnormal findings on pulmonary digital subtraction angiography | Normal findings on V/Q scan |
| Abnormal findings on venous ultrasonography in patient with no prior history of DVT at that site and nondiagnostic V/Q scan (not normal and not high probability) | Low or very low probability V/Q scan in subject with clinical Wells score <2 and negative lower extremity ultrasonography |
DVT, deep venous thrombosis; PE, pulmonary embolism; V/Q, ventilation-perfusion.
Adapted from Stein PD, Fowler SE, Goodman LR, et al. Multidetector computed tomography for acute pulmonary embolism. N Engl J Med 2006; 354: 2317-2327.
Limitations
Important limitations include unsatisfactory images caused by respiratory and cardiac motion. MDCT detects PEs at a subsegmental level, especially involving fifth- and sixth-order branch vessels, which have lower significance but immediate importance. They may not be of acute danger to the patient but predict a future, more severe embolism. Thus, the incidence of PE should be higher in MDCT studies than in those performed with other methods. It was 33% for the original PIOPED study,9 whereas only 20.4% to 26% for the newer PIOPED II, Perrier, and Christopher studies.11,45
Computed Tomography Venography
CTV provides the additional ability to image DVT in the pelvic veins as well as the lower extremity venous system immediately following CT angiography of the pulmonary arterial system, without administration of additional contrast. The thrombi are visible as filling defects within the veins. Such a technique not only expedites patient evaluation, but also provides a diagnostic benefit over ultrasound assessment. A large cohort study conducted by Cham and colleagues47 has shown a 20% increase in the detection of thromboembolism when CTV was performed with contiguous, helically acquired 10-mm sections in comparison to CTA alone. As noted, a PIOPED II trial clearly reported that the sensitivity of CTA for the diagnosis of PE increased from 83% to 90% with the addition of CTV.46 Thus, the addition of CTV is beneficial for better diagnosis and further treatment planning for patients with suspected PE undergoing CTA studies.
Magnetic Resonance Imaging
Recent advances in the field of MRI technology has made this challenging field useful for the imaging of pulmonary vascular structures. The reduction in breath-hold time to 20 seconds (as a result of the acquisition of all the images in a shorter time) had led to its increased popularity.48 Although many challenges exist, such as a relative lack of signals in lieu of paucity of protons in chest, air, and soft tissue interface artifacts, and respiratory and cardiac motion problems, it is still attractive for two primary reasons. First, and most important, MRI overcomes the use of ionizing radiation to generate images, making it completely harmless to the patient. Hence, it is being considered safe in pregnancy as well. Secondly, intravenous contrast agents are considered less nephrotoxic.
Techniques
Gd-MRA is the most commonly used method, and its protocol varies in different institutions. The signal-to-noise ratio is optimized using phased-array coils. A gradient recalled echo (GRE) localizing sequence is obtained in the transverse plane. Coronal three-dimensional spoiled gradient-recalled-echo (SPGR) MR angiography acquisition is then prescribed for transverse images. The SPGR sequence is completed during a breath-hold of 20 to 25 seconds, and the entire study is completed in 30 to 45 seconds.22 Oudkerk and associates49 have performed the largest study of Gd-MRA, in which 118 patients underwent Gd-MRA followed by pulmonary angiography. The reported sensitivity and specificity were 77% and 98%, respectively. The high specificity allows patients with positive results to be treated with confidence.
RT-MRI is a technique timed to take images gated to the patient’s respiratory cycle and uses a principle similar to the one used in electrocardiographic-gated CT scanners. Hence, it eliminates breath-hold and also produces T-2 weighted images, allowing thrombus imaging without the use of any contrast.50 Also, it has a higher sensitivity in comparison to Gd-MRA.
Advantages and Limitations
In general, MR techniques are harmless and considered safe for the pregnant population as well. Also, they do not cause any end-organ toxicity effects. The major limitation is its low sensitivity rate but its combination with lower extremity imaging may improve the diagnosis. The most important contraindication for MRI is an electronic implanted device. There have been reports of fatal arrhythmias caused by cardiac pacemaker failure; hence, they are strongly contraindicated. Nerve stimulators, cardiac defibrillators, cochlear implants, insulin pumps, continuous medicine pumps, prosthetic devices, and metallic fragments such as bullets and shrapnel are among other pertinent contraindications because they may move during the course of MRI.52 Rarely, burns have been reported in patients with tattoos.51 Gadolinium-based contrast agents are considered to be less toxic, with an incidence of adverse events of 1.47%,52 but they have been implicated by the U.S. Food and Drug Administration (FDA) in patients with renal failure as the cause of nephrogenic systemic fibrosis (NSF), which tends to be a progressive fatal condition.
DIFFERENTIAL DIAGNOSIS
SYNOPSIS OF TREATMENT OPTIONS
CONCLUSION
What the Referring Physician Needs to Know
 The interpreting physician should diagnose and inform the referring physician about the findings of acute pulmonary embolism so that prompt medical treatment can be initiated. He or she should also specify about any right ventricular strain, if any, because this helps establish the severity of the disease.


Anderson DR, Kahn SR, Rodger MA, et al. Computed tomographic pulmonary angiography vs. ventilation-perfusion lung scanning in patients with suspected pulmonary embolism: a randomized controlled trial. JAMA. 2007;298:2743-2753.
Bhalla S, Lopez-Costa I. MDCT of acute thrombotic and nonthrombotic pulmonary emboli. Eur J Radiol. 2007;64:54-64.
Clemens S, Leeper KVJr. Newer modalities for detection of pulmonary emboli. Am J Med. 2007;120(Suppl 2):S2-S12.
Gotway MB, Reddy GP, Dawn SK. Pulmonary thromboembolic disease. In: Webb WR, Higgins CB, editors. Thoracic Imaging. In Pulmonary and Cardiovascular Radiology. Philadelphia: Lippincott Williams & Wilkins; 2005:609-629.
Martine RJ, Massimo P, Lawrence RG. Management of suspected acute pulmonary embolism in the era of CT angiography: a statement from the Fleischner Society. Radiology. 2007;245:315-329.
Mir MA. Excluding pulmonary embolism with computed topographic pulmonary angiography or ventilation-perfusion lung scanning. JAMA. 2007;298:2743-2753.
Sostman HD, Stein PD, Gottschalk A, et al. Acute pulmonary embolism: sensitivity and specificity of ventilation-perfusion scintigraphy in PIOPED II study. Radiology. 2008;246:941-946.
Stein PD, Fowler SE, Goodman LR, et al. Multidetector computed tomography for acute pulmonary embolism. N Engl J Med. 2006;354:2317-2327.
Stillman AE, Oudkerk M, Ackerman M, et al. Use of multidetector computed tomography for the assessment of acute chest pain: a consensus statement of the North American Society of Cardiac Imaging and the European Society of Cardiac Radiology. Int J Cardiovasc Imaging. 2007;23:415-427.
Winer-Muram HT. Pulmonary emboli. In Gurney JW, Winer-Muram HT, Stern EJ, editors: Diagnostic Imaging: Chest, 1st ed, Salt Lake City: Amirsys, 2006. II-4-50–II-4-53
1 Boyden EA. Segmental Anatomy of the Lungs: Study of the Patterns of the Segmental Bronchi and Related Pulmonary Vessels. New York: McGraw-Hill; 1955. pp 23-32
2 Mitchell RN, Kumar V. Hemodynamic disorders, thrombosis, and shock. In: Kumar V, Cotran RS, Robbins SL, editors. Basic Pathology. 6th ed. Philadelphia: WB Saunders; 1997:60-80.
3 Wharton LR, Pierson JW. Minor forms of pulmonary embolism after abdominal operations. JAMA. 1922;79:1904-1910.
4 Haines ST. Venous thromboembolism: pathophysiology and clinical presentation. Am J Health Syst Pharm. 2003;60(Suppl 7):S3-S5.
5 Wood KE. The presence of shock defines the threshold to initiate thrombolytic therapy in patients with pulmonary embolism. Intens Care Med. 2002;28:1537-1546.
6 Konstantinides S, Geibel A, Olschewski M, et al. Association between thrombolytic treatment and the prognosis of hemodynamically stable patients with major pulmonary embolism: results of a multicenter registry. Circulation. 1997;96:882-888.
7 Stein PD, Henry JW. Prevalence of acute pulmonary embolism among patients in a general hospital and at autopsy. Chest. 1995;108:978-981.
8 Virchow RLK Thrombosis and Emboli, 1846-1856 Translated by Matzdorff AC, Bell WR. 1998. Science History Publications. Sagamore Beach, Mass.
9 The PIOPED Investigators. Value of the ventilation/perfusion scan in acute pulmonary embolism. Results of the prospective investigation of pulmonary embolism diagnosis (PIOPED). JAMA. 1990;263:2753-2759.
10 Ginsberg JS, Wells PS, Kearon C, et al. Sensitivity and specificity of a rapid whole-blood assay for D-dimer in the diagnosis of pulmonary embolism. Ann Intern Med. 1998;129:1006-1011.
11 Van Belle A, Buller HR, Huisman MV, et al. Effectiveness of managing suspected pulmonary embolism using an algorithm combining clinical probability, D-dimer testing, and computed tomography. JAMA. 2006;295:172-179.
12 Wells PS, Anderson DR, Rodger M, et al. Derivation of a simple clinical model to categorize patients probability of pulmonary embolism: increasing the models utility with the SimpliRED D-dimer. Thromb Haemost. 2000;83:416-420.
13 Wicki J, Perneger TV, Junod AF, et al. Assessing clinical probability of pulmonary embolism in the emergency ward: a simple score. Arch Intern Med. 2001;161:92-97.
14 Chagnon I, Bounameaux H, Aujesky D, et al. Comparison of two clinical prediction rules and implicit assessment among patients with suspected pulmonary embolism. Am J Med. 2002;113:269-275.
15 Stein PD, Hull RD, Patel KC, et al. D-dimer for the exclusion of acute venous thrombosis and pulmonary embolism: a systematic review. Ann Intern Med. 2004;140:589-602.
16 Dunn KL, Wolf JP, Dorfman DM, et al. Normal D-dimer levels in emergency department patients suspected of acute pulmonary embolism. J Am Coll Cardiol. 2002;40:1475-1478.
17 de Moerloose P., Desmarais S., Bounameaux H., et al. Contribution of a new, rapid, individual and quantitative automated D-dimer ELISA to exclude pulmonary embolism. Thromb Haemost. 1996;75:11-13.
18 Wells PS, Anderson DR, Rodger M, et al. Excluding pulmonary embolism at the bedside without diagnostic imaging: management of patients with suspected pulmonary embolism presenting to the emergency department by using a simple clinical model and D-dimer. Ann Intern Med. 2001;135:98-107.
19 Westmark N. On the roentgen diagnosis of lung embolism. Acta Radiol. 1938;19:357-372.
20 Hampton AO, Castleman B. Correlation of postmortem chest teleroentgenograms with autopsy findings: with special reference to pulmonary embolism and infarction. AJR. 1940;43:305-326.
21 Fleischner FG. Pulmonary embolism. Clin Radiol. 1962;13:169-182.
22 Gotway MB, Reddy GP, Dawn SK. Pulmonary thromboembolic disease. In: Webb WR, Higgins CB, editors. Thoracic Imaging. Philadelphia: Lippincott Williams & Wilkins; 2005:609-629.
23 Kipper MS, Moser KM, Kortman KE, Ashburn WL. Long-term follow-up in patients with suspected pulmonary embolism and a normal lung scan. Chest. 1982;82:411-415.
24 Hull RD, Raskob GE, Coates G, Panju AA. Clinical validity of a normal perfusion lung scan in patients with suspected pulmonary embolism. Chest. 1990;97:23-26.
25 Van Beek EJ, Kuyer PM, Schenk BE, et al. A normal perfusion scan in patients with clinically suspected pulmonary embolism: frequency and clinical validity. Chest. 1995;108:170-173.
26 Stein PD, Alavi A, Gottschalk A, et al. Usefulness of non-invasive diagnostic tools for diagnosis of acute pulmonary embolism in patients with a normal chest radiograph. Am J Cardiol. 1991;67:1117-1120.
27 Forbes KP, Reid JH, Murchison JT. Do preliminary chest x-ray findings define the optimum role of pulmonary scintigraphy in suspected pulmonary embolism? Clin Radiol. 2001;56:397-400.
28 Stein PD, Terrin ML, Gottschalk A, et al. Value of ventilation/perfusion scans compared to perfusion scans alone in acute pulmonary embolism. Am J Cardiol. 1992;69:1239-1241.
29 Miniati M, Pistolesi M, Marini C, et al. Value of perfusion lung scan in the diagnosis of pulmonary embolism: results of the Prospective Investigative Study of Acute Pulmonary Embolism Diagnosis (PISA-PED). Am J Respir Crit Care Med. 1996;154:1387-1393.
30 Parker MS, Hui FK, Camacho MA. Female breast radiation exposure during CT pulmonary angiography. Am J Roentgenol. 2005;185:1228-1233.
31 Reinartz P, Wildberger JE, Schaefer W, et al. Tomographic imaging in the diagnosis of pulmonary embolism: a comparison between V/Q lung scintigraphy in SPECT technique and multislice spiral CT. J Nucl Med. 2004;45:1501-1508.
32 Senden TJ, Moock KH, Gerald JF, et al. The physical and chemical nature of technegas. J Nucl Med. 1997;38:1327-1333.
33 Hartmann IJ, Hagen PJ, Stokkel MP, et al. Technegas versus 81mKr ventilation-perfusion scintigraphy: a comparative study in patients with suspected acute pulmonary embolism. J Nucl Med. 2001;42:393-400.
34 Goodman LR, Curtin JJ, Mewissen MW, et al. Detection of pulmonary embolism in patients with unresolved clinical and scintigraphic diagnosis: helical CT versus angiography. Am J Roentgenol. 1995;164:1369-1374.
35 Garg K, Welsh CH, Feyerabend AJ, et al. Pulmonary embolism: diagnosis with spiral CT and ventilation-perfusion scanning-correlation with pulmonary angiographic results or clinical outcome. Radiology. 1998;208:201-208.
36 Herold CJ. Spiral computed tomography of pulmonary embolism. Eur Respir J. 2002;35(Suppl):13S-21S.
37 Perrier A, Howarth N, Didier D, et al. Performance of helical computed tomography in unselected outpatients with suspected pulmonary embolism. Ann Intern Med. 2001;135:88-97.
38 Musset D, Parent F, Meyer G, et al. Diagnostic strategy for patients with suspected pulmonary embolism: a prospective multicenter outcome study. Lancet. 2002;360:1914-1920.
39 Miller GA, Sutton GC, Kerr IH, et al. Comparison of streptokinase and heparin in treatment of isolated acute massive pulmonary embolism. Br Med J. 1971;2:681-684.
40 Schoepf UJ. Diagnosing pulmonary embolism: time to rewrite the textbooks. Int J Cardiovasc Imaging. 2005;21:155-163.
41 Oser RF, Zuckerman DA, Gutierrez FR, Brink JA. Anatomic distribution of pulmonary emboli at pulmonary angiography: implications for cross-sectional imaging. Radiology. 1996;199:31-35.
42 Shrimpton PC, Edyvean S. CT scanner dosimetry. Br J Radiol. 1998;71:1-3.
43 Wiest PW, Locken JA, Heintz PH, Mettler FAJr. CT scanning: a major source of radiation exposure. Semin Ultrasound CT MR. 2002;23:402-410.
44 Thomsen HS, Marcos SK. Management of acute adverse reactions to contrast media. Eur Radiol. 2004;14:476-481.
45 Perrier A, Roy PM, Sanchez O, et al. Multidetector-row computed tomography in suspected pulmonary embolism. N Engl J Med. 2005;352:1760-1768.
46 Stein PD, Fowler SE, Goodman LR, et al. Multidetector computed tomography for acute pulmonary embolism. N Engl J Med. 2006;354:2317-2327.
47 Cham MD, Yank Levitz DF, Henchmen CI. Thromboembolic disease detection at indirect CT venography versus CT pulmonary angiography. Radiology. 2005;234:591-594.
48 Pedersen MR, Fisher MT, van Beek EJ. MR imaging of the pulmonary vasculature—an update. Eur Radiol. 2006;16:1374-1386.
49 Oudkerk M, van Beek EJ, Wielopolski P, et al. Comparison of contrast-enhanced magnetic resonance angiography and conventional pulmonary angiography for the diagnosis of pulmonary embolism: a prospective study. Lancet. 2002;359:1643-1647.
50 Kluge A, Muller C, Hansel J, et al. Real-time MR with TrueFISP for the detection of acute pulmonary embolism: initial clinical experience. Eur Radiol. 2004;14:709-718.
51 Kanal E, Borgstede JP, Barkovich AJ, et alAmerican College of Radiology Blue Ribbon Panel on MR Safety ACR white paper of magnetic resonance (MR) safety: combined papers of 2002 and 2004 ACR Practice Guidelines and Clinical Standards. Available at http://www.acr.org/SecondaryMainMenuCategories/quality_safety/guidelines/WhitePaperonMRSafetyCombinedPapersof2002and2004Doc11.aspx Accessed September 14, 2009
52 Niendorf HP, Haustein J, Cornelius I, Alhassan A, Clauss W. Safety of gadolinium-DTPA: extended clinical experience. Magn Reson Med. 1991;22:222-232.
