[level-membership-for-emergency-medicine-category]Chapter 78
Acute Coronary Syndrome
Epidemiology
Ischemic heart disease and CAD continue to be the leading causes of death among adults in many developed countries. Ischemic heart disease accounts for nearly 1 million deaths in the United States annually, of which approximately 160,000 occur in persons 65 years of age or younger. More than half of all deaths from cardiovascular disease occur in women, and CAD remains a major cause of morbidity and mortality in women beyond their middle to late fifties. The incidence of cardiovascular disease is expected to continue to increase owing to lifestyle and behavioral changes that promote heart disease.1
A significant reduction in age-adjusted mortality from CAD has occurred in the United States over the past four decades.2,3 In large part, the decline has been accompanied by diminished mortality from AMI. This decrease is a result of a reduction in the incidence of AMI by 25% and a sharp drop in the case-fatality rate. Reduction in cigarette smoking, management of lipids, and improved management of hypertension and diabetes mellitus undoubtedly play a role, along with significant advances in medical treatment.
In 2005, 5.8 million patients were evaluated for chest pain or related complaints in EDs in the United States, constituting 5% of all ED visits. In 2004, 4.1 million visits to the ED had a primary diagnosis of cardiovascular disease, and over 1.5 million patients were hospitalized for a primary or secondary diagnosis of ACS.4–7 In addition, approximately 2% of patients with ACS are discharged from the ED. In the United States, approximately 900,000 persons every year experience an AMI, of whom 20% die before reaching the hospital, and 30% die within 30 days.8,9 The majority of fatalities from CAD occur outside the hospital, usually from an ACS-related dysrhythmia within 2 hours of onset of symptoms. For many patients who experience a nonfatal AMI, their lives are limited by an impaired functional status, anginal symptoms, and a diminished quality of life. The economic cost of ACS is estimated to be $100 to $120 billion annually.10
Spectrum of Disease
Acute Myocardial Infarction
Acute myocardial infarction is defined as myocardial cell death and necrosis of the myocardium. The four-decade-old World Health Organization (WHO) definition for AMI has been replaced by clinical criteria developed jointly by the European Society for Cardiology and American College of Cardiology (ACC) that focus on defining infarction as any evidence of myocardial necrosis. This definition for an acute, evolving, or recent MI requires a typical rise and fall of a cardiac biochemical marker, currently troponin, with clinical symptoms, ECG changes, or coronary artery abnormalities based on interventional evaluation.11 The actual definition,11 referred to as the “Universal Definition of Myocardial Infarction,” includes the following; either one of these criteria satisfies the diagnosis for an acute, evolving, or recent MI:
1. Typical rise and gradual fall or more rapid rise and fall of biochemical markers of myocardial necrosis with at least one value above the 99th percentile of the upper reference limit (URL) and with at least one of the following clinical parameters:
Furthermore, regarding an established MI, any one of the following criteria satisfies this diagnosis11:
• Development of new pathologic Q waves on serial ECGs. The patient may or may not remember previous symptoms. Biochemical markers of myocardial necrosis may have normalized, depending on the length of time since the infarct developed.
• Imaging evidence of a region of loss of viable myocardium that is thinned and fails to contract, in the absence of a nonischemic cause.
• Type 1—Spontaneous MI related to ischemia resulting from a primary coronary event, such as plaque erosion rupture, erosion, fissuring, or dissection with accompanying thrombus formation and vasospasm. Type 1 infarctions represent the “true” ACS event.
• Type 2—MI secondary to ischemia caused by either increased oxygen demand or decreased supply, as seen in coronary artery spasm, coronary embolism, severe anemia, compromising arrhythmias, or significant systemic hypotension.
• Type 3—Sudden unexpected cardiac death, including cardiac arrest, often with symptoms suggestive of myocardial ischemia, accompanied by presumably new ST segment elevation or new left bundle branch block (LBBB) pattern. Fresh coronary thrombus is noted via either angiography or autopsy; death occurs before appropriate sampling of the blood to detect the abnormal cardiac biomarker.
• Type 4—MI associated with coronary instrumentation, such as occurring after percutaneous coronary intervention (PCI). For PCIs in patients with normal baseline troponin values, elevations of cardiac biomarkers above the 99th percentile URL are indicative of periprocedural myocardial necrosis. By convention, increases of biomarkers greater than 3 times the 99th percentile URL are designated as defining PCI-related MI. A subtype related to a documented stent thrombosis is similarly recognized.
• Type 5—MI associated with coronary artery bypass grafting (CABG). For CABG in patients with normal baseline troponin values, elevations of cardiac biomarkers above the 99th percentile URL are indicative of periprocedural myocardial necrosis. By convention, increases of biomarkers greater than five times the 99th percentile URL plus any of the following are designated as defining CABG-related MI:
AMI is further classified by findings on the ECG at presentation, as either STEMI or NSTEMI. Previous descriptors, such as transmural and nontransmural, as well as Q wave and non–Q wave MI, fail to adequately describe the coronary event and its related pathophysiology, electrocardiographic presentation, and pathologic outcome. The differentiation between STEMI and NSTEMI has important implications in terms of management, outcome, and prognosis for patients with AMI. In fact, the ACC and the American Heart Association (AHA) have separate clinical guidelines for the management of patients with UA/NSTEMI and those patients with STEMI.6,7,12
Pathophysiology
The underlying pathophysiology of ACS is myocardial ischemia as a result of inadequate perfusion to meet myocardial oxygen demand. Myocardial oxygen consumption is determined by heart rate, afterload, contractility, and wall tension. Inadequate perfusion most commonly results from coronary arterial vessel stenosis as a result of atherosclerotic CAD. Usually the reduction of coronary blood flow does not cause ischemic symptoms at rest until the vessel stenosis exceeds 95%. Myocardial ischemia, however, may occur with exercise and increased myocardial oxygen consumption with as little as 60% vessel stenosis.13
CAD is characterized by thickening and obstruction of the coronary vessel arterial lumen by atherosclerotic plaques. Although atherosclerosis is usually diffuse and multifocal, individual plaques vary greatly in composition. Fibrous plaques are considered stable but can produce anginal symptoms with exercise and increased myocardial oxygen consumption because of the reduction in coronary artery blood flow through the fixed, stenotic lesions. Vulnerable or unstable fibrolipid plaques consist of a lipid-rich core separated from the arterial lumen by a fibromuscular cap. These lesions are likely to rupture, resulting in a cascade of inflammatory events, thrombus formation, and platelet aggregation that can cause acute obstruction of the arterial lumen and myocardial necrosis.14
In the setting of UA, acute stenosis of the vessel is noted; complete obstruction, however, is encountered in only 20% of cases. In these cases, it is likely that extensive collateral vessel circulation prevents total cessation of blood flow, averting frank infarction.13 With AMI, the occlusive fibrin-rich thrombus is fixed and persistent, resulting in myonecrosis of the cardiac tissue supplied by the affected artery. Angiographic studies demonstrate that the preceding coronary plaque lesion is often less than 50% stenotic, indicating that the most important factors in the infarction are the acute events of plaque rupture, platelet activation, and thrombus formation rather than the severity of the underlying coronary artery stenosis.
Clinical Features
Preadmission Evaluation
Appropriate pharmacotherapy for persistent anginal chest pain in the preadmission setting includes sublingual NTG, oral aspirin (acetylsalicylic acid [ASA]) that is preferably chewed, and intravenous morphine sulfate; the acronym MONA summarizes preadmission pharmacotherapeutic interventions (morphine, oxygen, nitroglycerin, and aspirin). Establishment of the diagnosis of ACS in this setting is difficult, however, as chest pain is a poor predictor of the diagnosis and adjunctive tools are limited.15 Preadmission 12-lead ECG offers high specificity (99%) and positive predictive value (93%) for AMI in patients with atraumatic chest pain while increasing the paramedic scene time by an average of only 3 minutes. This approach offers many advantages, including (1) earlier detection of STEMI, (2) ability to base the destination on the availability of PCI, and (3) more rapid reperfusion therapy.7 Preadmission 12-lead ECG would be necessary in the limited populations in whom preadmission fibrinolytic therapy might be applicable, such as those with prolonged out-of-hospital times (90-120 minutes).
Emergency Department Evaluation
Traditionally, a history of risk factors for CAD is sought; these include male gender, age, tobacco smoking, hypertension, diabetes mellitus, hyperlipidemia, family history, artificial or early menopause, and chronic cocaine abuse. Approximately 80% of a population of more than 122,000 patients with known CAD had at least one of the four conventional risk factors (diabetes mellitus, cigarette smoking, hypertension, or hyperlipidemia).16 Cardiac risk factor burden has little impact on the ED diagnosis of ACS; however, in patients older than 40 years, ACS is 22 times more likely if four of the five major risk factors (diabetes mellitus, smoking, hypertension, hyperlipidemia, and family history) are present (compared with none).17 Nevertheless, Bayesian analysis indicates that risk factors are a populational phenomenon and do not increase or decrease the likelihood of any condition in any one patient. Thus the presence of an individual risk factor or a collection of risk factors is far less important in diagnosing acute cardiac ischemia in the ED than the history of presenting illness, prior diagnosis of ischemic cardiac disease in the patient, the presence of ST segment or T wave changes, or cardiac marker abnormalities.18
Risk assessment tools, such as the PURSUIT (Platelet Glycoprotein IIb-IIIa in Unstable Angina: Receptor Suppression Using Integrilin Therapy) risk model, the GRACE (Global Registry of Acute Coronary Events) risk model, and the TIMI (Thrombolysis in Myocardial Infarction) risk score, can be used to determine risk of death and ischemia in NSTEMI and STEMI. The TIMI risk score assigns a point each for seven factors based on history, cardiac markers, and the ECG. It can be accessed at www.timi.org.6 Although these tools may aid in decision-making and in risk stratification for patients to properly determine their disposition (telemetry bed vs. intensive care unit), none of them are designed to identify patients who may safely be discharged home.
There are several nontraditional risk factors for coronary disease. Antiphospholipid syndrome, rheumatoid arthritis, human immunodeficiency virus (HIV),19 and particularly systemic lupus erythematosus (SLE) are associated with a higher risk of cardiovascular disease.20 Women with SLE who are 35 to 44 years of age are over more than 50 times more likely to have an MI than a similar age- and gender-matched Framingham population.21
The Classic History
The term angina refers to “tightening,” not pain. Classic angina pectoris may not be pain at all but rather a “discomfort,” with a “squeezing,” “pressure,” “tightness,” “fullness,” “heaviness,” or “burning” sensation. Classically, it is substernal or precordial in location and may radiate to the neck, jaw, shoulders, or arms. If the discomfort does extend down the arm, it classically involves the ulnar aspect. Discomfort in the left chest and radiation to left-sided structures is typical, but location and radiation to both sides or to only the right side may be consistent with angina. Radiation of the discomfort to the right arm or shoulder, or to both arms or shoulders, exceeds radiation to the left arm or shoulder in terms of likelihood of the chest pain being caused by ACS, although all exceed a positive likelihood ratio of 2.22,23
Furthermore, classic features of angina pectoris include exacerbation with exertion, a heavy meal, stress, or cold, and alleviation with rest. The onset of pain at rest in no way excludes the diagnosis of angina. Anginal discomfort characteristically lasts from 2 to 5 minutes up to 20 minutes, and it is rare for it to last only a few seconds or to endure for hours or incessantly, “all day” (Table 78-1).
Table 78-1
Clinical Characteristics of Classic Anginal Chest Discomfort
| CHARACTERISTIC | MORE LIKELY TO BE ANGINA | LESS LIKELY TO BE ANGINA |
| Type of pain | Dull, pressure | Sharp, stabbing |
| Duration | 2-5 min, often 15-20 min | Seconds or hours |
| Onset | Gradual | Rapid |
| Location | Substernal | Lateral chest wall, back |
| Reproducible | With exertion | With inspiration |
| Associated symptoms | Present | Absent |
| Palpation of chest wall | Not painful | Painful, exactly reproduces pain complaint |
Adapted from Zink BJ: Angina and unstable angina. In Gibler WB, Aufderheide TP (eds): Emergency Cardiac Care. St. Louis, Mosby, 1994.
Symptoms characteristically associated with angina pectoris, or other entities of ACS, include dyspnea, nausea, vomiting, diaphoresis, weakness, dizziness, excessive fatigue, or anxiety (Table 78-2). If these symptoms arise, either alone or in combination, as a presenting pattern of known ischemic coronary disease, they are termed anginal equivalent symptoms. Recognition that coronary ischemia may arise with an anginal equivalent rather than a classic symptom is the key to understanding the atypical presentation of ACS. Complaints of “gas,” “indigestion,” or “heartburn” in the absence of a known history of gastroesophageal reflux disease, or if the heartburn is different from the patient’s usual gastroesophageal reflux, or reproducible pain on abdominal palpation should raise suspicion of ACS. Gastroesophageal reflux disease is a common misdiagnosis in cases of missed ACS.
Table 78-2
Symptoms of Acute Myocardial Infarction: Typical and Atypical
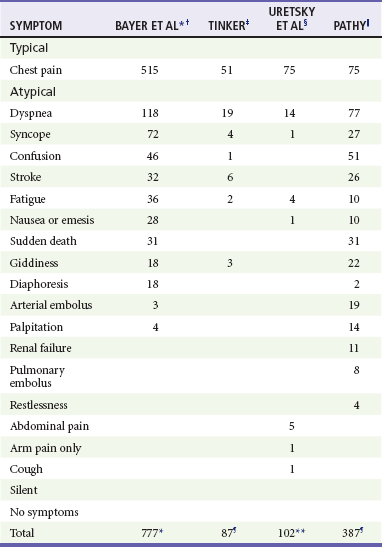
*Patients able to report multiple symptoms; therefore total exceeds 777.
†Bayer AJ, et al: Changing presentation of myocardial infarction with increasing age. J Am Geriatr Soc 34:263, 1986.
‡Tinker GM: Clinical presentation of myocardial infarction in the elderly. Age Ageing 10:237-240, 1981.
§Uretsky BF, Farquhar DS, Berezin AF, et al: Symptomatic myocardial infarction without chest pain: Prevalence and clinical course. Am J Cardiol 40:498-503, 1977.
||Pathy MS: Clinical presentation of myocardial infarction in the elderly. Br Heart J 29:190-198, 1967.
¶Patients classified by principal symptom, although all patients with complaint of chest or epigastric discomfort were placed in typical group.
**Same as ¶, except patients with epigastric complaints were placed in atypical group.
Adapted from Scott PA, Gibler WB, Dronen SC: Acute myocardial infarction presenting as flank pain and tenderness: Report of a case. Am J Emerg Med 9:547, 1991.
The Atypical History
A description of typical symptoms (crushing, retrosternal chest pain or pressure) is often lacking in ACS; this may be a result of atypical features of the pain (e.g., character, location, duration, exacerbating and alleviating factors) or the presence of anginal equivalent symptoms (e.g., dyspnea, nausea, vomiting, diaphoresis, indigestion, syncope). Patients with an ultimate diagnosis of AMI or UA can have pain that is pleuritic, positional, or reproduced by palpation. Some patients describe their pain as burning or indigestion, sharp, or stabbing (see Table 78-2).23,24
In a large study of nearly 435,000 patients ultimately diagnosed with AMI, one third did not have chest pain on presentation.25 Multiple studies have identified risk factors for atypical presentation of ACS: diabetes mellitus, older age, female gender, nonwhite ethnicity, dementia, no prior history of MI or hypercholesterolemia, no family history of coronary disease, and previous history of congestive heart failure (CHF) or stroke.25–27 In patients with AMI or UA, atypical presenting complaints include dyspnea, nausea, diaphoresis, syncope, or pain in the arms, epigastrium, shoulder, or neck.
Atypical features of ACS are present with increasing frequency in sequentially older populations. Before age 85, chest pain is found in the majority of patients with acute MI, although dyspnea, stroke, weakness, and altered mental status are notably present. In those older than 85 years, however, atypical symptoms are more common than chest pain, with 60 to 70% of patients older than 85 having an anginal equivalent complaint, especially dyspnea.27 Coincident ACS is more likely to occur in the elderly; patients with another acute condition (e.g., trauma, infection) should be scrutinized for concurrent ACS.28
Patients with diabetes mellitus are at heightened risk for ACS as well as an atypical presentation, such as dyspnea, nausea or vomiting, confusion, or fatigue. Medically unrecognized AMI can occur in 40% of patients with diabetes mellitus compared with 25% of a nondiabetic population, and myocardial scar unaccompanied by antemortem diagnosis of MI is three times more likely in diabetics.29
As with age and diabetes, female gender is an important risk factor for MI without chest pain. In some series, less than 60% of women reported chest discomfort at the time of their MI, with others reporting dyspnea, indigestion, or vague symptoms, such as weakness, unusual fatigue, cold sweats, sleep disturbance, anxiety, or dizziness.30
Finally, nonwhite racial and ethnic populations may have atypical symptoms in ACS.25 Compelling data demonstrate a disparity in treatment approach related to race in patients with acute manifestations of coronary heart disease.31 Whether this is related to the atypical nature of presenting symptoms in different racial groups is not clear. Although certain features of the chest pain history serve to increase or decrease the likelihood of ACS, none of them is strong enough to endorse discharge of the patient based on the history alone.24
Physical Examination
The physical examination focuses on the cardiac, pulmonary, abdominal, and neurologic examinations, looking for signs of complications of ACS as well as alternative diagnoses for chest pain and the anginal equivalent syndromes (Table 78-3). Altered mental status, diaphoresis, and signs of CHF are all ominous findings in patients with symptoms consistent with ACS. Historical studies using untrained physicians identified chest wall tenderness or “reproducible” chest wall tenderness in up to 15% of patients ultimately diagnosed with AMI, but these data are highly suspect. The real incidence of truly reproducible chest wall tenderness (i.e., when the patient reliably identifies to the examiner that the pain produced on palpation is identical to the pain causing the patient’s presentation) in ACS is probably very small. It is suggested that patients with chest pain that is fully pleuritic, positional, or reproducible by palpation (the three Ps) are at low risk (yet not no risk) for ACS.22
Table 78-3
Key Entities in the Differential Diagnosis of Chest Pain
| Acute myocardial infarction | Unstable angina |
| Stable angina | Prinzmetal’s angina |
| Pericarditis | Myocardial or pulmonary contusion |
| Pneumonia | Pulmonary embolism |
| Pneumothorax | Pulmonary hypertension |
| Pleurisy | Aortic dissection |
| Boerhaave’s syndrome | Gastroesophageal reflux |
| Peptic ulcer disease | Gastritis or esophagitis |
| Esophageal spasm | Mallory-Weiss syndrome |
| Cholecystitis or biliary colic | Pancreatitis |
| Herpes zoster | Musculoskeletal pain |
Outcomes in Atypical Presentations
Not surprisingly, atypical presentation of patients with ACS is associated with a delay in diagnosis and poorer outcomes. In the Second National Registry of Myocardial Infarction (NRMI-2) study, patients with MI without chest pain were significantly more likely to die in the hospital (23 vs. 9% for patients with chest pain) and were more likely to experience stroke, hypotension, or heart failure that required intervention, possibly reflecting the older age and greater comorbidity in this group.25 Patients with atypical symptomatology seek medical care later and are less likely to receive standard therapies, such as aspirin, beta-adrenergic blockers, heparin, fibrinolysis, and emergent reperfusion therapy.25 Patients 65 years of age or younger with NSTEMI have a 1% chance of dying during their hospitalization, but this risk is increased to 10% for patients ages 85 years and older.28
Missed Diagnosis of Acute Coronary Syndrome
Approximately 2% to 4% of patients with acute MI in the ED are discharged without diagnosis.32 Missed ACS is the misdiagnosis that accounts for the largest amount of payment by emergency physicians in medical malpractice claims. Atypical presenting symptoms are an obvious causative consideration. Patients with undiagnosed ACS discharged from the ED are younger, more likely to be women or nonwhite, more likely to have atypical complaints, and less likely to have ECG evidence of acute ischemia.32,33 Among all patients with cardiac ischemia, women younger than 55 years seem to be at highest risk for inappropriate discharge. With respect to ECG findings, 53% of patients with missed AMI and 62% of patients with missed UA have normal or nondiagnostic ECGs. Finally, the risk-adjusted mortality ratio for all patients with acute cardiac ischemia is 1.9 times higher among nonhospitalized patients.32 Factors associated with misdiagnosis of ACS in medical malpractice closed claims analysis include physicians with less experience who document histories less clearly, admit fewer patients, and misinterpret the ECG.
Early Complications of Acute Myocardial Infarction
Bradydysrhythmia and atrioventricular (AV) conduction block occur in 25 to 30% of patients with AMI; sinus bradycardia is most commonly seen.34–36 Symptomatic bradydysrhythmias in the first few hours after inferior AMI tend to be atropine responsive; conduction abnormalities that appear beyond 24 hours of MI tend not to respond to atropine.37 Patients with AV block in the setting of anterior AMI tend to respond poorly to therapy and have a poor prognosis.
Stroke may also complicate AMI, most commonly ischemic or thromboembolic. The major predisposing mechanisms with a recent MI are embolization from left ventricular mural thrombus with decreased ejection fraction, embolization from the left atrial appendage with atrial fibrillation, and hypercoagulability with concomitant carotid arterial disease. The rate of stroke is higher in the setting of MI (0.9% tapering to 0.1% at day 28 after MI) than in control subjects (0.014%).38
Hemorrhagic stroke is an obvious concern in the patient undergoing fibrinolytic therapy. The rate of hemorrhagic stroke with varying fibrinolytic agents is less than 1%, although the rate climbs in older patients. PCI lowers the overall risk of stroke compared with fibrinolytic therapy. Analysis of only fibrinolytic-eligible patients from the NRMI-2 database yields more than 24,000 patients treated with alteplase and more than 4000 who received primary angioplasty. The difference in stroke rate is highly significant (1.6% in the fibrinolytic group vs. 0.7% in the angioplasty group). Considering hemorrhagic strokes, the difference is again dramatic (1.0% in the fibrinolytic group vs. 0.1% in the angioplasty group).39
Hyperglycemia in the setting of AMI may be viewed as a complication, as well as a complicating disease process in AMI. Hyperglycemia is present in up to one half of all patients with STEMI, yet only one fifth to one fourth of those patients are recognized diabetics. Elevated glucose at the time of admission has independent negative implications for mortality rates in AMI patients. Although fasting blood sugar the day after presentation is a better predictor, an admission blood glucose level higher than 200 mg/dL is linked to similar mortality rates among diabetics and nondiabetics. There is a 4% mortality increase for nondiabetic patients for every 18-mg/dL elevation in blood glucose level. Hyperglycemia seems to induce a complex set of unfavorable cellular and biochemical circumstances, including negative effects on coronary flow and microvascular perfusion, as well as adverse effects on platelet function, fibrinolysis, and coagulation. Intravenous insulin therapy for glucose normalization is linked to improved outcomes in patients with STEMI as well as those in the medical intensive care unit. ACC/AHA guidelines acknowledge that tight control of blood glucose during and after STEMI decreases acute and 1-year mortality rates.40
Diagnostic Investigations
In ACS, morphologic changes may occur in the T wave, the ST segment, the QRS complex, and even the PR segment (e.g., ST segment depression in atrial infarction or infarct-related pericarditis). Various rhythm disturbances also occur. Notably, the ECG may be normal or nonspecifically abnormal in the presence of ACS, including AMI. The ECG is limited by individual variations in coronary anatomy and preexisting coronary disease (e.g., previous MI, collateral circulation, coronary bypass surgery) and because it does not view the posterior, lateral, and apical left ventricular walls well.37 In context, a single ECG is neither 100% sensitive nor 100% specific for AMI and reflects a single point in time.
Over-reliance on a normal or nonspecifically abnormal ECG in a sensation-free patient with anginal chest pain should be avoided. Patients with an initial nondiagnostic ECG who later develop AMI during that hospitalization are often sensation free or minimally uncomfortable on presentation. These patients frequently lack a past history of ischemic heart disease. Furthermore, the total elapsed time from chest pain onset in patients with normal ECGs does not assist in ruling out the possibility of AMI in patients with chest pain with a single ECG. Although the negative predictive value is quite high, it is not 100%, even up to 12 hours after the onset of the patient’s chest symptoms.41 The patient’s history of the event—and the physician’s interpretation of the history—is the most important diagnostic study.
Electrocardiographic Abnormalities in Acute Coronary Syndromes
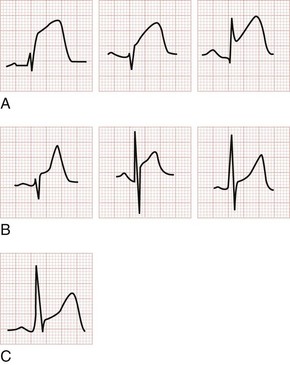
The earliest electrocardiographic finding in AMI is the hyperacute T wave, which maintains its vector but becomes tall and peaked within minutes of the interruption of blood flow. It is usually broad based and slightly asymmetrical. The hyperacute T wave progresses to ST segment elevation in classic MI. This hyperacuity may not be appreciated on the initial ECG. The differential diagnosis of the tall T wave includes hyperacute T waves of ischemia, hyperkalemia, benign early repolarization (BER), LVH, LBBB, and pericarditis (Fig. 78-1).
As the AMI progresses, ST segment elevation may become evident. Morphologic variations of ST segment elevation can be seen from the J (or junction) point at the end of the QRS complex to the apex of the T wave. This upsloping portion of the ST segment usually progresses as it elevates from flat to convex, domed or “tombstoned”; if flat, it is characteristically horizontal or oblique. At times the ST segment may be concave or scooped in its elevation with AMI.42 This morphology may progress to a convex shape or may stay the same throughout the infarction. The concave morphology, if noted in all elevated ST segments, is atypical for AMI and more commonly seen with other ST segment elevation syndromes (Table 78-4 and Fig. 78-2).43,44
Table 78-4
Differential Diagnosis of ST Segment Elevation on the Electrocardiogram
| Acute myocardial infarction | Acute pericarditis |
| Left ventricular hypertrophy | Left ventricular aneurysm |
| Ventricular paced rhythm | Benign early repolarization |
| Normal variant | Osborn wave of hypothermia |
| Hyperkalemia | Brugada’s syndrome |
| Pulmonary embolism | Acute cerebral hemorrhage |
| Prinzmetal’s angina | Postelectrical cardioversion |
ST segment elevation, both benign and pathologic, is common (see Table 78-4). Most normal ECGs, especially those of men, may have some degree of ST segment elevation—indeed, upward of 90%. This elevation is seen in the precordial leads and is usually 1 mm or more in men and 1 mm or less in women. The ST segment elevation is concave and is more prominent as the corresponding S wave becomes deeper. Because of the common occurrence of this finding, it is not a normal variant but rather a normal finding.44–47 A helpful point in differentiating normal ST segment elevation from the pathologic ST segment elevation of AMI is that the latter is a dynamic phenomenon; ECGs recorded sequentially over time with waxing and waning symptoms should demonstrate some fluctuation in the degree of ST segment deviation in the presence of ACS.
ST segment depression generally represents subendocardial or noninfarction ischemia. Ischemic ST segment depression is typically horizontal or downsloping; an upsloping contour may be seen but is less frequently associated with ischemia. Subendocardial ischemic ST segment depression may be diffuse, spanning anterior and inferior leads. The differential diagnosis of ST segment depression includes myocardial ischemia or infarction, repolarization abnormality of ventricular hypertrophy (the “strain” pattern), bundle branch block, ventricular paced rhythm (VPR), digoxin effect, hyperkalemia, hypokalemia, PE, intracranial hemorrhage, myocarditis, rate-related ST segment depression, postcardioversion of tachydysrhythmias, and pneumothorax (Fig. 78-3).
ST segment depression in ACS (1) may be seen in non–ST segment elevation AMI, (2) may precede ST segment elevation in ST segment elevation AMI, (3) may reflect a “mirror image” of ST segment elevation from posterior MI when found in the right-sided precordial leads (i.e., ST segment depression in V1 to V3 in posterior MI), and (4) may represent reciprocal ST segment depression seen with ST segment elevation AMI. With reciprocal ST segment depression, such changes are seen in leads on the “opposite” side of the heart from simultaneous ST segment elevation. For example, the ST segment depression seen in leads V1 to V3 with a posterior MI is actually a reciprocal finding resulting from the ST segment elevation that would be recorded in posterior leads V8 and V9. Inferior MI with ST segment elevation more frequently manifests reciprocal ST segment depression than does the anterior counterpart. The reciprocal ST segment depression in inferior MI is best seen in lead aVL, which is 150 degrees removed from lead III when the positive poles of these leads in the frontal plane are considered. Anterior ST segment elevation AMI may feature reciprocal ST segment depression in at least one of the inferior leads (II, III, or aVF). Reciprocal changes in the setting of STEMI increase the specificity and positive predictive value of the ECG in AMI.45,46
Ischemic ST segment depression is typically horizontal or downsloping; an upsloping contour may be seen but is less frequently associated with ischemia. Subendocardial ischemic ST segment depression may be diffuse, spanning anterior and inferior leads. The differential diagnosis of ST segment depression includes myocardial ischemia or infarction, repolarization abnormality of ventricular hypertrophy (the “strain” pattern), bundle branch block, VPR, digoxin effect, hyperkalemia, hypokalemia, PE, intracranial hemorrhage, myocarditis, rate-related ST segment depression, postcardioversion of tachydysrhythmias, and pneumothorax (see Fig. 78-3).
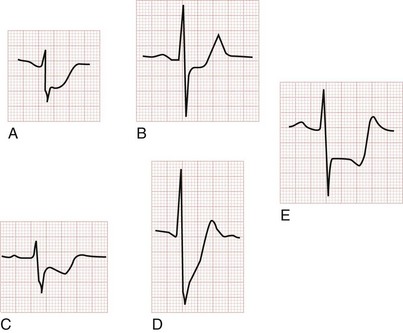
T wave inversions, although frequently nonspecific, should suggest possible myocardial ischemia. Normally the T wave is upright in the left-sided leads I, II, and V3 to V6 and inverted in the right-sided lead aVR. T wave vectors are variable in leads III, aVL, and aVF. They are usually normally inverted in V1 and are occasionally normally inverted in lead V2. The T wave inversions of ACS are classically narrow and symmetrically inverted. The preceding ST segment is typically isoelectric and may be bowed slightly upward or concave. Associated ST segment depression may occur. T wave inversions are best evaluated in comparison with the most recent prior ECG, given the multitude of normal variations (Fig. 78-4).

Although T wave inversion is sought as a harbinger of ACS, it can also occur as an evolutionary change after MI. In MI without culprit artery reperfusion, as the ST segments return to baseline the T waves may invert, although not particularly deeply. In hearts that are reperfused, T wave inversion may follow ST segment elevation, in either a biphasic or a deeply inverted morphology, an appearance much like the T wave changes of Wellens syndrome.48,49
Anatomic Location of Acute Myocardial Infarction
The regional distribution of an AMI can be derived from noting the pattern of the various morphologic changes that are described (Table 78-5). Anterior infarctions are primarily evidenced by changes in the precordial leads V1 to V4 (Fig. 78-5). Septal involvement is reflected by changes in V1 and V2. Extension to the lateral wall (i.e., anterolateral MI) is evident if the pathologic changes extend beyond leads V1 to V4 to include leads V5, V6, I, and aVL. In anterior ST segment elevation AMI, reciprocal ST segment depression may occur in leads III and aVF. The anterior wall is served by the left anterior descending artery. The first diagonal branch of the left anterior descending artery is likely to be involved when the ST segment elevation extends to leads I and aVL. Isolated occlusion of the diagonal branch of the left anterior descending artery displays similar findings, but of smaller amplitude, to those seen with left anterior descending artery occlusion (ST segment elevation in leads V2 and V3, and possibly leads V1 and V4, or both, along with ST segment depression in lead II and either III, aVF, or both).50
Table 78-5
Regional ST Segment Changes in Acute Myocardial Infarction
| LOCATION | LEADS | ST SEGMENT |
| Anterior wall MI | V1 through V4 | Elevation |
| Lateral wall MI | I, aVL, V5, and V6 | Elevation |
| Inferior wall MI | II, III, and aVF | Elevation |
| Right ventricular wall MI | V4R | Elevation |
| Posterior wall MI | V8 and V9 | Elevation |
| V1 through V3 | Depression |
Adapted from Aufderheide TP, Brady WJ: Electrocardiography in the patient with myocardial ischemia or infarction. In Gibler WB, Aufderheide TP (eds): Emergency Cardiac Care. St. Louis, Mosby, 1994.
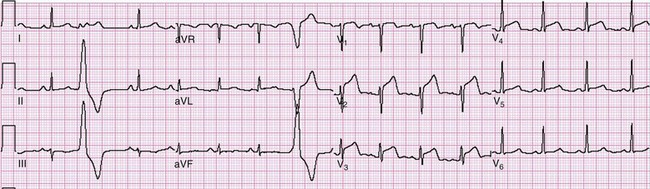
Lateral infarctions are frequently seen in concert with anterior infarction (anterolateral), inferior infarctions (inferolateral), or inferior infarctions with posterior extension (inferoposterolateral). This is because the lateral wall of the heart is variably served by the left anterior descending, right coronary, and left circumflex coronary arteries. Thus lateral involvement is manifested by changes in some or all of the lateral leads I, aVL, V5, and V6. So-called “high lateral infarctions” are restricted to leads I and aVL (Fig. 78-6) and are suggestive of occlusion of the left circumflex coronary artery; ST segment elevation in these leads may be accompanied by reciprocal ST segment depression in leads III, aVF, and V1. Based on cardiac magnetic resonance imaging localization of some of these lesions, new Q waves appearing in leads I and aVL (but not V6) indicate a “mid-anterior wall MI,” previously referred to as a “high lateral MI.”6
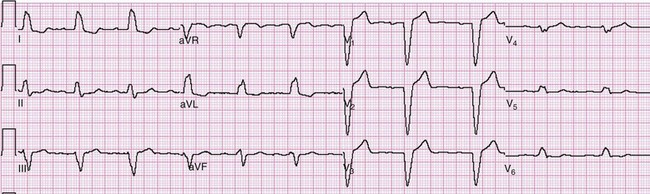
Inferior infarctions are characterized by morphologic changes in limb leads II, III, and aVF. The inferior wall of the heart and the AV node are served by the right coronary artery in roughly 90% of cases (right dominant); in the remainder, the left circumflex artery serves that function (left dominant). An inferior ST segment elevation AMI is present if two or more contiguous inferior leads (III, aVF, II) are involved; reciprocal ST segment depression is frequently seen in lead aVL, lead I, or both (Fig. 78-7) and perhaps in the anterior precordial leads: V1 less than V2 and V3. ST segment depression in leads V1 to V3 in the presence of inferior MI can be caused by reciprocal change, posterior extension, or simultaneous anterior ischemia during inferior infarction. ST segment elevation inferiorly that is greater in lead III than in lead II, accompanied by ST segment depression in lead aVL, I, or both, is 90% sensitive and 71% specific for right coronary artery occlusion.37 ST segment elevation in lead V1 in the presence of an ST segment elevation inferior MI (with elevation greater in lead III than in lead II) suggests concomitant right ventricular infarction. Coexistent reciprocal change with inferior STEMI is associated with larger infarct size and increased mortality. Occlusion of the left circumflex artery may be occult on the 12-lead ECG. If it is responsible for inferior ST segment elevation, the ST segment elevation in lead III would not be expected to exceed that seen in lead II, and lead aVL may display an isoelectric or elevated ST segment.37
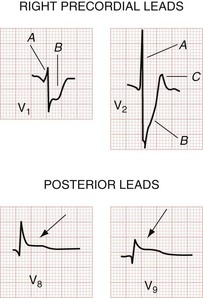
Posterior infarctions are estimated to contribute to 15 to 20% of all AMIs and are usually seen along with inferior or inferolateral infarctions. Posterior infarctions occur in isolation in about 4% of AMI cases (demonstrating elevated ST segments only in accessory leads V7 through V9).6 The culprit lesion may be in the right coronary artery, its posterior descending branch, or the left circumflex artery. In that the 12-lead ECG features no electrodes placed directly over the posterior wall of the heart, one has only the reciprocal ST segment changes in the right precordial leads (V1 to V3) with which to infer acute STEMI of the posterior wall. Findings include (1) horizontal ST segment depression; (2) a tall, upright T wave; (3) a tall, wide R wave; and (4) an R wave amplitude/S wave amplitude ratio greater than 1 (Fig. 78-8). The combination of horizontal ST segment depression with an upright T wave increases the diagnostic accuracy of the 12-lead ECG for posterior MI. In that the tall R wave in the right precordial leads is actually the mirror image of a posterior Q wave, its emergence may be delayed in posterior infarction. Additional leads (posterior leads V8 and V9) increase the sensitivity for detection of acute posterior MI. Patients with inferior MI who have either ST segment depression in leads V1 to V3 or ST segment elevation in the posterior leads V8 and V9 generally have larger infarction zones, lower resultant ejection fractions, and higher cardiovascular morbidity and mortality than patients with isolated inferior MI.39 Cardiac magnetic resonance imaging suggests that these “posterior” infarctions producing tall R waves in leads V1 and V2 are actually lateral left ventricular wall MIs.6 A consensus document suggests reclassifying posterior infarctions as inferobasal infarctions.11
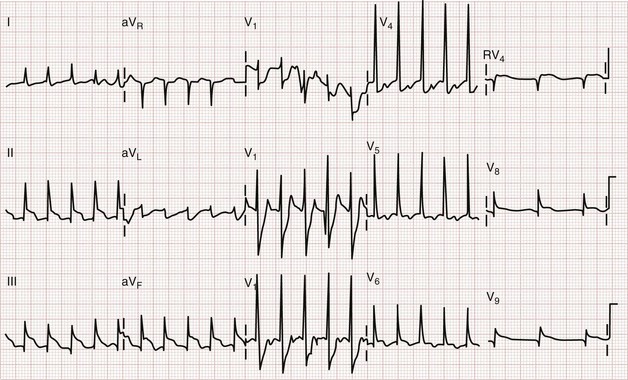
ST segment elevation in lead V1 in the setting of inferior MI (i.e., ST segment elevation in leads II, III, and aVF rather than in the setting of concomitant ST segment elevation in all anterior precordial leads) is suggestive of right ventricular infarction; this is not surprising in that lead V1 is the most rightward of the precordial leads. These changes occasionally extend into lead V2 with right ventricular infarction. ST segment elevation is usually greater in lead III than in lead II when right ventricular infarction coexists with inferior AMI.51 This logically follows in that (in the frontal plane) the positive vector of lead III is more rightward than that of lead II. Application of “right-sided” precordial leads is the best means to diagnose right ventricular infarction with the ECG. These leads, as a mirror image of the left precordial leads, demonstrate ST segment elevation with right ventricular infarction in leads V3R to V6R, with V4R having the highest sensitivity. ECG changes in the right-sided precordial leads with right ventricular infarction may be subtle owing to the smaller muscle mass of the right ventricle and the resulting diminution in QRS size (Fig. 78-9). Patients with inferior MI with concomitant right ventricular infarction have larger infarcts and experience more in-hospital complications and higher mortality rates.52
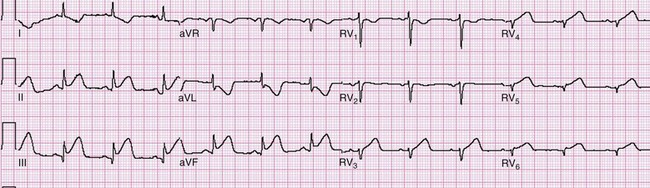
Figure 78-9 Right ventricular infarction demonstrated with right-sided precordial leads (RV1 to RV6). This tracing is taken from the same patient as in Figure 78-7. The ST segment elevation of inferior acute myocardial infarction is still present, as is the reciprocal ST segment depression in leads I and aVL. The precordial leads are right-sided chest leads, as might be inferred from the relatively low voltage. ST segment elevation is noted in leads RV3 to RV6 (V3R to V6R), consistent with right ventricular infarction.
Left Main Coronary Artery Occlusion.: In a patient with symptoms of ACS, ST segment elevation in lead aVR should prompt consideration of occlusion of the left main coronary artery. Pooled data demonstrate that ST segment elevation in lead aVR (>0.5 mV) is approximately 78% sensitive and 83% specific for left main coronary artery disease; alternatively, this finding in lead aVR may represent multivessel disease, acute proximal left anterior descending occlusion, or (less commonly) left circumflex or right coronary occlusion.53 If ST segment elevation occurs in both lead aVR and lead V1, greater elevation in the former lead favors left main disease, whereas if it is greater in the latter lead, occlusion in the left anterior descending artery is more likely.54
Electrocardiographic Differential Diagnosis of ST Segment Elevation
ST segment elevation on the ECG in the context of a presentation compatible with ACS is considered to represent acute myocardial ischemia until proved otherwise. Several other conditions, particularly LBBB and LVH, also feature ST segment elevation that mimics infarction (see Table 78-4).47 Caution is required when interpreting ST segment elevation as to the decision to administer systemic fibrinolytic therapy.55
Benign early repolarization is a normal electrocardiographic variant that does not imply, or exclude, ACS or CAD. BER includes the following electrocardiographic characteristics: (1) ST segment elevation; (2) upward concavity of the initial portion of the ST segment; (3) notching of the terminal portion of the QRS complex at the J point (i.e., junction of the QRS complex with the ST segment); (4) symmetrical, concordant T waves of large amplitude; (5) diffuse ST segment elevation on the ECG; and (6) relative temporal stability over the short term, although these changes may regress with old age. J point elevation is usually less than 3.5 mm, and the concave ST segment is usually elevated less than 2 mm (although it may be elevated as much as 5 mm in some cases) in the precordial leads and 0.5 mm in the limb leads. Maximal ST segment elevation in BER is typically seen in leads V2 to V5. Isolated BER in the limb leads is quite rare and should prompt reconsideration of AMI (Figs. 78-10A and 78-11). Reportedly, 31% of predominantly white individuals younger than 60 years who are resuscitated after idiopathic ventricular fibrillation have early repolarization changes in the inferolateral leads, as opposed to only 5% in a well-matched cohort of patients without syncope or heart disease. Whereas significant malignant dysrhythmias may occur in patients with this electrocardiographic finding, there are many who do well over a lifetime.56

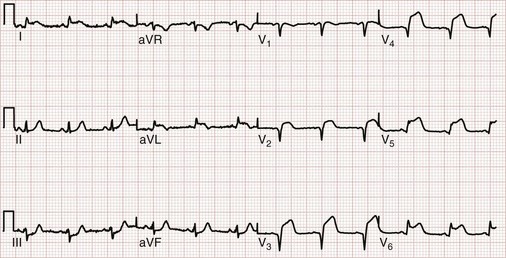
Pericarditis, in the acute phase, features diffuse ST segment elevation as well. In pericarditis the ST segments are concave with an initial upsloping contour and are usually less than 5 mm in height. Occasionally the initial contour is obliquely flat, but convex or domed ST segment morphology is suggestive of AMI. The ST segment elevation is usually seen in all leads with the exception of aVR (where it is depressed); V1 is variable. Focal pericardial inflammation manifests as a more accentuated change in the leads reflecting the affected region. PR segment depression is an insensitive yet specific associated electrocardiographic finding in pericarditis, which is typically best seen in the inferior leads and in lead V6; correspondingly, PR segment elevation may be evident in lead aVR (Fig. 78-12; see Fig. 78-10B). In that ST segment changes are encountered in such patients, the most appropriate term applied is myopericarditis, rather than pericarditis. Recall that the pericardium is electrically silent; thus, electrocardiographic changes result from epicardial irritation and ST segment elevation—hence the term myopericarditis.

Left ventricular aneurysm (LVA), wherein a focal area of myocardium paradoxically bulges outward during systole, has characteristic electrocardiographic changes that can be difficult to differentiate from those of AMI. Considerable overlap exists between populations of patients with potential for AMI and LVA, and the electrocardiographic changes of LVA tend to be regional rather than diffuse.56 Anatomically, LVA is most commonly found anteriorly, and changes are most often seen in leads V1 to V6 as well as leads I and aVL. ST segment elevation may be of any morphology (e.g., convex or concave), and Q waves may be present (Fig. 78-13). The calculation of the ratio of the amplitude of the T wave to the QRS complex may help distinguish acute anterior MI from LVA. If the ratio of the amplitude of the T wave to the QRS complex exceeds 0.36 in any single lead, the ECG probably reflects acute MI. If the ratio is less than 0.36 in all leads, however, the findings are probably a result of ventricular aneurysm.57
Left bundle branch block is a confounding pattern that reduces the ECG’s ability to detect ACS. A new, or presumably new, LBBB is strongly suggestive of ACS when noted in the appropriate clinical presentation. Preexisting LBBB, however, shares many similarities to various electrocardiographic findings of ACS. In the right precordial leads (leads V1 to V3), ST segment elevation and tall, vaulted, upright T waves mimic those seen in acute anterior MI. The QS pattern of LBBB in these leads resembles the Q waves seen in infarction. Depressed ST segments with T wave inversions are seen in some or all of the lateral leads (leads V5, V6, I, and aVL) in LBBB; both of these resemble ischemic changes seen in ACS. Yet these findings in LBBB are merely expressions of the “rule of appropriate discordance.” The ST segment and T wave vectors are expectedly discordant, or opposite in direction, to the major vector of the QRS complex in those leads. Because LBBB is a frequent finding on the ECG of a patient at risk for CAD, the normal findings in LBBB (Fig. 78-14) and the presentation of ST segment AMI in a patient with LBBB must be distinguished.
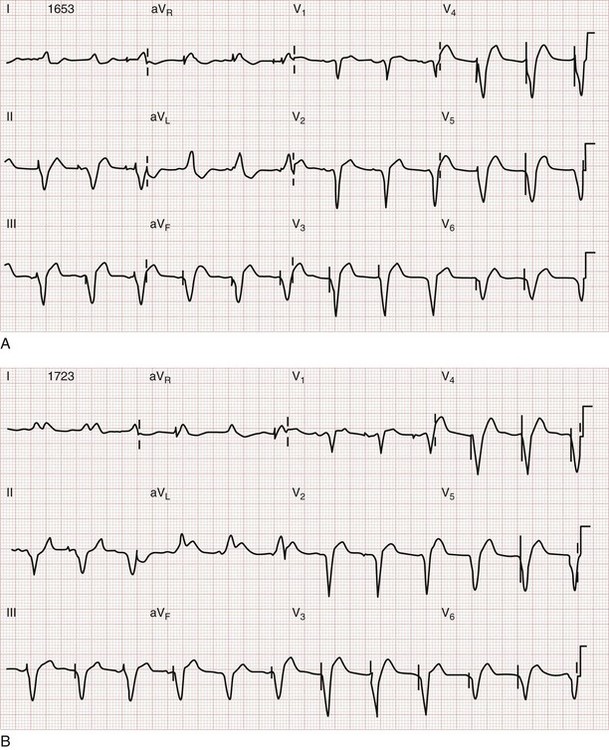
Sgarbossa used the Global Utilization of Streptokinase and t-PA for Occluded Coronary Arteries (GUSTO-I) trial database to obtain a population of patients with LBBB and enzymatic evidence of AMI.58 Three independent electrocardiographic predictors of MI in the presence of LBBB were identified: (1) ST segment elevation of at least 1 mm that is concordant with the QRS complex; (2) ST segment depression of at least 1 mm in lead V1, V2, or V3; and (3) ST segment elevation of at least 5 mm that is discordant with the QRS complex. These findings were assigned weighted scores of 5, 3, and 2, respectively. For accuracy in diagnosis, a specificity of 90% requires a score of at least 3. Thus if an ECG features only discordant ST segment elevation of 5 mm or more but neither of the other two criteria, further testing is recommended before one can conclude that the ECG is indicative of AMI (Fig. 78-15).58 Subsequent literature yields mixed reviews of the Sgarbossa criteria for diagnosis of AMI in the presence of LBBB.58,59 Ultimately the approach to the patient with LBBB and possible MI remains complicated; diagnostic adjuncts to the history and physical examination (e.g., serial ECGs, comparison with prior ECGs, echocardiography, serum cardiac marker measurement) should be liberally used when the ECG does not show obvious evidence of AMI as noted by the Sgarbossa criteria.58 A new LBBB, together with a clinical impression of AMI, remains an indication for fibrinolytic therapy or PCI.
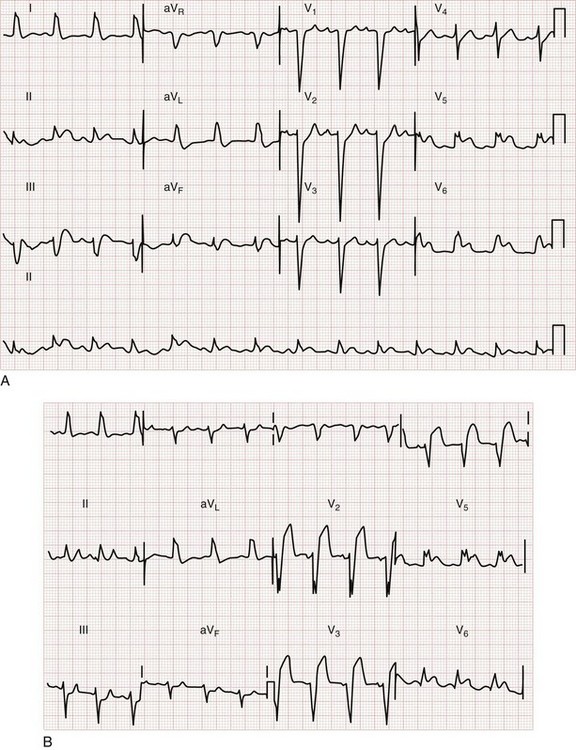
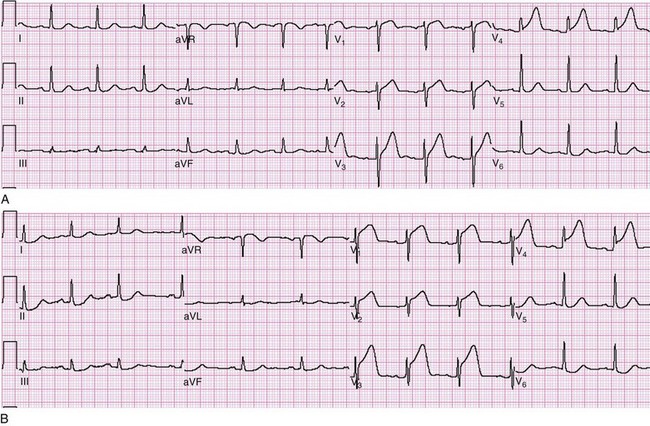
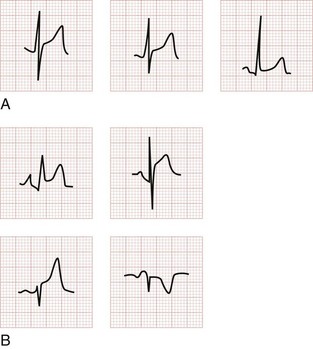
Figure 78-15 Acute myocardial infarction (AMI) in left bundle branch block (LBBB). A, Using the Sgarbossa criteria,58 there is strong evidence of AMI because of the concordant ST segment elevation greater than 1 mm in leads II, V5, and V6; also suggestive is the ST segment depression seen in V2. B, Again, applying the Sgarbossa criteria to this tracing with underlying LBBB, AMI is strongly suggested.58 There is concordant ST segment elevation in leads V5 and V6 that appears to exceed 1 mm; furthermore, there is excessively discordant ST segment elevation in leads V2 and V3, probably greater than 5 mm.
Limited data exist to guide the clinician in interpretation of the 12-lead ECG in this setting. As with the LBBB scenario, the VPR pattern represents a significant confounding variable in the evaluation of the patient with chest pain suspected of having ACS. Sgarbossa and associates advanced criteria for detection of AMI in the presence of VPR that are similar to those for LBBB.58,60 These, too, are derived from the GUSTO-I database, but from a smaller group of patients. The criteria are essentially the same as the LBBB criteria: (1) ST segment elevation of at least 5 mm that is discordant with the QRS complex; (2) ST segment elevation of at least 1 mm that is concordant with the QRS complex; and (3) ST segment depression of at least 1 mm in lead V1, V2, or V3 (Fig. 78-16).60
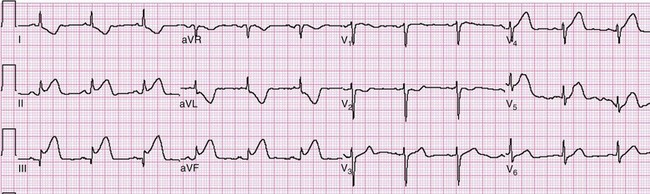
Left ventricular hypertrophy may mimic or obscure ACS on the ECG. LVH may feature prominent left-sided forces, manifesting as large rS or QS complexes in the right precordial leads—yet these changes seldom extend beyond V1 and V2 in the case of LVH. Consistent with the rule of appropriate discordance, the leads demonstrating such a pattern feature discordant ST segment elevation and tall, vaulted T waves, paralleling the changes of AMI. The initial portion of the elevated ST segment in LVH is generally concave, as opposed to the obliquely straight or convex pattern that usually (but not always) is seen with ST segment elevation in AMI. In LVH, the left precordial leads (and at times leads I and aVL) may show evidence of repolarization abnormality (or strain pattern), with ST segment depression and asymmetrically inverted T waves. The presence of this strain pattern in the left precordial leads is reassuring when ST segment elevation and tall T waves in the right precordial leads are being attributed to LVH rather than to AMI because one is essentially the mirror image of the other. The changes in LVH should be static over time (Fig. 78-17).

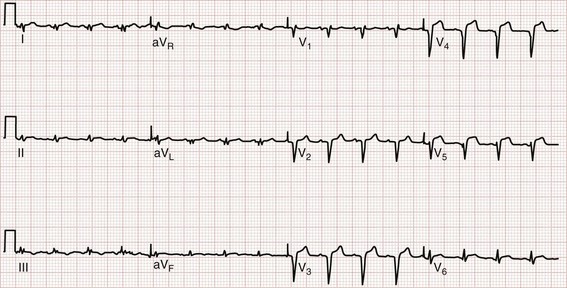
Figure 78-17 Left ventricular hypertrophy (LVH) with repolarization abnormality. This tracing demonstrates classic repolarization abnormality, with ST segment depression in the left-sided precordial leads following large-amplitude R waves. The T waves in these leads are asymmetrically inverted. The right precordial leads (V1 and V2) show a mirror image of the changes seen in V3 to V6, with slight ST segment elevation (contour initially concave) and asymmetric tall T waves. See Figure 78-20B for evidence of evolving acute myocardial infarction in a patient with LVH and repolarization abnormality.
Takotsubo cardiomyopathy is referred to as left apical ballooning or “broken heart” syndrome. Takotsubo cardiomyopathy features ST segment elevation (or deep T wave inversions) without evidence of obstructive CAD. Positive serum markers for cardiac ischemia may be present, as well as hemodynamic compromise. It occurs principally in postmenopausal women and characteristically is triggered by intense emotional stress. Ballooning of the left ventricular apex is seen on ventriculography or echocardiography. Prognosis is excellent, typically with recovery of normal wall motion within a month or less.6,60
Non–ST Segment Elevation Myocardial Infarction
Pathophysiologically, total occlusion of the diseased artery may not have occurred, or the infarct zone may have been partially spared by collateral circulation or therapeutic intervention. ECG manifestations of NSTEMI include ST segment depression and T wave inversion, which may be deep and symmetrical. Absence of STEMI, however, does not necessarily translate to better outcomes. A study analyzing more than 250,000 AMI patients from the NRMI-2, NRMI-3, and NRMI-4 databases determined that patients with ST segment depression on the initial ECG have an in-hospital mortality rate of 15.8%—similar to that of patients with ST segment elevation or LBBB (15.5%).61 ST segment depression may herald true posterior infarction on the 12-lead ECG. Acute posterior (inferobasal) MI is one entity wherein emergent fibrinolysis or PCI is indicated in the absence of ST segment elevation on the 12-lead ECG.
Electrocardiographic Adjuncts in the Diagnosis of Acute Coronary Syndrome
Additional lead ECGs can increase sensitivity for AMI by evaluating regions of the heart prone to electrical silence on the 12-lead tracing. Most commonly, additional lead ECGs use posterior (leads V8 and V9) and right ventricular (V4R) electrodes, thus constituting the 15-lead ECG (Fig. 78-18). Posterior leads V8 and V9 are placed under the tip of the left scapula and at the left paraspinal area, at the same level as leads V4 to V6. Morphologic changes in the posterior leads may be subtle, principally because of the increased distance between these electrodes and the posterior wall of the heart (Fig. 78-19).

Use of the 15-lead ECG may improve diagnostic precision but does not appear to affect the rate of AMI diagnosis, use of reperfusion therapy, disposition, or outcome in patients with chest pain evaluated for ACS.62 In the subset of ED patients identified as candidates for admission to the cardiac care unit (i.e., high-risk patients), the 15-lead ECG increased the sensitivity of ACS detection by 12%.63 Possible applications for additional lead ECGs include the following: (1) ST segment changes (depression or elevation) in leads V1 to V3, either in an isolated lead or in more than one; (2) equivocal ST segment elevation in the inferior (II, III, aVF) or lateral (I, aVL) limb leads or both; (3) all inferior STEMI; and (4) hypotension in the setting of ACS. Additional lead applications can be used, including the 18- and 24-lead ECG; electrocardiographic body mapping with use of multiple ECG leads, such as the 80-lead ECG, can also be used. In general, the clinician is able to image larger segments of the heart with more electrocardiographic leads in use. It is suggested that these additional lead ECGs, including body mapping, can increase the rate of STEMI diagnosis and thus the number of patients who are candidates for emergent reperfusion therapy.
Serial ECGs and ST segment trend monitoring overcome the limitations of the snapshot 12-lead ECG. The use of increased electrocardiographic surveillance demonstrates diagnostic benefit in patients with recurrent or continuous chest pain, particularly in patients with an initially normal nondiagnostic or possible ST segment mimicking syndrome (e.g., ST segment elevation potentially resulting from BER) ECG. Examination of ST segment trends (measured every 20 seconds for at least the first hour) and automated serial ECGs (at least every 20 minutes) in ED patients with chest pain can significantly increase the sensitivity and specificity for detection of AMI (16%) and ACS compared with the initial ECG (Fig. 78-20).64 In more than 600 patients admitted with nondiagnostic initial ECGs and symptoms consistent with ACS, 12 hours of continuous 12-lead ECG monitoring in a coronary care unit setting revealed that only serum cardiac marker elevation and presence of ST segment episodes (defined as ST segment elevation or depression more than 1 mm different from baseline that endured for at least 1 minute) predict cardiac death or MI.65

Body surface mapping increases the amount of electrocardiographic data for processing and decision-making. Whereas serial ECGs and ST segment trend monitoring increase the period of time over which data are collected on a 12-lead ECG, body surface mapping increases the number of electrodes used to gather data and increases the vantage points from which the heart is evaluated. Various devices use 40 to 120 leads. With an 80-electrode device, 64 chest and 16 back electrodes are applied in a vestlike fashion with self-adhering strips. Recording from all electrodes simultaneously, the body surface map enters ST segment elevation and depression data into a computer, which transforms the data into a color-coded torso image. With red representing ST segment elevation, blue signifying ST segment depression, and green reflecting normal, the degree of disease is also expressed in terms of color intensity.66–68 Body surface mapping may increase sensitivity for MI, especially in areas that are relatively electrically silent on the 12-lead ECG (e.g., posterior and lateral walls of the left ventricle and the right ventricle) and in patients with underlying LBBB.66–68 In the Optimal Cardiovascular Diagnostic Evaluation Enabling Faster Treatment of Myocardial Infarction (OCCULT MI) trial, the 80-lead ECG provided an incremental 27.5% increase in STEMI detection as compared with the 12-lead ECG. Patients with 80-lead ECG-only STEMI had adverse outcomes similar to those encountered in the 12-lead STEMI patients, yet these individuals were treated much less aggressively.69
Limitations of Electrocardiography in Acute Coronary Syndrome
The sensitivity and specificity of a single ECG for AMI are approximately 60% and 90%, respectively. Serial ECGs in the setting of continued or recurrent pain increase the diagnostic utility.70 The initial ECG is nondiagnostic in approximately half of the patients in the ED who are ultimately diagnosed with AMI. Moreover, nondiagnostic and even normal ECGs do not exclude the diagnosis for AMI because around 20% of patients ultimately diagnosed with AMI have nondiagnostic ECGs earlier in their course. As time elapses from symptom onset to ECG recording, the ability of the ECG to exclude AMI does not markedly increase.41 Thus a single normal or nondiagnostic ECG does not ensure absence of ACS, even if the ECG was recorded well after the onset of symptoms. In patients being evaluated for ACS, only serial electrocardiography, combined with serial cardiac marker determinations, can exclude AMI, and even then UA without actual myocardial necrosis may be present.
Chest Radiography
There is radiographic evidence of pulmonary congestion in approximately one third of AMI patients. AMI patients who develop CHF have increased mortality, as reported by the Killip classification. The chronicity of the CHF syndrome may also be suggested by the heart size. Patients with AMI complicated by pulmonary edema who have a normal heart size most often have no past history of CHF. In fact, AMI is the most frequent cause of pulmonary edema with a normal cardiac size. In other instances, patients with AMI and cardiomegaly with or without pulmonary edema frequently have a preexisting history of CHF, anterior wall infarct, and multiple-vessel CAD (Fig. 78-21).

Serum Markers
Biochemical markers play a pivotal role in the diagnosis, risk stratification, and guidance of treatment. The European Society of Cardiology and the ACC define the criteria for AMI diagnosis on biochemical grounds because specific markers, particularly the troponins, indicate irreversible cell damage.11 In the past, detection of AMI by characteristic enzyme elevations over 48 to 72 hours was sufficient to establish the diagnosis of AMI because there was essentially no specific therapy to reverse or prevent the developing myocardial necrosis. The evolution of fibrinolytic therapy and acute mechanical intervention has created significant pressure to identify patients with AMI rapidly.
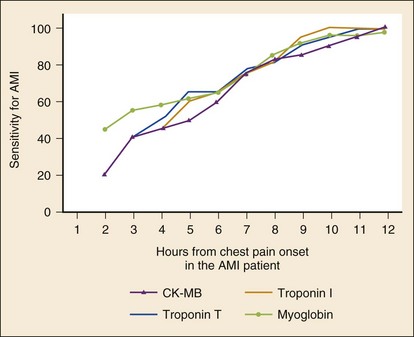
For patients with a nondiagnostic ECG, early elevation of serum markers of myocardial necrosis confirms a presumptive diagnosis of NSTEMI. Caution is advised, however, when a single serum marker is not elevated. This single test is too insensitive to be used to support a decision that the patient can be discharged or to determine that no acute coronary event has occurred. The patient’s history remains the most vital portion of the diagnostic evaluation of potential ACS. Serial testing substantially improves the sensitivity of these tests (Table 78-6 and Fig. 78-22).71
Table 78-6
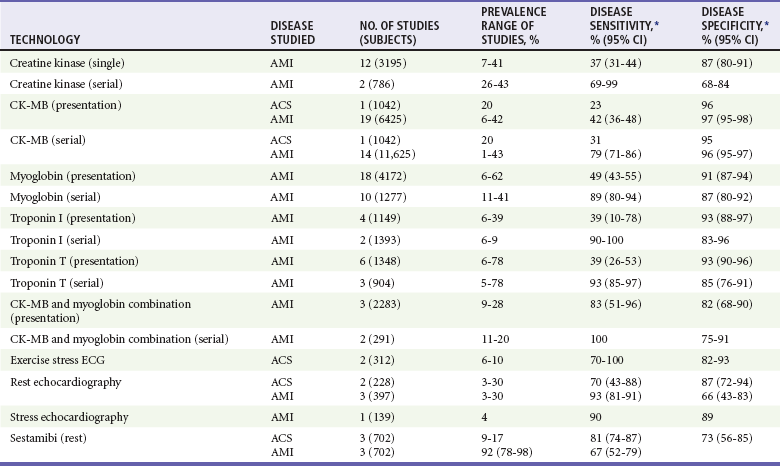
*Point estimate from a single study or a range of reported values; meta-analysis not performed.
Adapted from Pope JH, Selker HP: Diagnosis of acute cardiac ischemia. Emerg Med Clin North Am 21:217, 2003.
Troponins
The cardiac-specific troponins, determined serially, are highly sensitive for the early detection of myocardial injury. A positive test result is associated with significant risk, and serial negative results predict low risk. A single troponin measurement on presentation, however, has limited utility in excluding AMI and no ability to detect UA without infarction because cell injury is required and because of the time delay in the rise in levels (which may not be detected until 10 hours after symptom onset in some AMI patients).71 Serial measurements, particularly when performed at least 6 hours after symptom onset, markedly improve the sensitivity of the cardiac troponins for AMI, and the pattern of rise may assist in determining the acuity of the event. The sensitivity of TnT approaches 50% within 3 to 4 hours of the event. The test result is positive in about 75% of patients at 6 hours after onset of symptoms; at 12 hours, the test is almost 100% sensitive. More recent “highly sensitive troponin assays” produce positive results after AMI reliably within several hours. The newer assays, however, seem to have more false-positive results and are still limited in sensitivity because they do not detect UA.72
Data indicate that even very low levels of troponin elevations are associated with significant adverse clinical prognosis.73 In a number of studies, up to 33% of patients diagnosed with UA with normal CK-MB levels had elevated troponin levels, indicating the markers’ improved sensitivity for myocardial cell injury.74 The fact that the risk of these patients for cardiac events and mortality is similar to that of the patients diagnosed with AMI by traditional WHO criteria led to the redefinition of AMI on the basis of biochemical markers. On the basis of data from the TIMI-IIIB study, there is almost a linear correlation between increasing troponin levels and risk of cardiac events and mortality, even in patients with a nondiagnostic ECG and normal CK-MB levels.74,75 In a review of more than 7000 NSTEMI patients, troponin levels identified patients at low mortality risk. Small elevations of troponin may be used as an objective measure of “preinfarcts” that characterize UA and are associated with increased risk of infarction in the near term. Marked elevations in troponin consistent with AMI represent further progression along the continuum of ACS toward “traditional” AMI.
Cardiac troponins may also guide ACS treatment. Data from the Treat Angina with Aggrastat and Determine Cost of Therapy with an Invasive or Conservative Strategy—Thrombolysis in Myocardial Infarction (TACTICS–TIMI 18) trial suggest that patients with elevated troponin who are treated with an early invasive interventional strategy within 48 hours have a marked improvement in recurrent ischemia, infarction, and mortality, both in the short term and at 6 months. These studies include patients without major ECG criteria for immediate interventional reperfusion strategies.61 The use of glycoprotein IIb/IIIa inhibitors (GPIs) in patients with elevated troponins may prevent early complications in patients with ACS. It is likely that the improved sensitivity of troponin has captured a high-risk ACS population not previously diagnosed or treated. It is important to note that elevated troponin levels identify patients with UA or NSTEMI who stand to gain the greatest benefit from an early invasive strategy with coronary angiography and revascularization.73,76
Elevated troponin levels occur in a variety of cardiac and noncardiac conditions unrelated to the typical ACS and AMI pathophysiology. Cardiac conditions that can result in significant increased troponin levels in patients without evidence of ACS include myocarditis, pericarditis, CHF, LVH, and nonpenetrating cardiac trauma. Although the presence of elevated troponin levels in these conditions might be considered false-positive results, data support the contention that the source of these levels is underlying noninfarction myocyte injury that occurs with these conditions. Moreover, elevated troponin levels in many of these non-ACS cardiac conditions have prognostic significance.77
Troponin elevations can also be seen in noncardiac conditions, including PE, sepsis, and renal insufficiency. Troponin elevation may result from right ventricular dysfunction and myocyte injury in the case of submassive and massive PE and is a significant predictor of adverse outcome. Similar elevated troponin levels are reported in patients with sepsis and critically ill patients with multiple organ system failure.77
Elevated troponin levels are commonly seen in asymptomatic patients with end-stage renal disease. This finding may relate to the high prevalence of cardiac disease in this population rather than any reduced renal clearance, and may still represent evidence of subclinical myocardial damage.78 The TnT isoform is associated with elevated levels in renal failure more often than TnI, particularly in patients undergoing hemodialysis. Elevated troponin levels in the setting of renal failure are associated with increased risk of death and major cardiac and vascular morbidity and should not be ascribed to chronic renal failure unless old records are present to corroborate that the elevated troponin level is actually the patient’s normal baseline level.78
Creatinine Phosphokinase
Creatinine phosphokinase (CK) is found in large quantities not only in cardiac muscle but also in skeletal muscle, brain, kidney, lung, and the gastrointestinal tract. Myocardial cells are by far the most abundant potential sources of CK-MB; thus the appearance of CK-MB in the serum is highly suggestive of MI. The CK-MB fraction remains the best alternative to the troponins as a cardiac marker.79 In the setting of AMI, CK-MB is released and is detectable in the serum as early as 3 hours after onset of the necrosis. CK-MB characteristically peaks at 20 to 24 hours and becomes normal within 2 to 3 days after injury. Elevated CK-MB values identify a patient at considerable risk for a poor outcome but do not correlate well with infarct size. Unfortunately, skeletal muscle does contain small amounts of CK-MB, particularly the pelvic musculature. Abnormal CK-MB elevations may be seen in patients with trauma, muscular dystrophies, myositis, and rhabdomyolysis and after extremely vigorous exercise.
The sensitivity of a single CK-MB determination in diagnosing AMI is dependent on the elapsed time from chest pain onset. Values obtained within 3 hours of onset are poor diagnostic tools, with a sensitivity of only 25 to 50%. CK-MB determinations obtained beyond this 3-hour time period have increasing sensitivities for the diagnosis of AMI, ranging from 40% to nearly 100%, particularly when obtained 12 to 16 hours after onset.70 As a result, the use of single determinations of CK-MB is of little value in excluding ACS. Serial sampling, even over relatively short time periods (12 hours), increases sensitivity considerably, particularly when considered with serial electrocardiography and repeated assessments of the patient. Diagnostic utility is also improved by requiring that the CK-MB value not only be elevated but also be at least 5% of the total CK value. False-positive elevations can occur with noncoronary conditions, such as pericarditis, myocarditis, skeletal muscle disease, rhabdomyolysis, trauma, and exercise. In presentations in which dual biomarkers are obtained, the presence of nominal elevations in the CK-MB with simultaneous normal serum troponin value is of less clinical concern.
Myoglobin
The sensitivity of an initial myoglobin at presentation for AMI varies from as low as 21% to as high as 100%.70 Serial testing at 2 to 4 hours after presentation significantly improves the assay’s diagnostic power. A doubling of the level as soon as 1 to 2 hours after the initial measurement greatly increases the sensitivity for the diagnosis of AMI, but this approach is very nonspecific. The value of myoglobin may be in its excellent negative predictive power for AMI and its early rise kinetics compared with other markers. Although some evidence suggests that a normal myoglobin value 2 hours after presentation may be used safely to rule out active AMI but not ACS, myoglobin has largely fallen out of favor.
Other Cardiac Markers
Episodes of ischemia can result in biochemical changes before actual irreversible cell necrosis. Ischemic-modified albumin (so-called “cardiac albumin”) is a potentially useful ACS biomarker that reportedly detects early myocardial ischemia rather than the later myocyte necrosis, and may have even earlier elevation than myoglobin. Other potential ischemia markers include unbound free fatty acids and whole blood choline levels. Markers of hemodynamic status, including the natriuretic peptides, may also be useful in ACS. These markers, such as B-type natriuretic peptide (BNP) and NT-proBNP, are released from cardiac myocytes in response to increases in ventricular wall stress. BNP is most commonly used as a marker for CHF but is a useful adjunct to the standard cardiac markers and has good predictive power for recurrent ACS events and cardiac-related deaths, as well as CHF exacerbations, in patients with AMI.80,81 Moreover, the natriuretic peptides are excellent predictors of both short- and long-term mortality in patients with UA, NSTEMI, and STEMI.80,81
Given the underlying pathophysiology of ACS, a variety of biochemical markers for inflammation and plaque instability may prove useful in evaluating risk of a cardiac event. Chief among these are the inflammatory markers C-reactive protein (CRP) and high-sensitivity CRP (hsCRP), which have long-term prognostic value for cardiac events in healthy individuals as well as potential short-term prognostic value when combined with other markers for ACS. Other inflammatory markers include interleukin-6 and tumor necrosis factor alpha. Elevated plasma levels of myeloperoxidase, an abundant leukocyte enzyme found in vulnerable coronary plaques that have ruptured, predict short-term risk of adverse cardiac events even with negative cardiac troponin and no evidence of myocardial necrosis.82
Multiple Marker Strategies
Diagnostic, risk stratification, and prognostic accuracy might be enhanced by the use of multiple markers for AMI and ACS.83 The combination of CK-MB and myoglobin measurement has a sensitivity of 62 to 100% and specificity of 72 to 89% for AMI on presentation. Serial measurements of these markers significantly improve the performance of this combined marker approach. McCord reported on the usefulness of a multimarker strategy involving the early but non–cardiac-specific marker myoglobin with the more specific and prognostic marker TnI. In 817 patients evaluated for ACS in the ED, the combined marker approach had a sensitivity of 96.9% and negative predictive value of 99.6% for AMI when applied at presentation and at 90 minutes.84 Similarly, a three-marker approach (CK-MB, TnI, and myoglobin) in an accelerated critical pathway was reported to have 100% sensitivity and 100% negative predictive power for AMI in 1285 patients assessed for ACS.85 In a large series of ED chest pain patients with an initial nondiagnostic ECG, a 2-hour delta CK-MB combined with a 2-hour delta TnI had a sensitivity of 93% and specificity of 94% for AMI.86 Other multimarker strategies include combining measurement of a conventional marker for myocardial necrosis (troponin) with a marker for inflammation (CRP) and a hemodynamic marker (BNP). Many of these multimarker strategies, however, have low specificity. As a result, a positive multimarker test result requires confirmation with later-appearing, more definitive cardiac biomarkers.6 Thus the multimarker approach does not offer substantial benefit over the individual biomarker determinations and is therefore not recommended.
Echocardiography
Particularly in individuals with nondiagnostic ECGs, the presence of regional systolic wall motion abnormalities in a patient without known CAD is a moderately accurate indicator of acute myocardial ischemia or infarction, with a positive predictive accuracy of about 50%.6 The age of wall motion abnormalities, however, often cannot be determined without prior echocardiograms.
The absence of segmental abnormalities (presence of either normal wall motion or diffuse abnormalities) has a significant high negative predictive value, as high as 98% for cases of suspected MI.6 Moreover, segmental wall motion abnormalities can be seen not only in the zone of acute infarction but also in regions of ischemic stunning. Resting echocardiography provides an assessment of global and regional function, an important predictor of complications and mortality in patients with ACS. Data from the ACC/AHA task force indicate that patients with mild and localized as opposed to extensive wall motion abnormalities, have a low risk of ACS complications.6 In addition, echocardiography can help evaluate other causes of clinical presentations mimicking ACS, including valvular heart disease, aortic dissection, pericarditis, mitral valve prolapse, and pulmonary embolus. Finally, echocardiography is an important tool to assess for various complications of AMI, including acute mitral regurgitation, pericardial effusion, ventricular septal and free wall rupture, and intracardiac thrombus formation.
Technical limitations restrict the use of echocardiography in the ED. These limitations include the quality of the study and the expertise of the reader interpreting the study at the patient’s bedside. Injury involving more than 20% of the myocardial wall is required before segmental wall motion abnormalities can be detected echocardiographically.11 In addition, the inability of the two-dimensional echocardiogram to distinguish among ischemia, AMI, or old infarction and the potential absence of wall motion abnormality in nontransmural infarctions can further limit the usefulness of two-dimensional echocardiography.
Stress echocardiography, as opposed to resting echocardiography, can detect CAD as well as assess cardiac function early after an AMI. This can be performed with graded increases in cardiac workload, either by standardized exercise or pharmacologic adrenergic stimulating agents such as dobutamine. In addition, vasodilating agents, such as dipyridamole and adenosine, induce heterogeneous myocardial perfusion and reveal functional myocardial ischemia in susceptible patients. Stress echocardiography is superior to conventional treadmill testing for CAD in women. Graded dobutamine stress echocardiography assesses myocardial viability and ventricular function within the first few days after an AMI. Clinical studies of patients with nondiagnostic ECGs, negative markers, and negative rest echocardiography suggest a role for emergency pharmacologic stress echocardiography as a provocative test after a period of observation with at least two marker and ECG assessments in a chest pain or ED observation unit.87
Myocardial contrast echocardiography (MCE) uses microbubble ultrasonic contrast agents to assess microvascular perfusion and regional function with echocardiography. MCE evaluation of perfusion and regional function allows accurate risk stratification of ED patients with chest pain and nondiagnostic ECGs even before serum markers are available.88 Smaller studies report low rates of adverse cardiac events in chest pain patients with normal MCE findings after a nondiagnostic ECG and negative serum markers.89 The clinical value of MCE in the ED, like that of resting and stress echocardiography, remains uncertain.
Myocardial Scintigraphy
Radionuclide tracer injection and scintigraphy, such as with single-photon emission computed tomography (SPECT), allows real-time assessment of myocardial perfusion and function. Technetium-99 sestamibi has a slow redistribution to ischemic myocardium. This property allows immediate injection and imaging, which detects altered distribution consistent with some form of ischemic heart disease, followed by subsequent scanning, which provides more definitive data regarding the particular subtype of ACS. In patients with a normal initial study, the likelihood of ACS is extremely low. In patients with an initial study revealing abnormal distribution (i.e., reduced uptake) of the tracer, some form of ischemic heart disease is likely. Subsequent imaging then reveals one of two patterns: normal redistribution (normal uptake) or continued reduced uptake. The redistribution pattern is consistent with active coronary ischemia, and the continued reduced uptake is found in patients with MI, either remote or recent. Myocardial scintigraphy has promising positive and negative predictive values for cardiac events, with high sensitivity and a good specificity for CAD.90,91
Immediate myocardial scintigraphy is useful in detecting ACS and risk of cardiac events in patients in the ED with atypical chest pain, nondiagnostic ECGs, and low to moderate risk of AMI. Multiple studies find a relatively high incidence of cardiac events, presence of AMI, and need for revascularization in patients with a positive nuclear scan. The probability of a cardiac event is tenfold higher in patients with abnormal scans than in patients with a normal scan. The incidence of cardiac events with a normal scan is lower than 1% for the 30-day period after the index study.92 Myocardial scintigraphy can reduce the number of patients admitted from the ED with chest pain who are ultimately determined not to have ACS without reducing appropriate admissions for patients with ACS.93
Computed Tomography
CT imaging is a noninvasive imaging modality to assess for ACS. Electron beam computed tomography (EBCT) was introduced nearly two decades ago to screen for coronary calcium as a marker of underlying atherosclerotic heart disease and risk of ACS.94 Whereas calcium scoring systems exist to assess cardiovascular disease risk, few studies have examined the role of EBCT in the assessment of patients with acute chest pain.95 The few studies that have examined EBCT have demonstrated good sensitivity and excellent negative predictive value for subsequent cardiac events but have design limitations.
The use of MDCT in the ED focuses on two potential protocols: a coronary CTA by MDCT and a more global “triple rule-out” thoracic or chest MDCT. Noninvasive coronary CTA by MDCT performs well when compared with standard invasive coronary angiography.96,97 Cardiac CT provides excellent detection of calcified and noncalcified coronary artery plaque and stenosis, indicative of atherosclerosis and risk of ACS.94 CTA may be less useful, however, in a patient with preexisting CAD and extensive coronary calcifications or in those who have undergone prior interventions and have resulting imaging artifacts from coronary stents.97
The literature regarding the use of cardiac CT in patients with acute chest pain is limited. A study of 69 ED patients with chest pain and nondiagnostic ECGs noted that an ECG-gated 16-slice MDCT had a 96% negative predictive value when compared with the final diagnosis of CAD. Three patients were diagnosed by CT with other causes for their chest pain, including pneumonia and PE.98 A study of 64-slice MDCT coronary angiography in 92 ED patients at low risk for ACS reported a sensitivity of 86% and specificity of 92%, which are comparable with values for stress nuclear imaging.99 Another report on use of 64-slice MDCT in 103 patients admitted to the hospital for ACS with nondiagnostic ECGs and negative cardiac markers notes a 100% negative predictive power for CTA.100 The greatest benefit of MDCT appears to lie within its powerful negative predictive value, but this occurs at the expense of some false-positive findings that result in further testing, cost, and radiation exposure.101
Graded Exercise Testing
Exercise stress testing for ED patients is feasible. In more than 1000 patients with low-risk chest pain (5% incidence of CAD) who underwent exercise testing after negative serial markers and 9 hours of ECG monitoring in the ED,102 stress testing had a negative predictive value of 98.7% for the diagnosis of ACS or cardiac event within 30 days. An abbreviated ED-based “rule out MI” protocol followed by mandatory stress testing appears to be an effective diagnostic method for the detection of symptomatic CAD in low- to moderate-risk patients.
ACC/AHA guidelines on exercise testing state that such testing can be performed when patients are free of active ischemic or heart failure symptoms for a minimum of 8 to 12 hours.103 Immediate stress testing without the rule-out MI evaluation, however, may be safe and cost-effective in patients with chest pain felt possibly to be of cardiac origin but with low suspicion of ACS. For determination of the safety and value of immediate exercise testing in the ED, 1000 low-risk patients underwent immediate exercise testing with no adverse effects.104 Negative exercise test results were found in 640 patients (64%), all of whom were discharged home from the ED. The rate of CAD diagnosis or cardiac event within 30 days was 29% for the positive stress group, 13% for the nondiagnostic group, and 0.3% for the negative stress group. In total, 30-day follow-up was achieved in 888 (89%) patients and revealed no mortality in any of the three groups.
Graded exercise testing in the ED at most institutions is not available continuously. The mortality rate is extremely low (1 in 2500), but absolute contraindications include recent AMI (within 2 days), high-risk UA, uncontrolled cardiac dysrhythmias causing symptoms or hemodynamic compromise, symptomatic severe aortic stenosis, uncontrolled symptomatic heart failure, acute pulmonary embolus or infarction, acute myocarditis or pericarditis, and acute aortic dissection.103
Emergency Department–Based Chest Pain Centers
The CPC may also be used as an observation and evaluation unit where patients with chest pain and low to intermediate clinical likelihood of ACS can be monitored with electrocardiography, ST segment trending, serial 12-lead ECGs, and sequential serum markers. In addition, many CPCs now use further ACS evaluation with stress testing, echocardiography, or myocardial scintigraphy before disposition.105 Significant cost savings occur, with typical charges and actual costs ranging from 20 to 50% of the costs for the usual inpatient approach.
The Chest Pain Evaluation in the Emergency Room (CHEER) investigators in a prospective, randomized trial compared a CPC with the traditional hospital admission to rule out MI.106 Over a 16-month period, patients with chest pain at intermediate ACS risk on the basis of history, examination findings, and ECG were randomly assigned to either CPC or hospital admission. CPC patients underwent serial serum marker and ECG determinations over a minimum of 6 hours. If investigations were negative and the course uncomplicated, patients were evaluated with an exercise stress test, nuclear stress test, or stress echocardiography. If the results of this evaluation were positive, the patient was admitted; if negative, the patient was discharged with cardiology follow-up within 72 hours. In the CPC group, all events occurred in patients with a positive stress test result; no cardiac events occurred in the negative stress test group after ED discharge. Admissions were reduced by 45.8%.
Approximately 80% of patients with chest pain can be safely evaluated in the ED with ultimate discharge to home. The resources required for a successful CPC-based operation in which patients undergo rapid exclusion of ACS through serial testing, continuous monitoring, and immediate provocative stress testing are considerable. Although studies suggest that CPCs decrease the number of admissions, they may increase the number of patients seen in the ED for chest pain, and physicians may overuse the CPC accelerated diagnostic protocol approach in patients whom they would otherwise have discharged.107
[/level-membership-for-emergency-medicine-category][not-level-membership-for-emergency-medicine-category]Chapter 78
Acute Coronary Syndrome
Epidemiology
Ischemic heart disease and CAD continue to be the leading causes of death among adults in many developed countries. Ischemic heart disease accounts for nearly 1 million deaths in the United States annually, of which approximately 160,000 occur in persons 65 years of age or younger. More than half of all deaths from cardiovascular disease occur in women, and CAD remains a major cause of morbidity and mortality in women beyond their middle to late fifties. The incidence of cardiovascular disease is expected to continue to increase owing to lifestyle and behavioral changes that promote heart disease.1
A significant reduction in age-adjusted mortality from CAD has occurred in the United States over the past four decades.2,3 In large part, the decline has been accompanied by diminished mortality from AMI. This decrease is a result of a reduction in the incidence of AMI by 25% and a sharp drop in the case-fatality rate. Reduction in cigarette smoking, management of lipids, and improved management of hypertension and diabetes mellitus undoubtedly play a role, along with significant advances in medical treatment.
In 2005, 5.8 million patients were evaluated for chest pain or related complaints in EDs in the United States, constituting 5% of all ED visits. In 2004, 4.1 million visits to the ED had a primary diagnosis of cardiovascular disease, and over 1.5 million patients were hospitalized for a primary or secondary diagnosis of ACS.4–7 In addition, approximately 2% of patients with ACS are discharged from the ED. In the United States, approximately 900,000 persons every year experience an AMI, of whom 20% die before reaching the hospital, and 30% die within 30 days.8,9 The majority of fatalities from CAD occur outside the hospital, usually from an ACS-related dysrhythmia within 2 hours of onset of symptoms. For many patients who experience a nonfatal AMI, their lives are limited by an impaired functional status, anginal symptoms, and a diminished quality of life. The economic cost of ACS is estimated to be $100 to $120 billion annually.10
Spectrum of Disease
Acute Myocardial Infarction
Acute myocardial infarction is defined as myocardial cell death and necrosis of the myocardium. The four-decade-old World Health Organization (WHO) definition for AMI has been replaced by clinical criteria developed jointly by the European Society for Cardiology and American College of Cardiology (ACC) that focus on defining infarction as any evidence of myocardial necrosis. This definition for an acute, evolving, or recent MI requires a typical rise and fall of a cardiac biochemical marker, currently troponin, with clinical symptoms, ECG changes, or coronary artery abnormalities based on interventional evaluation.11 The actual definition,11 referred to as the “Universal Definition of Myocardial Infarction,” includes the following; either one of these criteria satisfies the diagnosis for an acute, evolving, or recent MI:
1. Typical rise and gradual fall or more rapid rise and fall of biochemical markers of myocardial necrosis with at least one value above the 99th percentile of the upper reference limit (URL) and with at least one of the following clinical parameters:
Furthermore, regarding an established MI, any one of the following criteria satisfies this diagnosis11:
• Development of new pathologic Q waves on serial ECGs. The patient may or may not remember previous symptoms. Biochemical markers of myocardial necrosis may have normalized, depending on the length of time since the infarct developed.
• Imaging evidence of a region of loss of viable myocardium that is thinned and fails to contract, in the absence of a nonischemic cause.
• Type 1—Spontaneous MI related to ischemia resulting from a primary coronary event, such as plaque erosion rupture, erosion, fissuring, or dissection with accompanying thrombus formation and vasospasm. Type 1 infarctions represent the “true” ACS event.
• Type 2—MI secondary to ischemia caused by either increased oxygen demand or decreased supply, as seen in coronary artery spasm, coronary embolism, severe anemia, compromising arrhythmias, or significant systemic hypotension.
• Type 3—Sudden unexpected cardiac death, including cardiac arrest, often with symptoms suggestive of myocardial ischemia, accompanied by presumably new ST segment elevation or new left bundle branch block (LBBB) pattern. Fresh coronary thrombus is noted via either angiography or autopsy; death occurs before appropriate sampling of the blood to detect the abnormal cardiac biomarker.
• Type 4—MI associated with coronary instrumentation, such as occurring after percutaneous coronary intervention (PCI). For PCIs in patients with normal baseline troponin values, elevations of cardiac biomarkers above the 99th percentile URL are indicative of periprocedural myocardial necrosis. By convention, increases of biomarkers greater than 3 times the 99th percentile URL are designated as defining PCI-related MI. A subtype related to a documented stent thrombosis is similarly recognized.
• Type 5—MI associated with coronary artery bypass grafting (CABG). For CABG in patients with normal baseline troponin values, elevations of cardiac biomarkers above the 99th percentile URL are indicative of periprocedural myocardial necrosis. By convention, increases of biomarkers greater than five times the 99th percentile URL plus any of the following are designated as defining CABG-related MI:
AMI is further classified by findings on the ECG at presentation, as either STEMI or NSTEMI. Previous descriptors, such as transmural and nontransmural, as well as Q wave and non–Q wave MI, fail to adequately describe the coronary event and its related pathophysiology, electrocardiographic presentation, and pathologic outcome. The differentiation between STEMI and NSTEMI has important implications in terms of management, outcome, and prognosis for patients with AMI. In fact, the ACC and the American Heart Association (AHA) have separate clinical guidelines for the management of patients with UA/NSTEMI and those patients with STEMI.6,7,12
Pathophysiology
The underlying pathophysiology of ACS is myocardial ischemia as a result of inadequate perfusion to meet myocardial oxygen demand. Myocardial oxygen consumption is determined by heart rate, afterload, contractility, and wall tension. Inadequate perfusion most commonly results from coronary arterial vessel stenosis as a result of atherosclerotic CAD. Usually the reduction of coronary blood flow does not cause ischemic symptoms at rest until the vessel stenosis exceeds 95%. Myocardial ischemia, however, may occur with exercise and increased myocardial oxygen consumption with as little as 60% vessel stenosis.13
CAD is characterized by thickening and obstruction of the coronary vessel arterial lumen by atherosclerotic plaques. Although atherosclerosis is usually diffuse and multifocal, individual plaques vary greatly in composition. Fibrous plaques are considered stable but can produce anginal symptoms with exercise and increased myocardial oxygen consumption because of the reduction in coronary artery blood flow through the fixed, stenotic lesions. Vulnerable or unstable fibrolipid plaques consist of a lipid-rich core separated from the arterial lumen by a fibromuscular cap. These lesions are likely to rupture, resulting in a cascade of inflammatory events, thrombus formation, and platelet aggregation that can cause acute obstruction of the arterial lumen and myocardial necrosis.14
In the setting of UA, acute stenosis of the vessel is noted; complete obstruction, however, is encountered in only 20% of cases. In these cases, it is likely that extensive collateral vessel circulation prevents total cessation of blood flow, averting frank infarction.13 With AMI, the occlusive fibrin-rich thrombus is fixed and persistent, resulting in myonecrosis of the cardiac tissue supplied by the affected artery. Angiographic studies demonstrate that the preceding coronary plaque lesion is often less than 50% stenotic, indicating that the most important factors in the infarction are the acute events of plaque rupture, platelet activation, and thrombus formation rather than the severity of the underlying coronary artery stenosis.
Clinical Features
Preadmission Evaluation
Appropriate pharmacotherapy for persistent anginal chest pain in the preadmission setting includes sublingual NTG, oral aspirin (acetylsalicylic acid [ASA]) that is preferably chewed, and intravenous morphine sulfate; the acronym MONA summarizes preadmission pharmacotherapeutic interventions (morphine, oxygen, nitroglycerin, and aspirin). Establishment of the diagnosis of ACS in this setting is difficult, however, as chest pain is a poor predictor of the diagnosis and adjunctive tools are limited.15 Preadmission 12-lead ECG offers high specificity (99%) and positive predictive value (93%) for AMI in patients with atraumatic chest pain while increasing the paramedic scene time by an average of only 3 minutes. This approach offers many advantages, including (1) earlier detection of STEMI, (2) ability to base the destination on the availability of PCI, and (3) more rapid reperfusion therapy.7 Preadmission 12-lead ECG would be necessary in the limited populations in whom preadmission fibrinolytic therapy might be applicable, such as those with prolonged out-of-hospital times (90-120 minutes).
Emergency Department Evaluation
Traditionally, a history of risk factors for CAD is sought; these include male gender, age, tobacco smoking, hypertension, diabetes mellitus, hyperlipidemia, family history, artificial or early menopause, and chronic cocaine abuse. Approximately 80% of a population of more than 122,000 patients with known CAD had at least one of the four conventional risk factors (diabetes mellitus, cigarette smoking, hypertension, or hyperlipidemia).16 Cardiac risk factor burden has little impact on the ED diagnosis of ACS; however, in patients older than 40 years, ACS is 22 times more likely if four of the five major risk factors (diabetes mellitus, smoking, hypertension, hyperlipidemia, and family history) are present (compared with none).17 Nevertheless, Bayesian analysis indicates that risk factors are a populational phenomenon and do not increase or decrease the likelihood of any condition in any one patient. Thus the presence of an individual risk factor or a collection of risk factors is far less important in diagnosing acute cardiac ischemia in the ED than the history of presenting illness, prior diagnosis of ischemic cardiac disease in the patient, the presence of ST segment or T wave changes, or cardiac marker abnormalities.18
Risk assessment tools, such as the PURSUIT (Platelet Glycoprotein IIb-IIIa in Unstable Angina: Receptor Suppression Using Integrilin Therapy) risk model, the GRACE (Global Registry of Acute Coronary Events) risk model, and the TIMI (Thrombolysis in Myocardial Infarction) risk score, can be used to determine risk of death and ischemia in NSTEMI and STEMI. The TIMI risk score assigns a point each for seven factors based on history, cardiac markers, and the ECG. It can be accessed at www.timi.org.6 Although these tools may aid in decision-making and in risk stratification for patients to properly determine their disposition (telemetry bed vs. intensive care unit), none of them are designed to identify patients who may safely be discharged home.
There are several nontraditional risk factors for coronary disease. Antiphospholipid syndrome, rheumatoid arthritis, human immunodeficiency virus (HIV),19 and particularly systemic lupus erythematosus (SLE) are associated with a higher risk of cardiovascular disease.20 Women with SLE who are 35 to 44 years of age are over more than 50 times more likely to have an MI than a similar age- and gender-matched Framingham population.21
The Classic History
The term angina refers to “tightening,” not pain. Classic angina pectoris may not be pain at all but rather a “discomfort,” with a “squeezing,” “pressure,” “tightness,” “fullness,” “heaviness,” or “burning” sensation. Classically, it is substernal or precordial in location and may radiate to the neck, jaw, shoulders, or arms. If the discomfort does extend down the arm, it classically involves the ulnar aspect. Discomfort in the left chest and radiation to left-sided structures is typical, but location and radiation to both sides or to only the right side may be consistent with angina. Radiation of the discomfort to the right arm or shoulder, or to both arms or shoulders, exceeds radiation to the left arm or shoulder in terms of likelihood of the chest pain being caused by ACS, although all exceed a positive likelihood ratio of 2.22,23
Furthermore, classic features of angina pectoris include exacerbation with exertion, a heavy meal, stress, or cold, and alleviation with rest. The onset of pain at rest in no way excludes the diagnosis of angina. Anginal discomfort characteristically lasts from 2 to 5 minutes up to 20 minutes, and it is rare for it to last only a few seconds or to endure for hours or incessantly, “all day” (Table 78-1).
Table 78-1
Clinical Characteristics of Classic Anginal Chest Discomfort
| CHARACTERISTIC | MORE LIKELY TO BE ANGINA | LESS LIKELY TO BE ANGINA |
| Type of pain | Dull, pressure | Sharp, stabbing |
| Duration | 2-5 min, often 15-20 min | Seconds or hours |
| Onset | Gradual | Rapid |
| Location | Substernal | Lateral chest wall, back |
| Reproducible | With exertion | With inspiration |
| Associated symptoms | Present | Absent |
| Palpation of chest wall | Not painful | Painful, exactly reproduces pain complaint |
Adapted from Zink BJ: Angina and unstable angina. In Gibler WB, Aufderheide TP (eds): Emergency Cardiac Care. St. Louis, Mosby, 1994.
Symptoms characteristically associated with angina pectoris, or other entities of ACS, include dyspnea, nausea, vomiting, diaphoresis, weakness, dizziness, excessive fatigue, or anxiety (Table 78-2). If these symptoms arise, either alone or in combination, as a presenting pattern of known ischemic coronary disease, they are termed anginal equivalent symptoms. Recognition that coronary ischemia may arise with an anginal equivalent rather than a classic symptom is the key to understanding the atypical presentation of ACS. Complaints of “gas,” “indigestion,” or “heartburn” in the absence of a known history of gastroesophageal reflux disease, or if the heartburn is different from the patient’s usual gastroesophageal reflux, or reproducible pain on abdominal palpation should raise suspicion of ACS. Gastroesophageal reflux disease is a common misdiagnosis in cases of missed ACS.
Table 78-2
Symptoms of Acute Myocardial Infarction: Typical and Atypical
*Patients able to report multiple symptoms; therefore total exceeds 777.
†Bayer AJ, et al: Changing presentation of myocardial infarction with increasing age. J Am Geriatr Soc 34:263, 1986.
‡Tinker GM: Clinical presentation of myocardial infarction in the elderly. Age Ageing 10:237-240, 1981.
§Uretsky BF, Farquhar DS, Berezin AF, et al: Symptomatic myocardial infarction without chest pain: Prevalence and clinical course. Am J Cardiol 40:498-503, 1977.
||Pathy MS: Clinical presentation of myocardial infarction in the elderly. Br Heart J 29:190-198, 1967.
¶Patients classified by principal symptom, although all patients with complaint of chest or epigastric discomfort were placed in typical group.
**Same as ¶, except patients with epigastric complaints were placed in atypical group.
Adapted from Scott PA, Gibler WB, Dronen SC: Acute myocardial infarction presenting as flank pain and tenderness: Report of a case. Am J Emerg Med 9:547, 1991.
The Atypical History
A description of typical symptoms (crushing, retrosternal chest pain or pressure) is often lacking in ACS; this may be a result of atypical features of the pain (e.g., character, location, duration, exacerbating and alleviating factors) or the presence of anginal equivalent symptoms (e.g., dyspnea, nausea, vomiting, diaphoresis, indigestion, syncope). Patients with an ultimate diagnosis of AMI or UA can have pain that is pleuritic, positional, or reproduced by palpation. Some patients describe their pain as burning or indigestion, sharp, or stabbing (see Table 78-2).23,24
In a large study of nearly 435,000 patients ultimately diagnosed with AMI, one third did not have chest pain on presentation.25 Multiple studies have identified risk factors for atypical presentation of ACS: diabetes mellitus, older age, female gender, nonwhite ethnicity, dementia, no prior history of MI or hypercholesterolemia, no family history of coronary disease, and previous history of congestive heart failure (CHF) or stroke.25–27 In patients with AMI or UA, atypical presenting complaints include dyspnea, nausea, diaphoresis, syncope, or pain in the arms, epigastrium, shoulder, or neck.
Atypical features of ACS are present with increasing frequency in sequentially older populations. Before age 85, chest pain is found in the majority of patients with acute MI, although dyspnea, stroke, weakness, and altered mental status are notably present. In those older than 85 years, however, atypical symptoms are more common than chest pain, with 60 to 70% of patients older than 85 having an anginal equivalent complaint, especially dyspnea.27 Coincident ACS is more likely to occur in the elderly; patients with another acute condition (e.g., trauma, infection) should be scrutinized for concurrent ACS.28
Patients with diabetes mellitus are at heightened risk for ACS as well as an atypical presentation, such as dyspnea, nausea or vomiting, confusion, or fatigue. Medically unrecognized AMI can occur in 40% of patients with diabetes mellitus compared with 25% of a nondiabetic population, and myocardial scar unaccompanied by antemortem diagnosis of MI is three times more likely in diabetics.29
As with age and diabetes, female gender is an important risk factor for MI without chest pain. In some series, less than 60% of women reported chest discomfort at the time of their MI, with others reporting dyspnea, indigestion, or vague symptoms, such as weakness, unusual fatigue, cold sweats, sleep disturbance, anxiety, or dizziness.30
Finally, nonwhite racial and ethnic populations may have atypical symptoms in ACS.25 Compelling data demonstrate a disparity in treatment approach related to race in patients with acute manifestations of coronary heart disease.31 Whether this is related to the atypical nature of presenting symptoms in different racial groups is not clear. Although certain features of the chest pain history serve to increase or decrease the likelihood of ACS, none of them is strong enough to endorse discharge of the patient based on the history alone.24
Physical Examination
The physical examination focuses on the cardiac, pulmonary, abdominal, and neurologic examinations, looking for signs of complications of ACS as well as alternative diagnoses for chest pain and the anginal equivalent syndromes (Table 78-3). Altered mental status, diaphoresis, and signs of CHF are all ominous findings in patients with symptoms consistent with ACS. Historical studies using untrained physicians identified chest wall tenderness or “reproducible” chest wall tenderness in up to 15% of patients ultimately diagnosed with AMI, but these data are highly suspect. The real incidence of truly reproducible chest wall tenderness (i.e., when the patient reliably identifies to the examiner that the pain produced on palpation is identical to the pain causing the patient’s presentation) in ACS is probably very small. It is suggested that patients with chest pain that is fully pleuritic, positional, or reproducible by palpation (the three Ps) are at low risk (yet not no risk) for ACS.22
Table 78-3
Key Entities in the Differential Diagnosis of Chest Pain
| Acute myocardial infarction | Unstable angina |
| Stable angina | Prinzmetal’s angina |
| Pericarditis | Myocardial or pulmonary contusion |
| Pneumonia | Pulmonary embolism |
| Pneumothorax | Pulmonary hypertension |
| Pleurisy | Aortic dissection |
| Boerhaave’s syndrome | Gastroesophageal reflux |
| Peptic ulcer disease | Gastritis or esophagitis |
| Esophageal spasm | Mallory-Weiss syndrome |
| Cholecystitis or biliary colic | Pancreatitis |
| Herpes zoster | Musculoskeletal pain |
Outcomes in Atypical Presentations
Not surprisingly, atypical presentation of patients with ACS is associated with a delay in diagnosis and poorer outcomes. In the Second National Registry of Myocardial Infarction (NRMI-2) study, patients with MI without chest pain were significantly more likely to die in the hospital (23 vs. 9% for patients with chest pain) and were more likely to experience stroke, hypotension, or heart failure that required intervention, possibly reflecting the older age and greater comorbidity in this group.25 Patients with atypical symptomatology seek medical care later and are less likely to receive standard therapies, such as aspirin, beta-adrenergic blockers, heparin, fibrinolysis, and emergent reperfusion therapy.25 Patients 65 years of age or younger with NSTEMI have a 1% chance of dying during their hospitalization, but this risk is increased to 10% for patients ages 85 years and older.28
Missed Diagnosis of Acute Coronary Syndrome
Approximately 2% to 4% of patients with acute MI in the ED are discharged without diagnosis.32 Missed ACS is the misdiagnosis that accounts for the largest amount of payment by emergency physicians in medical malpractice claims. Atypical presenting symptoms are an obvious causative consideration. Patients with undiagnosed ACS discharged from the ED are younger, more likely to be women or nonwhite, more likely to have atypical complaints, and less likely to have ECG evidence of acute ischemia.32,33 Among all patients with cardiac ischemia, women younger than 55 years seem to be at highest risk for inappropriate discharge. With respect to ECG findings, 53% of patients with missed AMI and 62% of patients with missed UA have normal or nondiagnostic ECGs. Finally, the risk-adjusted mortality ratio for all patients with acute cardiac ischemia is 1.9 times higher among nonhospitalized patients.32 Factors associated with misdiagnosis of ACS in medical malpractice closed claims analysis include physicians with less experience who document histories less clearly, admit fewer patients, and misinterpret the ECG.
Early Complications of Acute Myocardial Infarction
Bradydysrhythmia and atrioventricular (AV) conduction block occur in 25 to 30% of patients with AMI; sinus bradycardia is most commonly seen.34–36 Symptomatic bradydysrhythmias in the first few hours after inferior AMI tend to be atropine responsive; conduction abnormalities that appear beyond 24 hours of MI tend not to respond to atropine.37 Patients with AV block in the setting of anterior AMI tend to respond poorly to therapy and have a poor prognosis.
Stroke may also complicate AMI, most commonly ischemic or thromboembolic. The major predisposing mechanisms with a recent MI are embolization from left ventricular mural thrombus with decreased ejection fraction, embolization from the left atrial appendage with atrial fibrillation, and hypercoagulability with concomitant carotid arterial disease. The rate of stroke is higher in the setting of MI (0.9% tapering to 0.1% at day 28 after MI) than in control subjects (0.014%).38
Hemorrhagic stroke is an obvious concern in the patient undergoing fibrinolytic therapy. The rate of hemorrhagic stroke with varying fibrinolytic agents is less than 1%, although the rate climbs in older patients. PCI lowers the overall risk of stroke compared with fibrinolytic therapy. Analysis of only fibrinolytic-eligible patients from the NRMI-2 database yields more than 24,000 patients treated with alteplase and more than 4000 who received primary angioplasty. The difference in stroke rate is highly significant (1.6% in the fibrinolytic group vs. 0.7% in the angioplasty group). Considering hemorrhagic strokes, the difference is again dramatic (1.0% in the fibrinolytic group vs. 0.1% in the angioplasty group).39
Hyperglycemia in the setting of AMI may be viewed as a complication, as well as a complicating disease process in AMI. Hyperglycemia is present in up to one half of all patients with STEMI, yet only one fifth to one fourth of those patients are recognized diabetics. Elevated glucose at the time of admission has independent negative implications for mortality rates in AMI patients. Although fasting blood sugar the day after presentation is a better predictor, an admission blood glucose level higher than 200 mg/dL is linked to similar mortality rates among diabetics and nondiabetics. There is a 4% mortality increase for nondiabetic patients for every 18-mg/dL elevation in blood glucose level. Hyperglycemia seems to induce a complex set of unfavorable cellular and biochemical circumstances, including negative effects on coronary flow and microvascular perfusion, as well as adverse effects on platelet function, fibrinolysis, and coagulation. Intravenous insulin therapy for glucose normalization is linked to improved outcomes in patients with STEMI as well as those in the medical intensive care unit. ACC/AHA guidelines acknowledge that tight control of blood glucose during and after STEMI decreases acute and 1-year mortality rates.40
[/not-level-membership-for-emergency-medicine-category]
