Acid-Base Balance and Blood Gas Interpretation
A An electrolyte is a substance that is capable of conducting an electrical current when placed into solution.
B When an electrolyte dissolves in solution, it dissociates, producing ions. For example, sodium chloride (NaCl) dissociates into sodium (Na+) and chloride (Cl−) ions.
< ?xml:namespace prefix = "mml" />
C Strong electrolytes dissociate completely when dissolved in solution.
D Weak electrolytes only partially dissociate, with the majority of electrolytes remaining dissolved but undissociated.
A The basic chemical and mathematical relationships involved in blood gas interpretation are based on the law of mass action (also referred to as the law of electrolyte dissociation or the law of chemical equilibrium).
B The law of mass action states that when a weak electrolyte is placed into solution, only a small percentage of it dissociates, and the majority remains undissociated. Determining the product of the molar concentrations of the dissociated species and dividing that by the molar concentration of the undissociated weak electrolyte yields a dissociation constant for that weak electrolyte. This constant is true for the particular electrolyte at the temperature at which it was originally determined.
C If the weak acid HA is placed into solution, it will reversibly dissociate to H+ and A− (the negative ion formed wheneveH+ dissociates from an acid):
 H+ + A− (2)
D If 0.01 mol/L of HA were added to solution and 5% of HA dissociated, the following quantities of all three species would exist in solution:
Note: One H+ and one A− are formed as every HA molecule dissociates.
E According to the law of mass action:
 (3)
(3)where K = the dissociation constant.
F Inserting the molar concentrations of the individual species and calculating the dissociation constant yields the following:

G As explained in sections II and IV, the dissociation constant indicates the pH at which a buffer functions most efficiently.
H The law of mass action applied to water is the basis for the pH scale.
1. Water (H2O) dissociates into H+ plus OH−:
 (4)
(4)2. The molar concentration of H+ and OH− is 10−7 mol/L.
3. Because the concentration of the undissociated water is so large compared with the [H+] and [OH−], it is considered a constant:
 (5)
(5)4. This relationship is frequently written as:
where Kw = the dissociation constant for H2O.
6. Thus a neutral solution is one with 10−7 moles of H+ per liter.
7. Because the H+ concentration can vary from 10−1 to 10−14 in this relationship, the limits of the pH scale are defined.
8. Therefore the pH scale goes from a pH of 1.0 ([H+] = 10−1 mol/L) to a pH of 14.0 ([H+] = 10−14 mol/L).
9. Remember the product of [H+] and [OH−] must equal 10−14. As a result, as the [H+] increases, the [OH−] decreases and vice versa.
I The law of mass action when applied to carbonic acid (H2CO3) dissolved in plasma at 37° C yields the following:
1. Carbonic acid (H2CO3) dissociates into H+ + HCO3− (bicarbonate ion):
2. If the molar concentration of H+ is multiplied by the molar concentration of HCO3−, and the answer is divided by the molar concentration of H2CO3, the dissociation constant for H2CO3 in plasma is calculated:
J The mathematical manipulation of the law of mass action results in the development of the Henderson-Hasselbalch equation, which is the basis for blood gas analysis.
III Henderson-Hasselbalch Equation (Standard Buffer Equation)
A Derivation of the Henderson-Hasselbalch equation from equation 9:
1. Rearranging equation 9 and solving for [H+] results in the following:
 (10)
(10)2. Taking the log to the base of 10 of each side of equation 10 yields the following:
 (11)
(11)3. Multiplying each side of equation 11 by −1 yields the following:
 (12)
(12)4. Rearranging  in equation 12 yields the following:
 (13)
(13)5. Inserting equation 13 in equation 12 yields the following:
 (14)
(14)6. −log H+ = pH and −log K is termed the pK (refer to section IV). Equation 14 is rewritten as:
 (15)
(15)7. Equation 15 is the classic buffer equation (see section V) as applied to the [HCO3−]/[H2CO3] buffer system.
8. A universal representation of the classic buffer equation as applied to a weak acid electrolyte is:
 (16)
(16)where pKa is the pK of a weak acid electrolyte.
9. If the derivation were carried out for a weak basic electrolyte, the standard equation would be:
 (17)
(17)10. However, the types of buffer systems used in describing pulmonary physiology are all weak acid electrolytes.
IV pK (−Log of the Dissociation Constant)
A This value represents the pH at which a buffer functions most efficiently.
B When the pH of a solution equals the pK, 50% of the buffer exists in the form of the conjugate base, and 50% exists as the undissociated acid.
C All buffers have a narrow pH range, identifying where they function most appropriately.
D If the pH of a solution is above its pK, the solution generally will buffer acid more effectively than base.
E If the pH of a solution is below its pK, the solution will buffer base more effectively than acid.
F The farther away a solution’s pH moves from its pK, the poorer its buffering capabilities.
G If the pH of a buffered solution is outside the 1- to 1.5-pH range about the buffer’s pK, the system’s buffering capabilities are lost.
A A buffer is a weak acidic or basic electrolyte that has the capability of determining the pH of a solution.
B Buffers are used to prevent significant changes in a solution pH.
C One should always choose a buffer whose pK is numerically near the pH of the solution to be buffered.
D Chemical functioning of buffers:
1. If the buffer HA from section II is titrated into solution until the pH of the solution is equal to the pK of the buffer, an ideally buffered solution is established. The pK of this system is 4.58 (−log of 2.63 × 10⁻⁵, see section II-F).
2. After titration, the final concentrations of HA and A− are equal to 0.01. Thus the classic buffer equation would be
 (18)
(18)
Note: The log of 0.01/0.01 is 0.
3. If acid is added to this buffer, it reacts with the conjugate base (A−) and forms more undissociated acid (HA):
This should result in only a minimal change in the pH.
a. If 0.001 mol/L of H+ were added to the buffer, the H+ would react with 0.001 mol/L of A−:
 (20)
(20)Note: 100% efficiency is assumed.
b. As a result, the concentration of A− would decrease by 0.001, and the concentration of HA would increase by 0.001:
c. The resulting pH of this solution would be 4.49, or a 0.09-pH unit change.
d. By comparison, if 0.001 mol/L of H+ were added to water with a pH of 7.0, the resulting pH would be approximately 2.99, more than a 4.0-pH unit change.
4. If base is added to a buffer, it reacts with free H+, allowing more HA to dissociate:
resulting in a minimal change in the pH.
a. If 0.001 mol/L of OH− were added to the buffer in equation 18, the OH− would react with 0.001 mol/L of H+, causing 0.001 mol/L of A− to be formed:

b. As a result, the concentration of HA decreases by 0.001, and the concentration of A− increases by 0.001.
c. The resulting pH of the solution would be 4.67, a 0.09-pH unit change.
d. By comparison, if 0.001 mol/L of OH− were added to water with a pH of 7.0, the resulting pH would be approximately 10.99, almost a 4.0-pH unit change.
VI The HCO3−/H2CO3 Buffer System
A The most important buffer system in the body is the HCO3−/H2CO3 system:
 (23)
(23)B The pK of this system is 6.1 (K = 7.85 × 10⁻⁷).
C Arterial [HCO3−] is approximately 24 mEq/L.
D Arterial [H2CO3] is approximately 1.2 mEq/L.
E Thus arterial pH is approximately 7.4:
F The ratio of HCO3− to H2CO3 is 20:1:
G If this ratio increases (30:1), the arterial pH increases.
H If this ratio decreases (10:1), the arterial pH decreases.
I Clinically HCO3− and H2CO3 concentrations are extremely time consuming and costly to determine.
1. Because (PCO2) × (0.0301) is equivalent to the H2CO3 concentration, this value can be substituted into equation 23 for H2CO3:
 (24)
(24)2. Clinically the pH of the blood is easily measured, as is the Pco2.
3. [HCO3−] is always the calculated value when blood gas results are reported.
J In this buffer system [HCO3−] is regulated and controlled by the kidney, and Pco2 is regulated and controlled by the lung with the pH a result of [HCO3−] and Pco2.
K The HCO3−/H2CO3 buffer system in blood is a poor chemical buffer.
1. This is true because of the pK (6.1) of the buffer in relation to the pH (7.4) of the arterial blood.
2. The pH of blood is outside the chemical buffering range of the HCO3−/H2CO3 system.
3. However, this system is considered an essential physiologic buffer (i.e., the lungs can control the excretion or retention of large quantities of acid in the form of CO2).
4. The following reversible reaction illustrates the relationship:
 (25)
(25)5. If there is an increase in H+, the reaction is shifted to the left, increasing plasma CO2 levels, which are exhaled.
6. If there is a decrease in H+, the reaction is shifted to the right, decreasing plasma CO2 levels.
7. The effectiveness of HCO3− administration in the face of metabolic acidosis is based on equation 25 shifting to the left, allowing acid to be exhaled as CO2. If ventilation cannot eliminate the increased CO2 produced, the acidosis changes from metabolic to respiratory.
VII Actual Versus Standard HCO3−
A Actual HCO3−: Value calculated from actual, measured Pco2 and pH of arterial blood.
B Standard HCO3−: Value calculated from measured pH and Pco2 of venous blood after Pco2 of blood has been equilibrated to 40 mm Hg.
1. Value usually reported with electrolyte studies by the clinical laboratory.
2. Indicative of a change in acid-base balance but not as precise when compared with arterial pH and Pco2.
C Arterial pH and Pco2 most closely correlate with actual HCO3−.
A The total buffering capacity of the body can be broken down approximately as follows (Box 15-1):
1. Sixty percent by the HCO3−/H2CO3 system
2. Thirty percent by hemoglobin buffering system
3. Ten percent by all other blood buffers (e.g., phosphates, plasma proteins, and ammonia)
B Of the total body buffers, HCO3− and all proteins (including hemoglobin) are the most important.
C These two systems may be chemically depicted as follows:
 (26)
(26) (27)
(27)D If a respiratory acidosis were to develop, the reaction shown in equation 26 would be driven to the right, causing an equal shift of the reaction shown in equation 27 to the left. As a result, the total amount of base in the body would remain unchanged.
E If a respiratory alkalosis were to develop, the reaction shown in equation 26 would be driven to the left, causing an equal shift of the reaction shown in equation 27 to the right. As a result, the total amount of base in the body would remain unchanged.
F The sum of [HCO3−] + [Prot−] is the buffer base (BB), which (as demonstrated in sections VIII-D and VIII-E) remains unchanged in all pure acute respiratory acid-base disturbances.
G However, if metabolic acid is added to the body, the reactions shown in equations 26 and 27 would be driven to the left, and the quantity of BB would decrease; if metabolic base were added to the body, both reactions (26 and 27) would be driven to the right, and the quantity of BB would increase.
H Base excess/base deficit (BE/BD) is defined as the actual BB minus the normal BB:
I In all pure acute respiratory acid-base disturbances, the BE/BD is normal. However, once compensation occurs, the BE/BD becomes positive or negative.
J All metabolic acid-base disturbances are accompanied by a change in the BE/BD.
K The BE/BD is the most reliable index of metabolic acid-base disorders.
L The normal BE/BD is zero, with a range of ±2 mEq/L. The normal total BB is 54 mEq/L.
IX Normal Ranges for Blood Gases
A Absolute normals: Arterial blood (mean population values):
B Normal ranges: Arterial blood (±2 SDs from the population mean):
X Mathematical Interrelationships Between pH, Pco2, and HCO3−
A If the constants and log relationship are eliminated in the HCO3−/H2CO3 buffer equation, the equation may be simplified to:
 (29)
(29)This demonstrates the mathematical interrelationship between these variables.
B Under all clinical circumstances the pH generally will be a result of the HCO3− and Pco2 levels.
C In a pure respiratory abnormality where the HCO3− remains essentially constant, the Pco2 and pH are indirectly related:
 (30)
(30)D In a pure metabolic abnormality where the Pco2 remains essentially constant, the HCO3− and pH are directly related:
 (31)
(31)E These interrelationships provide the basis for blood gas interpretation.
XI Compensation for Primary Acid-Base Abnormalities
A Compensation involves the various mechanisms used by the body to normalize the pH after a primary acid-base abnormality. Compensation does not imply correction of the primary abnormalities.
B Compensation for primary respiratory acid-base imbalances is via the kidney (see Chapter 13).
C Compensation for primary metabolic acid-base abnormalities is via the respiratory system (see Chapter 6).
XII Estimation of pH Changes Based Purely on Pco2 Changes
A Because the pK of the HCO3−/H2CO3 system is 6.10 and the quantity of HCO3− is 20 times greater than the quantity of H2CO3, the body buffers acid more efficiently than base.
B If starting at a baseline pH of 7.40 and a Pco2 of 40 mm Hg, for every 10-mm Hg Pco2 increase there is an approximate 0.05-pH unit decrease:
C If starting at a baseline pH of 7.40 and a Pco2 of 40, for every 10-mm Hg Pco2 decrease there is an approximate 0.10-pH unit increase:
XIII Interpretation of Arterial Blood Gases
XIV Interpretation of Acid-Base Status
A Table 15-1 lists ranges for interpretation of blood gases.
TABLE 15-1
| Status | pH | PCO2 | HCO3− | Base Excess |
| Respiratory acidosis | ||||
| Uncompensated | ↓ 7.35 | ↑ 45 | Normal | Normal |
| Partially compensated | ↓ 7.35 | ↑ 45 | ↑ 27 | ↑ +2 |
| Compensated | 7.35-7.45 | ↑ 45 | ↑ 27 | ↑ +2 |
| Respiratory alkalosis | ||||
| Uncompensated | ↑ 7.45 | ↓ 35 | Normal | Normal |
| Partially compensated | ↑ 7.45 | ↓ 35 | ↓ 22 | ↓ − 2 |
| Compensated | 7.40-7.45 | ↓ 35 | ↓ 22 | ↓ − 2 |
| Metabolic acidosis | ||||
| Uncompensated | ↓ 7.35 | Normal | ↓ 22 | ↓ − 2 |
| Partially compensated | ↓ 7.35 | ↓ 35 | ↓ 22 | ↓ − 2 |
| Compensated | 7.35-7.40 | ↓ 35 | ↓ 22 | ↓ − 2 |
| Metabolic alkalosis | ||||
| Uncompensated | ↑ 7.45 | Normal | ↑ 27 | ↑ +2 |
| Partially compensated* | ↑ 7.45 | ↑ 45 | ↑ 27 | ↑ +2 |
| Compensated* | 7.40-7.45 | ↑ 45 | ↑ 27 | ↑ +2 |
| Combined respiratory and metabolic acidosis | ↓ 7.35 | ↑ 45 | ↓ 22 | ↓ − 2 |
| Combined respiratory and metabolic alkalosis | ↑ 7.45 | ↓ 35 | ↑ 27 | ↑ − 2 |
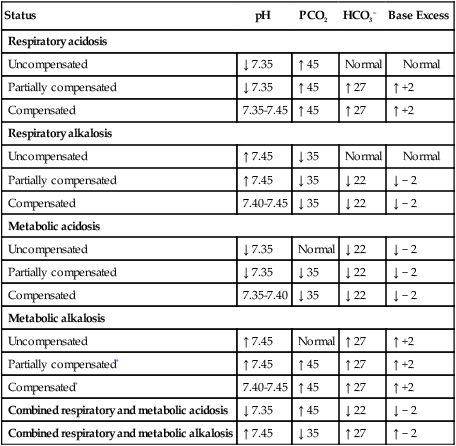
*Partially compensated or compensated metabolic alkalosis generally is rarely seen clinically because of the body’s mechanism to prevent hypoventilation.
B The terminology used is uncompensated, partially compensated, and compensated.
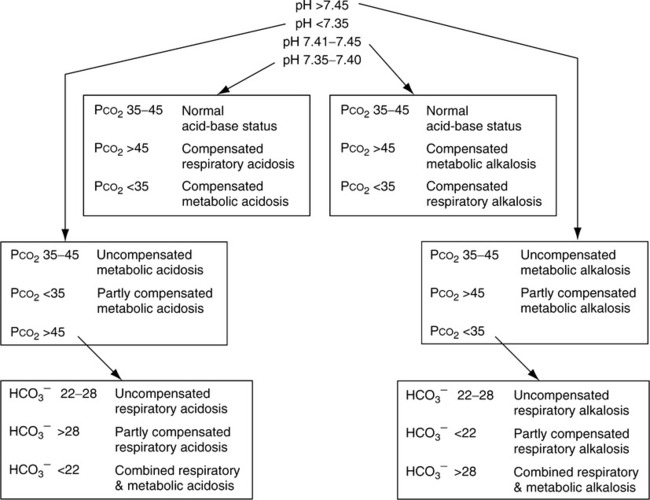
C Approach to blood gas interpretation (see Table 15-1)
1. Determine whether the pH is within the normal range
a. If normal, the blood gas is normal or compensated.
b. If it is outside the normal range, it is uncompensated or partially compensated.
2. Determine whether the Pco2 is normal or abnormal
(1) The pH is normal; then the blood gas is normal.
(2) The pH is decreased; then an uncompensated metabolic acidosis exists.
(3) The pH is increased; then an uncompensated metabolic alkalosis exists.
b. If the Pco2 is higher than normal and:
(1) The pH is decreased and the HCO3− is normal; then an uncompensated respiratory acidosis exists.
(2) The pH is decreased and the HCO3− is above normal; then a partially compensated respiratory acidosis exists.
(3) The pH is between 7.35 and 7.40 and the HCO3− is elevated; then it is a compensated respiratory acidosis.
(4) The pH is 7.40 to 7.45 and the HCO3− is elevated; then it may be a compensated metabolic alkalosis; however, this acid-base state is rare, and usually a compensated respiratory acidosis with a mild metabolic alkalosis exists.
(5) The pH is increased with an elevated HCO3−; then a partially compensated metabolic alkalosis exists.
c. If the Pco2 is lower than normal and:
(1) The pH is increased and the HCO3− is normal; then an uncompensated respiratory alkalosis exists.
(2) The pH is between 7.35 and 7.40 and the HCO3− is decreased; then a compensated metabolic acidosis exists.
(3) The pH is between 7.40 and 7.45 and the HCO3− is decreased; then a compensated respiratory alkalosis exists.
(4) The pH is increased and the HCO3− is decreased; then a partially compensated respiratory alkalosis exists.
(5) The pH is decreased and the HCO3− is decreased; then a partially compensated metabolic acidosis exists.
d. Combined respiratory and metabolic acidosis or combined respiratory and metabolic alkalosis also can occur.
(1) If the pH is markedly decreased, the Pco2 is increased, and the HCO3− is decreased, then an uncompensated respiratory and metabolic acidosis exists.
(2) If the pH is markedly increased, the Pco2 is decreased, and the HCO3− is increased, then an uncompensated respiratory and metabolic alkalosis exists.
e. Figure 15-1 lists an algorithm for the interpretation of arterial blood gases.
XV Assessment of Level of Hypoxemia
A For patients who are breathing room air and who are <60 years of age:
B For individuals <60 years of age, 1 mm Hg should be subtracted from the lower limits of mild and moderate hypoxemia for each year <60. At any age a Po2 <40 mm Hg indicates severe hypoxemia, and a Po2 <60 to 65 is always considered hypoxemic.
C More precisely acceptable lower limits for Po2 can be determined by the following (at sea level):
XVI Assessment of Tissue Hypoxia
A At present there is no direct method to assess tissue hypoxia; it must be clinically assessed indirectly.
B Normally adequate tissue oxygenation requires:
1. Normal volume of oxygen must be carried by arterial blood.
C The likelihood of tissue hypoxia existing is increased in the presence of the following:
D If tissue hypoxia has occurred, blood lactate levels are increased.
XVII Acute Respiratory Failure
A A term used to define a circumstance where acute respiratory acidosis is associated with acute hypoxemia.
XVIII Acute Ventilatory Failure
A A term used to define a circumstance where acute respiratory acidosis is not associated with acute hypoxemia.
XIX Clinical Causes of Acid-Base Abnormalities
A Respiratory acidosis primary causes:
1. Cardiopulmonary disease, particularly end-stage chronic obstructive pulmonary disease (COPD) or chronic restrictive pulmonary disease.
2. Central nervous system depression by drugs, trauma, or lesion.
3. Obesity: Hyperventilation syndrome.
4. Neurologic or neuromuscular disease resulting in profound weakness of ventilatory muscles.
B Respiratory alkalosis: Primary causes:
1. Hypoxemia: Its primary effect on the respiratory system is hyperventilation.
2. Compensation for primary metabolic acidosis.
3. Central nervous system stimulation by drugs, trauma, or lesion.
(1) In the absence of oxygen as final electron acceptor in the electron transport chain, aerobic metabolism is decreased.
(2) An increase in anaerobic metabolism results, which increases formation of lactic acid, a nonvolatile organic acid.
(3) If the oxygenation state of the patient is improved, lactic acidosis is reversed.
(2) In all cases insufficient volumes of glucose enter the cell, resulting in an increase in metabolism of body fats.
(3) The metabolic end products of fat metabolism are keto acids (e.g., acetone and β-hydroxybutyric acid).
(4) The patient with diabetic acidosis is generally hyperventilating significantly, and his or her breath has a sweet, acetone odor.
c. Renal failure (see Chapter 13)
(2) Decreased renal function inhibits the body’s primary mechanism for maintaining blood HCO3− levels and excretion of H+.
d. Ingestion of base-depleting drugs or acids
f. Potassium-sparing diuretics
h. Pancreatic or biliary fistulas, ureterosigmoidostomy
i. Carbonic anhydrase inhibitors: acetazolamide
j. Excessive intake of ammonium chloride, cationic anion acids
a. Hypokalemia (see Chapter 14)
b. Hypochloremia (see Chapter 14)
c. Gastric suction or vomiting
(1) Because gastric contents are acidic (pH 1.0 to 2.0), excessive loss of gastric fluid results in alkalosis.
(1) Diuretics cause an increase in the amount of K+ excreted.
(2) With excessive or uncontrolled use, hypokalemia may result.
A P o2, % Hb
 o2, and Cao2 − C
 o2 levels are reflective of the adequacy of O2 delivery to peripheral tissue.
B Alterations in these values may be caused by:
C All are predictive of alterations in CO if O2 content, tissue metabolism, and peripheral distribution of CO are unaltered.
D A decrease in P and % Hb
 and an increase in CaO2 − C
 are indicative of a decrease in CO relative to tissue demands and may be used as a reflection of cardiovascular reserve (Table 15-2).
TABLE 15-2
Mixed Venous Blood Gas Values During Various Levels of Cardiovascular Stress
CaO2 − C o2 (vol%) o2 (vol%) |
P o2 (mm Hg) o2 (mm Hg) |
% Hb o2 o2 |
||||
| Status | Average | Range | Average | Range | Average | Range |
| Normal | 5.0 | 3.4-6.0 | 40 | 37-43 | 75 | 70-76 |
| Critically ill but stable | 3.5 | 2.5-4.5 | 37 | 35-40 | 70 | 68-75 |
| Critically ill with limited reserve | 5.0 | 4.5-6.0 | 32 | 30-35 | 60 | 56-68 |
| Cardiovascularly decompensated | >6.0 | >6.0 | <30 | <30 | <56 | <56 |
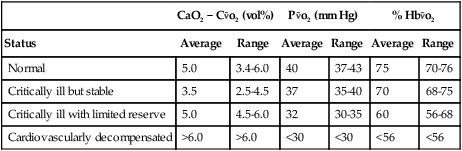
1. If CO decreases, the tissue must extract a greater quantity of O2 per unit of blood.
2. As a result P o2 and %Hb
 o2 must decrease, whereas the difference between arterial and venous O2 contents (CaO2 − C
 o2) must increase.
E For maximum accuracy these values must be obtained from a pulmonary artery catheter. This is necessary because peripheral venous blood is reflective of only local events, whereas pulmonary artery values reflect means of all tissue beds.
F Many pulmonary artery catheters use oximetry to continuously monitor percentage of Hb o2 or P
 o2. Some believe the percentage of Hb
 o2 or P
 o2 is best used as an early indicator of a cardiovascular incident resulting in altered O2 delivery.
XXI Estimation of Base Excess/Base Deficit
A Determine the pH predicted by an acute change in the Pco2.
1. For every 10-mm Hg Pco2 increase, the pH decreases by 0.05.
2. For every 10-mm Hg Pco2 decrease, the pH increases by 0.10.
B Determine the difference between the actual and predicted pH.
| Actual pH | 7.50 |
| Predicted pH | 7.35 |
| Difference | 0.15 |
C Eliminate the decimal and multiply by 2/3 to obtain BE/BD in milliequivalents per liter.
D If the actual pH is less than the predicted pH, this is a base deficit.
E If the actual pH is greater than the predicted pH, this is a base excess.
F This is an excess of 10 mEq/L of base in all extracellular fluid.
XXII Calculation of Bicarbonate Administration
A Normally HCO3− is administered only in the case of severe metabolic acidosis.
B Severe metabolic acidosis is defined as a base deficit of at least 10 mEq/L and one of the following:
2. A pH between 7.20 and 7.25 with an unstable cardiovascular system.
C If the pH is <7.25, HCO3− is normally not administered, even if the base deficit is 10 mEq/L.
D Extracellular fluid volume in liters can be estimated by taking one fourth the body weight in kilograms.
E The total body deficit in base is determined by multiplying the extracellular fluid volume by the base deficit in milliequivalents per liter.
F One half of this estimated amount is normally administered.
| Base deficit | 15 mEq/L |
| Weight | 80 kg |
| Extracellular fluid volume | 80/4 = 20 L |
XXIII Calculation of Ammonium Chloride (NH3Cl) or Dilute Hydrochloric Acid (HCl) Administration
XXIV Typical Blood Gas Contaminants
1. Sodium heparin is commonly used to prevent coagulation of arterial blood to be used for blood gas analysis.
2. Ammonium heparin may affect pH even in small quantities.
3. Normal pH of sodium heparin is 6.0 to 7.0.
4. Concentration used is 1000 units/ml.
5. Pco2 of sodium heparin is <2 mm Hg.
6. Po2 of sodium heparin is approximately 159 mm Hg.
7. Normally 0.05 ml of heparin/ml of blood should be used for anticoagulation.
8. If the concentration or volume of heparin used is above this level:
a. The pH level of the blood may decrease or remain the same.
b. The Pco2 of the blood will decrease.
c. The Po2 may be altered, depending on the blood’s original Po2 in relation to heparin’s Po2.
d. The HbO2% saturation may be altered, depending on the blood’s original Po2 and HbO2% saturation.
e. The Hbco% saturation will not be altered.
f. Hemoglobin content will decrease.
9. If insufficient heparin levels are used:
10. The problem of heparin contamination today is rare because most blood gas syringes come preheparinized and do not require the clinician to add fluid.
B Saline and other intravenous solutions alter blood gas values in a manner similar to that of heparin except that the pH may also increase.
1. The pH level of the blood normally will increase.
2. The Pco2 of the blood normally will decrease.
3. The Po2 of the blood may be altered, depending on the blood’s original Po2 compared with atmospheric Po2.
4. The HbO2% saturation may be altered, depending on the blood’s original Po2 and HbO2% saturation.
5. The Hbco% saturation will be altered.
6. Hemoglobin content is unaltered.