CHAPTER 75 Clinical Neurophysiology and Electroencephalography
OVERVIEW
The history of the encephalogram (EEG) may be traced back to the 1700s when Luigi Galvani demonstrated that electrical stimulation of a peripheral nerve in a frog caused contraction. In the mid-nineteenth century, Carlo Matteucci and Emil DuBoid-Reymond established the field of electrophysiology. In 1929, the German neuropsychiatrist Hans Berger demonstrated the Elektrenkephalogramm as a graphical representation of electrical activity in the human brain. In 1935, Frederic and Erna Gibbs with William Lennox recorded the EEG in patients in epilepsy and demonstrated its clinical utility.1 The synaptic origin of the EEG was demonstrated by Renshaw in the 1940.2 Starting in the 1950s, intracranial implantation of EEG electrodes was used for evaluation of epilepsy surgery. During this period, systematic description of sleep architecture with the EEG was also described. Computerized EEG acquisition and analysis have been possible since the 1970s.3 Long-term recording of simultaneous video and EEG tracings revolutionized the evaluation of epilepsy on many fronts.
Although the precise origin of the electrical activity is unknown, EEG activity recorded from the scalp is believed to originate from the postsynaptic potential of the neurons of the cortical pyramidal layer of the cortex. These charges form an electrical dipole, with a positive charge on one end and a negative charge on the other; this creates an electrical field. The summation of the electrical fields may be recorded by surface electrodes.4
The EEG records differences in electric fields, rather than a single action potential. As such, the voltage difference between two electrodes is measured by an amplifier; it is impossible to record from a single electrode. Each pair of electrodes outputs the difference between their potentials through a single channel, which may be graphically displayed on paper or on a computer monitor. The typical EEG machine connects a minimum of 21 electrodes and can display 16 (or more) channels. Electrical activity is recorded from a variety of standard sites on the scalp, according to a standard layout scheme (called the 10-20 International System of Electrode Placement) that can be easily replicated in all laboratories.5 Careful calibration of the signal intensity needs to be performed before each recording.
Considerable attention must be given to the selection of montages (or derivations), for example, determining the combination of pairs of electrodes to be recorded. Two different montages are currently in use. In the referential (or monopolar) montage, each of the electrodes is measured against the same reference electrode, which is presumed to be relatively electrically inactive. Commonly used reference points are the ears, other noncephalic regions, or the average of all other electrodes. In bipolar montages, electrodes in a line along an anatomical region are recorded serially as successive pairs. The first channel would be from the first and second electrodes, the second channel would be from the second and third electrodes, and so forth. The most popular bipolar montage is the anteroposterior “double banana” montage. Creation of different montages gives various views of the electrical activity at different parts of the brain. All EEGs are analyzed using multiple montages over the same recording, including both referential and bipolar montages.
Before the 1980s, the EEG was recorded on paper through an “analog” system. Today, nearly all EEGs are recorded “digitally” and displayed on a computer monitor. The major advantage of digital recording is that the EEG can be reformatted and flexibly reviewed in any montage, allowing the development of automated seizure detection algorithms. Benefits of other quantitative tools remain to be realized (see Quantitative EEG, later in this chapter).6
THE NORMAL EEG
The electrical activity from any electrode pair can be described in terms of amplitude and frequency (Figure 75-1). Amplitude ranges from 5 μV to 200 μV. The frequency of EEG activity ranges from 0 Hz to about 20 Hz. The frequencies are described by Greek letters: delta (0 to 3 Hz), theta (4 to 7 Hz), alpha (8 to 13 Hz), and beta (more than 13 Hz).
In routine EEG studies, some “activation” procedures are carried out to enhance or elicit normal or abnormal EEG activity. These procedures, such as hyperventilation, photic stimulation, sleep, sleep deprivation, and, rarely, the use of drugs, are useful in bringing out epileptic activity.7 The most common activation procedures are 3 minutes of hyperventilation and a flashing strobe light (at frequencies between 5 and 30 Hz). The normal response to hyperventilation ranges from no change from baseline to a buildup of high-amplitude delta waves. A hyperventilation response is particularly marked in children and young adults. The most specific abnormal response to hyperventilation is the production of generalized spike-wave discharges of a typical absence seizure. Photic stimulation with a stroboscope may produce a driving response, or occipital discharges at a frequency that is a harmonic multiple of the flash frequency. In a small number of epileptic patients, photic stimulation may elicit electrographic epileptiform activity, or even frank seizures.8 The use of an activating procedure in patients monitored on video-EEG for nonepileptic psychogenic seizures is controversial. On the one hand, procedures (such as saline injection or placement of a vibrating tuning fork on the patient) to elicit psychogenic seizures are easy, safe, and potentially diagnostic. However, others believe that the deception involved undermines the care of the patient. Some have proposed using only standard activating procedures (e.g., hyperventilation and photic stimulation) to elicit psychogenic seizures.9
EEG AND AGE
The EEG background is dramatically different in neonates, infants, and children. The EEG plays an important role in the evaluation of preterm infants, as stereotyped EEG changes are seen in the maturing brain.10 The EEG may be discontinuous and asynchronous in premature infants. Sharp activity, not indicative of epileptic activity, may be seen up to age 1 month. Posterior background rhythms increase from 5 to 6 Hz at age 1 to the normal 9 to 11 Hz by age 15.11 Alpha background decreases with age, but should not drop below 8 Hz.12
EEG ABNORMALITIES
Nonepileptic EEG Abnormalities
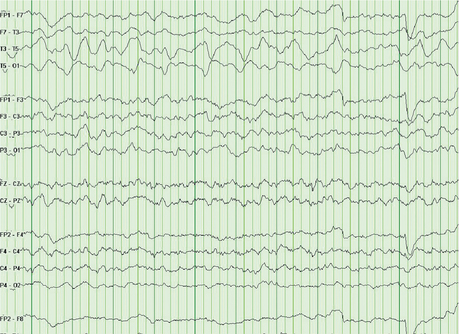
In particular, focal delta activity is usually irregular in configuration and is termed polymorphic delta activity (PDA) (Figure 75-2). PDA is usually indicative of a focal brain lesion (such as tumor, stroke, hemorrhage, or abscess).13 Before the advent of modern neuroimaging, focal delta abnormalities were used to localize cerebral lesions. Focal cerebral lesions may also cause asymmetric slowing of the background alpha waves or asymmetric beta activity.
The EEG may also show generalized abnormalities, particularly in encephalopathies. As a general rule, the EEG is a sensitive, though nonspecific, test for encephalopathies. The most common pattern with metabolic encephalopathies is generalized moderate- to high-amplitude theta and delta activity without an alpha resting background.14 Another common pattern observed with hepatic and renal encephalopathies is the presence of triphasic delta waves.15 These are high-voltage, diffuse periodic discharges, and are at times difficult to differentiate from epileptiform generalized spike/sharp-slow wave discharges.16 In infectious encephalopathies, particularly in encephalitides, an admixture of slow activity and epileptogenic activity is often seen.
Intermittent rhythmic delta activity may be seen focally or diffusely. Such activity is frequently confined to the frontal region in adults, and is called frontal intermittent rhythmic delta activity (FIRDA); in children, this pattern is most often located posteriorly. Although initially believed to have been a sign of increased intracranial pressure in young people, these monomorphic high-amplitude waves are most often seen in diffuse encephalopathies.17
In hypoxic encephalopathies, low-amplitude slow waves are typically observed.18 In more severe cases, one may observe a burst-suppression pattern, in which a voltage-suppressed background is interrupted by generalized high-amplitude sharp activity. In most severe cases of coma, generalized suppression of amplitude (i.e., electrocerebral silence) on the EEG in the absence of possible modifying factors (e.g., medications and hypothermia) is an ancillary test to confirm brain death.19
EEG Abnormalities in Seizure Disorders
The EEG has been particularly useful in the analysis of patients with seizure disorders. Paroxysmal abnormalities are common between overt seizures (i.e., interictally), as well as during seizures (ictally). Paroxysmal abnormalities include the spike and the sharp wave. A spike is a single wave that stands out from the background activity and has a duration of less than 70 ms. A sharp wave is similar with a duration between 70 and 200 ms. A spike or sharp wave has an asymmetric up-phase and down-phase and is often followed by a slow wave. The existence of a spike or sharp wave is highly specific; a single sharp wave in the proper clinical context may be sufficient to confirm a seizure disorder. However, such findings are insensitive; the EEG is frequently normal and devoid of such discharges even in patients known to have epilepsy. Multiple recordings may be required to capture an abnormality and to make a diagnosis.20
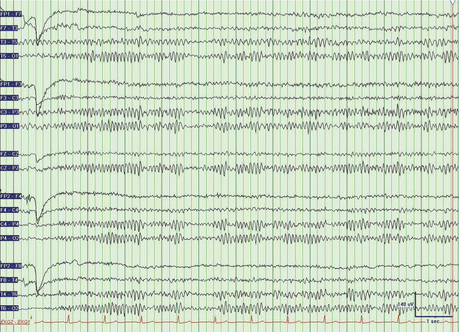
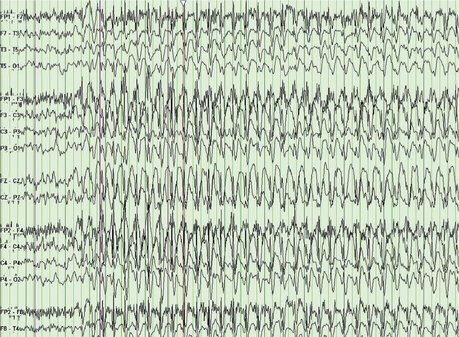
Epileptic paroxysmal abnormalities can be either generalized or focal. The classic generalized abnormality is the 3-Hz spike and wave pattern that underlies the petit mal absence attack (Figure 75-3). A typical focal abnormality is a focal single spike followed by a slow wave. This abnormality can be seen interictally in focal epilepsy, such as temporal lobe epilepsy (TLE). EEG recorded during a seizure may show a variety of patterns, including repetitive spikes/sharp waves, spike–slow wave complexes, rhythmic theta activity, and others. After a seizure (postictally), the EEG most frequently shows pronounced slow waves. Scalp EEGs are notoriously unreliable for the detection of simple partial seizures.
THE EEG AS IT RELATES TO PSYCHIATRY
Medication Effects
Benzodiazepines are well known to increase the beta frequency and mild background slowing in EEG recordings.21 Barbituates, in small doses, increase the beta activity, predominantly in the frontal leads. With increasing doses, there is increased slow activity and attenuation of alpha activity, indicative of increasing drowsiness. With sufficiently high doses, a burst suppression pattern and eventually electrocerebral silence ensues.22 Withdrawal will result in generalized sharp activity and may be accompanied by withdrawal seizures. General anesthetics will induce fast frontal activity and attenuation of alpha, and, with deeper coma, a burst suppression pattern.23 Conventional antiepileptic medications have not been associated with definite EEG changes at therapeutic levels.22
Few definite electrographic changes have been reported with most typical antipsychotic drugs at therapeutic doses; background slowing and even epileptic activity may be seen at higher doses. Clozapine induces abnormalities (such as slowing and spikes) in more than half of patients.24 Lithium may produce diffuse slowing and enhance preexisting epileptiform activity on the EEG.22 No specific EEG changes are seen with use of antidepressants.
Alcohol and Other Recreational Drugs
Patients with alcoholism are vulnerable to falls and to other head trauma. In these patients, focal EEG abnormalities and partial seizures may be seen. During acute intoxication, slowing is seen on the EEG, but it diminishes with tolerance. Alcohol withdrawal seizures are generalized, even in patients with focal injuries. The EEG in chronic alcoholism is associated with a greater incidence of low-voltage (less than 25 μV) recordings with little slowing in more than half the patients (56%) as compared to control subjects without a history of alcoholism (13.9%).25 This can be helpful in distinguishing delirium tremens (DTs) from other toxic metabolic encephalopathies that are associated with diffuse theta and delta slow waves. An increase in beta activity is seen on the EEG with use of cocaine and other central nervous system (CNS) stimulants.22,26 No clinically useful changes on the EEG are seen with other recreational drugs.
Dementia and Pseudodementia
Obtaining an EEG may be helpful in the process of differentiating dementia with secondary depression from depressive pseudodementia. In patients with either depression or depressive pseudodementia, the EEG has been shown to be either normal or mildly slowed. In contrast, in patients with dementia with secondary depression, the majority have abnormal EEGs; in up to one-third of patients, there may be moderate or severe abnormalities.27
Schizophrenia
Studies have demonstrated that patients who demonstrate normal EEG findings with decreased reactivity to stimuli, deemed to be “hypernormal,” had an unfavorable prognosis.28 Increased delta and beta activity, as well as decreased alpha frequencies, have been reported in patients with schizophrenia.29 Electroencephalography has been used to evaluate the theory that schizophrenia is the result of functional disconnections in cerebral networks. Decreased intrahemispheric coherence in the EEG has been demonstrated in patients with schizophrenia.30 In general, EEG studies in schizophrenic patients have produced inconsistent results, and it has been debated whether EEG abnormalities in these patients are due to the state of the patient or due to the trait of the disease.31
QUANTITATIVE EEG
Quantitative EEG (qEEG) involves the use of computerized statistical analysis and graphical representation of EEG data. Common manipulations include spectral analysis, which involves conversion of the time domain into a frequency domain through Fourier transformation, thus allowing the assessment of the “power” of a frequency over a given recording; source analysis, a technique used to back-project EEG signals to derive localization of a dipole; and electromagnetic tomography, a method of graphing statistical results onto the patient’s structural neuroimaging scan (such as a magnetic resonance imaging [MRI] scan) to create a map of these results. Because of difficulty in replicating studies, over-enthusiastic usage of statistical manipulation, and aggressive marketing of qEEG devices in the 1980s, the role of qEEG in a wide range of neuropsychiatric disorders has been cast into doubt by the neurological community.32 The American Neuropsychiatric Association recommends cautious use of qEEG in attentional and learning disabilities of childhood, and in mood and dementing disorders.32
EVOKED POTENTIALS
Evoked potentials (EPs) can be used to test the integrity of a pathway in the CNS. A sensory stimulus in any modality (e.g., visual, auditory, or somatosensory) will produce a change in the EEG. The change is usually small compared with the background EEG; the exact configuration of the change depends on the nature of the stimulus and the site of the recording on the scalp. The evoked potential is the change in the EEG that is dependent on, and time-locked to, the stimulus; to see it, the stimulus must be repeated many times and the EEG averaged.33–35
The most common use of evoked potentials is to test the speed of conduction in a particular pathway. Multiple sclerosis is a disease of central myelin; if myelin is damaged, conduction is slowed and the evoked potentials will be delayed. Although many multiple sclerosis plaques are clinically silent they often show themselves with this electrical test. Hence, evoked potentials are quite useful in making the diagnosis of multiple sclerosis.36
Visual evoked potentials (VEPs) were the first to become popular. They are ordinarily obtained with a checkerboard stimulus that alternates black and white squares repetitively. Each eye is stimulated individually and then responses are measured from the occipital area of the scalp. The major wave measured is a large positive wave at a latency of about 100 ms (P100). In multiple sclerosis or optic neuritis, the wave is delayed.36 Delayed or absent VEPs can be seen in many other conditions, including ocular conditions (e.g., glaucoma), compressive lesions of the optic nerve (e.g., pituitary lesions), and pathological conditions of the optic radiations or the occipital cortex.
Auditory stimulation produces complex waveforms. Stimulation with brief clicks produces six small waves in the first 10 ms. Surprisingly, the sources of this electrical activity are in serial ascending structures in the brainstem. It becomes possible to study the integrity of the brainstem with these waves, and the test has also been used to assess “brainstem death” in cases suspected of “brain death.”37 The waves are also delayed in multiple sclerosis.
Somatosensory evoked potentials (SEPs) are the averaged electrical responses in the CNS to somatosensory stimulation. Like sensory nerve action potentials (SNAPS) in the peripheral nervous system, most components of SEPs represent activity carried in the large sensory fibers of the dorsal column (medial lemniscus primary sensorimotor cortex pathway). SEPs can be used to test the integrity of the pathway and to test the speed of conduction in the pathway.
It is possible to localize a lesion in the somatosensory pathway by using short latency SEPs from subcortical structures. Several systems of electrode placement can be used, but the one that seems to produce potentials of greatest amplitude is where the active electrode is placed over the cervical spine and referred to an “inactive” site such as the vertex of the head. Four components can be identified.38 By stimulating leg nerves, it is possible to obtain EPs at all levels of the neuraxis, including over the spinal cord. SEPs are particularly useful in evaluation of a comatose patient. Bilaterally absent SEPs are highly predictive of poor outcome.39
NERVE CONDUCTION
Peripheral Nerve Conduction Studies
Motor Nerve Conduction
The interval between delivery of the electrical stimulus and the onset of the muscle action potential may be difficult to interpret. This period is composed of the time it takes for the motor nerve action potential to travel down the terminal branches of the axon, the time for the release of acetylcholine into the neuromuscular junction, the time for the acetylcholine to produce an endplate potential, the time for generation of a muscle action potential, and, depending on the position of the recording electrodes, the time for the muscle action potential to propagate to the recording electrodes. Calculation of a conduction velocity for these neurons is not as straightforward as it is for the sensory nerve. The interval itself, if obtained under standard conditions, can be a useful measure of the conduction time in the terminal part of the axon; it is termed the distal motor latency.
A focal lesion of a nerve will lead to slowing of conduction and to a decrement of amplitude across the segment, including the area of the lesion, but studies of the nerve distal to the lesion will be fully normal. Studies of nerve segments proximal to the lesion will show normal conduction velocity with an unchanging and reduced action potential amplitude. Quite dramatic nerve conduction findings are seen with a focal, total lesion. The nerve is fully normal below the lesion, but electrical stimulation proximal to the lesion produces no response (similar to the patient’s attempts to activate the muscle).40
Late Responses
The F-response or F-wave has an advantage over the H-reflex in that it can be found in most muscles. It is a manifestation of recurrent firing of an anterior horn cell after it has been invaded by an antidromic action potential. After a motor nerve is stimulated, an action potential runs antidromically as well as orthodromically; a small percentage of anterior horn cells that have been invaded antidromically will produce an orthodromic action potential that is responsible for the F-response. Thus, to produce an F-response, action potentials must travel twice through the proximal segment of the motor nerve.41
ELECTROMYOGRAPHY
The Physiology Underlying Electromyography
When an EMG needle is placed in a normal muscle at rest, there is no electrical activity. With weak effort, first one and then several motor units are activated. At this low level of activation, it is possible to see the individual MUAPs and evaluate their parameters. With maximal effort so many units are brought into action that individual MUAPs cannot be discerned; all that can be seen is a dense electrical pattern, called an interference pattern, which can be characterized by its density and peak-to-peak amplitude. The normal density would be either “full,” if there are no gaps, or “highly mixed,” if there are a few, short gaps. Some people are not willing or able to exert a maximal effort and the pattern will be less dense as a result. Hence, the degree of effort has to be taken into account when assessing the interference pattern.
Findings on the Electromyogram
Neuromuscular Junction Studies
Single-fiber EMG is highly sensitive for the diagnosis of myasthenia gravis. In this test, a small needle is used that can detect the action potentials from single muscle fibers. The time between the firing of two muscle fibers from the same motor unit should be very stable. In myasthenia gravis, due to the slow and uncertain function of the neuromuscular junction, there may be an increase in the variability of the time between firing of these two muscle fibers; this is called “increased jitter.”42
1 Gibbs F, Davis H, Lennox W. The electro-encephalogram in epilepsy and in conditions of impaired consciousness. Arch Neurol Psychiatr. 1935;34:1133-1148.
2 Gloldensohn ES. Animal electricity from Bologna to Boston. Electroencephalogr Clin Neurophysiol. 1998;106(2):94-100.
3 Niedermeyer E. Historical aspects. In Niedermeyer E, da Silva F, editors: Electroencephalography: basic principles, clinical applications, and related fields, ed 5, Philadelphia: Lippincott Williams & Wilkins, 2005.
4 Schaul N. The fundamental neural mechanisms of electroencephalography. Electroencephalogr Clin Neurophysiol. 1998;106(2):101-107.
5 Jasper H. Report of committee on methods of clinical exam in EEG. Electroencephalogr Clin Neurophysiol. 1958;10:370-375.
6 Krauss G, Webber W. Digital EEG. In Niedermeyer E, da Silva F, editors: Electroencephalography: basic principles, clinical applications, and related fields, ed 5, Philadelphia: Lippincott Williams & Wilkins, 2005.
7 Leach J, Stephen L, Salveta C, et al. Which electroencephalography (EEG) for epilepsy? The relative usefulness of different EEG protocols in patients with possible epilepsy. J Neurol Neurosurg Psychiatry. 2006;77(9):1040-1042.
8 Fisch B, So E. Activation methods. In Ebersole JS, Pedley TA, editors: Current practice of clinical encephalography, ed 3, Philadelphia: Lippincott Williams & Wilkins, 2003.
9 Iriarte J, Parra J, Urrestarazu E, et al. Controversies in the diagnosis and management of psychogenic pseudoseizures. Epilepsy Behav. 2003;4(3):354-359.
10 Scher MS. Neurophysiological assessment of brain function and maturation: I. A measure of brain adaptation in high risk infants. Pediatr Neurol. 1997;16(3):191-198.
11 Clancy R, Berquvist A, Dlugos DJ. Neonatal electroencephalography. In Ebersole JS, Pedley TA, editors: Current practice of clinical encephalography, ed 3, Philadelphia: Lippincott Williams & Wilkins, 2003.
12 Brenner RP, Ulrich RF, Spiker DG, et al. Computerized EEG spectral analysis in elderly normal, demented and depressed subjects. Electroencephalogr Clin Neurophysiol. 1986;64(6):483-492.
13 Bazil C, Herman S, Pedley TA. Focal electroencephalographic abnormalities. In Ebersole JS, Pedley TA, editors: Current practice of clinical encephalography, ed 3, Philadelphia: Lippincott Williams & Wilkins, 2003.
14 Markand O. Electroencephalography in diffuse encephalopathies. J Clin Neurophysiol. 1984;1(4):357-407.
15 Fisch B, Klass D. The diagnostic specificity of triphasic patterns. Electroencephalogr Clin Neurophysiol. 1988;70(1):1-8.
16 Boulanger JM, Deacon C, Lecuyer D, et al. Triphasic waves versus nonconvulsive status epilepticus: EEG distinction. Can J Neurol Sci. 2006;33(2):175-180.
17 Hooshmand H. The clinical significance of frontal intermittent rhythmic delta activity (FIRDA). Clin Electroencephalogr. 1983;14(3):135-137.
18 Synek V. Prognostically important EEG coma patterns in diffuse anoxic and traumatic encephalopathies in adults. J Clin Neurophysiol. 1988;5(2):161-174.
19 Wijdicks EF. The diagnosis of brain death. N Engl J Med. 2001;344(16):1215-1221.
20 Gilbert D, Sethuraman G, Kotagal U, et al. Meta-analysis of EEG test performance shows wide variation among studies. Neurology. 2003;60(4):564-570.
21 Browne TR, Penry JK. Benzodiazepines in the treatment of epilepsy. A review. Epilepsia. 1973;14(3):277-310.
22 Van Cott AC, Brenner RP. Drug effects and toxic encephalopathies. In Ebersole JS, Pedley TA, editors: Current practice of clinical encephalography, ed 3, Philadelphia: Lippincott Williams & Wilkins, 2003.
23 Bauer G, Bauer R. EEG, drug effects, and central nervous system poisoning. In Niedermeyer E, da Silva F, editors: Electroencephalography: basic principles, clinical applications, and related fields, ed 5, Philadelphia: Lippincott Williams & Wilkins, 2005.
24 Spatz R, Kugler J. Abnormal EEG activities induced by psychotropic drugs. Electroencephalogr Clin Neurophysiol Suppl. 1982;36:549-558.
25 Krauss G, Niedermeyer E. Electroencephalogram and seizures in chronic alcoholism. Electroencephalogr Clin Neurophysiol. 1991;78(2):97-104.
26 Herning RI, Jones RT, Hooker WD, et al. Cocaine increases EEG beta: a replication and extension of Hans Berger’s historic experiments. Electroencephalogr Clin Neurophysiol. 1985;60(6):470-477.
27 Brenner RP, Reynolds CF3rd, Ulrich RF. EEG findings in depressive pseudodementia and dementia with secondary depression. Electroencephalogr Clin Neurophysiol. 1989;72(4):298-304.
28 Shagass C. An electrophysiological view of schizophrenia. Biol Psychiatry. 1976;11(1):3-30.
29 Kemali D, Galderisi S, Maj M, et al. Computerized EEG topography findings in schizophrenic patients before and after haloperidol treatment. Int J Psychophysiol. 1992;13(3):283-290.
30 Tauscher J, Fischer P, Neumeister A, et al. Low frontal electroencephalographic coherence in neuroleptic-free schizophrenic patients. Biol Psychiatry. 1998;44(6):438-447.
31 Sengoku A, Takagi S. Electroencephalographic findings in functional psychoses: state or trait indicators? Psychiatry Clin Neurosci. 1998;52(4):375-381.
32 Nuwer M. Assessment of digital EEG, quantitative EEG, and EEG brain mapping: report of the American Academy of Neurology and the American Clinical Neurophysiology Society. Neurology. 1997;49(1):277-292.
33 Chiappa KH. Evoked potentials in clinical medicine, ed 3. New York: Lippincott Williams & Wilkins, 1997.
34 Nuwer M. Fundamentals of evoked potentials and common clinical applications today. Electroencephalogr Clin Neurophysiol. 1998;106(2):142-148.
35 American Electroencephalographic Society. Guidelines in electroencephalography, evoked potentials, and polysomnography. J Clin Neurophysiol. 1994;11(1):1-147.
36 Khoshbin S, Hallet M. Multimodality evoked potentials and blink reflex in multiple sclerosis. Neurology. 1981;31(2):138-144.
37 Stockard J, Pope-Stockard J, Sharbrough F. Brainstem auditory evoked potentials in neurology: methodology, interpretation and clinical applications. In Aminoff AM, editor: Electrodiagnosis in clinical neurology, ed 3, New York: Churchill-Livingstone, 1992.
38 Jones SJ. Short latency potentials recorded from the neck and scalp following median nerve stimulation in man. Electroencephalogr Clin Neurophysiol. 1977;43(6):853-863.
39 Facco E, Munari M, Gallo F, et al. Role of short latency evoked potentials in the diagnosis of brain death. Clin Neurophysiol. 2002;113(11):1855-1866.
40 Cornblath DR, Sumner AJ, Daube J, et al. Conduction block in clinical practice. Muscle Nerve. 1991;14(9):869-871. discussion 867-868
41 Andersen H, Stalberg E, Falck B. F-wave latency, the most sensitive conduction parameter in patients with diabetes mellitus. Muscle Nerve. 1997;20(10):1296-1302.
42 Stalberg E, Tronteli J. Single fiber electromyography: studies in healthy and diseased muscle. New York: Raven Press, 1994.