Cardiac Output Measurement Techniques (Invasive)
PREREQUISITE NURSING KNOWLEDGE
• Understanding of normal anatomy and physiology of the cardiovascular system and pulmonary system is necessary.
• Understanding of basic dysrhythmia recognition and treatment of life-threatening dysrhythmias is needed.
• Pathophysiologic changes associated with structural heart disease (e.g., ventricular dysfunction from myocardial infarction, diastolic or systolic changes and valve dysfunction) should be understood.
• Understanding of the principles of aseptic technique is necessary.
• Understanding of the pulmonary artery (PA) catheter (see Fig. 73-1), lumens and ports, and the location of the PA catheter in the heart and PA (see Fig. 73-2) is needed.
• Multiple pressure transducer systems (see Procedure 76) should be understood.
• Competence in the use and clinical application of hemodynamic waveforms and values obtained with a PA catheter is necessary. Hemodynamic waveform interpretation of right atrial pressure (RAP) or central venous pressure (CVP), pulmonary artery pressure (PAP), and pulmonary artery occlusion pressure (PAOP) or pulmonary artery wedge pressure (PAWP) provides confirmation of proper catheter placement.
• Knowledge of vasoactive and inotropic medications and their effects on cardiac function, ventricular function, coronary vessels, and vascular smooth muscles is needed.
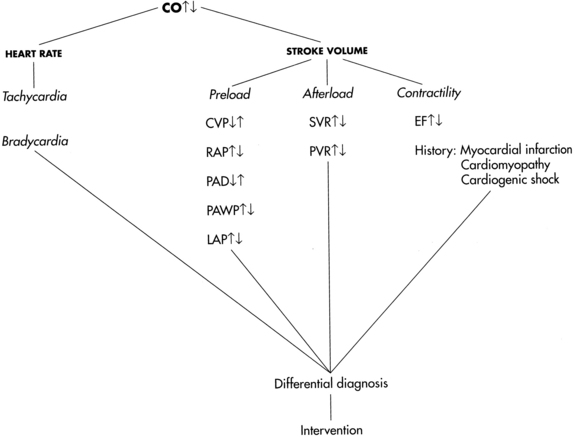
• Cardiac output (CO) is defined as the amount of blood ejected by the left ventricle per minute and is the product of stroke volume (SV) and heart rate (HR). It is measured in liters per minute.

• Normal CO is 4 to 8 L/min. The four physiologic factors that affect CO are preload, afterload, contractility, and heart rate.
• Stroke volume is the amount of blood volume ejected from either ventricle during one beat. Left ventricular stroke volume is the difference between left ventricular end-diastolic volume and left ventricular end-systolic volume. Left ventricular stroke volume is normally 60 to 100 mL/beat. Major factors that influence stroke volume are preload, afterload, and contractility.
• Right heart preload refers to the amount of blood in the right ventricle (RV) at the end of diastole and is measured by the RAP or CVP. Elevations in left heart filling pressures may be accompanied by parallel changes in RAP, especially in patients with left systolic ventricular dysfunction. Other factors that affect RAP are venous return, intravascular volume, vascular capacity, and pulmonary pressure. Right heart preload is increased in right heart failure, right ventricular infarction, pericardial tamponade, tension pneumothorax, tricuspid regurgitation, and fluid overload. Right heart preload is decreased in hypovolemic states.
• Left heart preload refers to the amount of blood in the left ventricle (LV) at the end of diastole and is measured by the PAOP or PAWP. When LV preload or end-diastolic volume increases, the muscle fibers are stretched. The increased tension or force of contraction that accompanies an increase in diastolic filling is called the Frank-Starling law. The Frank-Starling law allows the heart to adjust its pumping ability to accommodate various levels of venous return. Note: In patients with advanced chronic LV dysfunction and remodeled hearts (spherical or globular-shaped LV instead of the normal elliptical-shaped LV), the Frank-Starling law does not apply. In these patients, muscle fibers of the heart are already maximally lengthened; as a result, the heart cannot respond significantly to increased filling or stretch with increased force of contraction.
• Afterload refers to the force the ventricular myocardial fibers must overcome to shorten or contract. It is the force that resists contraction. The amount of force the LV must overcome influences the amount of blood ejected into the systemic circulation. Afterload is influenced by peripheral vascular resistance (the force opposing blood flow within the vessels), systolic blood pressure, systolic stress, and systolic impedance. Peripheral resistance is affected by the length and radius of the blood vessel, arterial blood pressure, and venous constriction or dilation. The systolic force of the heart is increased in conditions that cause vasoconstriction (increased afterload), including aortic stenosis, hypertension, or hyperviscosity of blood (e.g., polycythemia). The systolic force of the heart is decreased in conditions that cause vasodilation or decrease the viscosity of blood (e.g., anemia). Right ventricular afterload is measured as pulmonary vascular resistance. Left ventricular afterload is measured as systemic vascular resistance.
• Contractility is defined as the ability of the myocardium to contract and eject blood into the pulmonary or systemic vasculature. Contractility is increased by sympathetic neural stimulation, the release of calcium, and norepinephrine and decreased by parasympathetic neural stimulation, acidosis, and hyperkalemia. Contractility and HR can be influenced by neural, humoral, and pharmacologic factors.
• In addition to stroke volume, CO is affected by heart rate. Normally, nerves of the parasympathetic and sympathetic nervous system regulate heart rate through specialized cardiac electrical cells. Heart rate and rhythm are influenced by neural, humoral, and pharmacologic factors. Decreased HR can be the result of increased parasympathetic neural stimulation, decreased sympathetic neural stimulation, or decreased body temperature. Increased HR can be triggered by exercise, catecholamine release, or hypotension. At HRs greater than 180 beats/min, there may be inadequate time for diastolic filling, resulting in decreased CO. Because multiple factors regulate cardiac performance and impact CO, these factors must be assessed (Fig. 67-1).
• Cardiac index adjusts the CO to an individual’s body size (square meter of body surface area). It is a more precise measurement of cardiac performance than CO.
• Refer to Table 67-1 for normal hemodynamic values and calculations.
Table 67-1
| Parameters | Calculations | Normal Value |
| Body surface area (BSA) | Weight (kg) × height (cm) × 0.007184 | Varies with size (range = 0.58 to 2.9 m2) |
| CO | HR × SV | 4-8 L/min |
| Stroke volume (SV) | CO × 1000 ÷ HR | 60-100 mL/beat |
| Stroke volume index (SVI) | SV ÷ BSA | 30-65 mL/beat/m2 |
| Cardiac index (CI) | CO ÷ BSA | 2.5-4.5 L/min/m2 |
| Heart rate (HR) | 60-100 beats/min | |
| Preload | ||
| Central venous pressure (CVP) or RAP | 2-6 mm Hg | |
| Left atrial pressure (LAP) | 4-12 mm Hg | |
| Pulmonary artery diastolic pressure (PADP) | 5-15 mm Hg | |
| PAOP | 4-12 mm Hg | |
| RVEDP | 0-8 mm Hg | |
| LVEDP | 4-10 mm Hg | |
| Afterload | ||
| Systemic vascular resistance (SVR) | MAP − CVP/RAP × 80 ÷ CO | 900-1400 dynes/s/cm−5 |
| SVR index (SVRI) | MAP − CVP/RAP × 80 ÷ CI | 2000-2400 dynes/s/cm−5/m2 |
| Pulmonary vascular resistance (PVR) | PAMP − PAOP × 80 ÷ CO | 100-250 dynes/s/cm−5 |
| PVR index (PVRI) | PAMP − PAOP × 80 ÷ CI | 255-315 dynes/s/cm−5/m2 |
| Systolic blood pressure | 100-130 mm Hg | |
| Contractility | ||
| Ejection fraction (EF): | ||
| Left | LVEDV × 100 ÷ SV | 60%-75% |
| Right | RVEDV × 100 ÷ SV | 45%-50% |
| Stroke work index: | ||
| Left | SVI (MAP − PAOP) × 0.0136 | 50-62 g-m/m2/beat |
| Right | SVI (MAP − CVP) × 0.0136 | 5-10 g-m/m2/beat |
| Pressures: | ||
| MAP | DBP + ⅓ (SBP − DBP) | 70-105 mm Hg |
| PAMP | PADP + ⅓ (PASP − PADP) | 9-16 mm Hg |
Adapted from Tuggle D: Optimizing hemodynamics: strategies for fluid and medication titration in shock. In Carlson K, editor: AACN advanced critical care nursing, St Louis, 2009, Saunders, 1106; and Ahrens T: Hemodynamic monitoring, Crit Care Nurs Clin N Am 11:19-31, 1999.
• At the bedside, cardiac output measurements are obtained through a PA catheter via the intermittent bolus thermodilution CO method (TDCO) or the continuous CO (CCO) method.
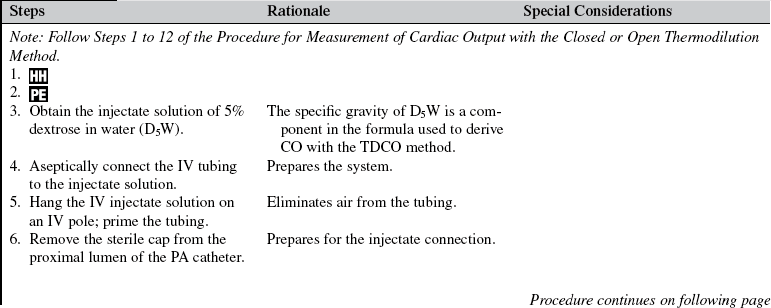
• The TDCO method proceeds as follows:
 An injectate (5% dextrose in water) of a known volume (10 mL) and temperature (room or cold temperature) is injected into the right atrium (RA) through the proximal port of the PA catheter. This injectate exits in the RA, where it mixes with blood and flows through the right ventricle to the PA. A thermistor located at the tip of the PA catheter senses the change in blood temperature as the blood passes the tip of the catheter in the PA. The CO is calculated as the difference in temperatures on a time versus temperature curve.
• CO can be calculated from PA catheters with two types of thermistors:
 A single thermistor has one inline temperature sensor near the tip of the catheter that lies in the PA when in proper position.
 A dual thermistor has two inline temperature sensors, one in the right atrium/superior caval vein (immediately above the injectate port opening) and one near the tip of the catheter (same position as single thermistor). Because a temperature sensor is located in the right atrium, there is no need to enter a “correction factor” or “computation constant” into the computer to account for the loss in thermal indicator (heat) from the hub of the RA injectate port to the RA. Investigators found that the second thermistor improved accuracy when compared with Fick CO measurements and also improved precision or repeatability of CO measurements in both cold and room temperature.4,24 In one study, cold injectate had excellent precision with the standard single-thermistor PA catheter. Researchers concluded that the dual-thermistor PA catheter provided the greatest benefit in decreasing measurement variability when room temperature injections were used to measure CO.4
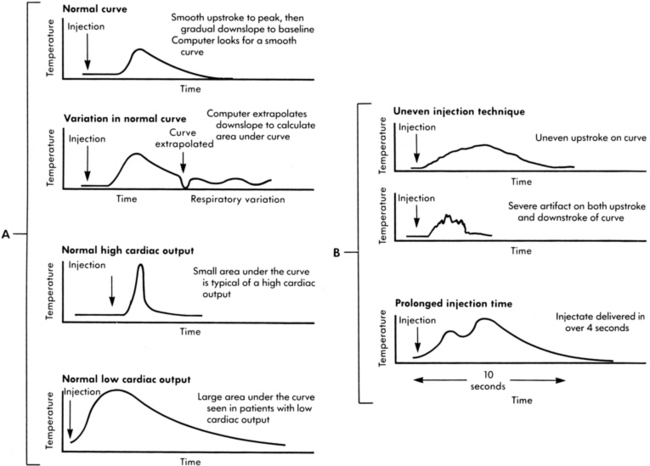
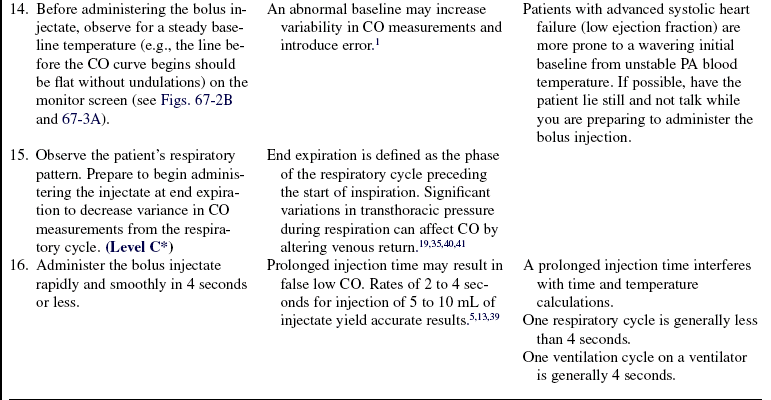
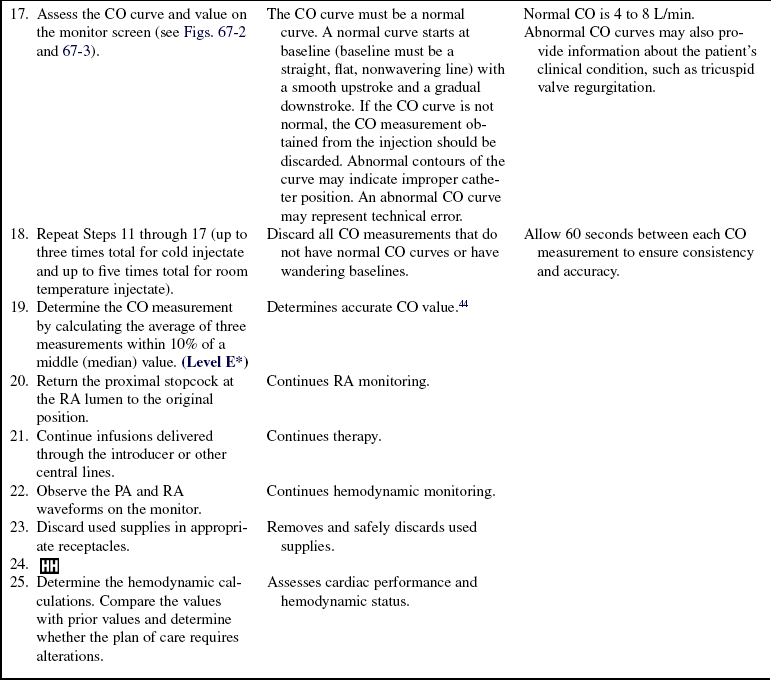
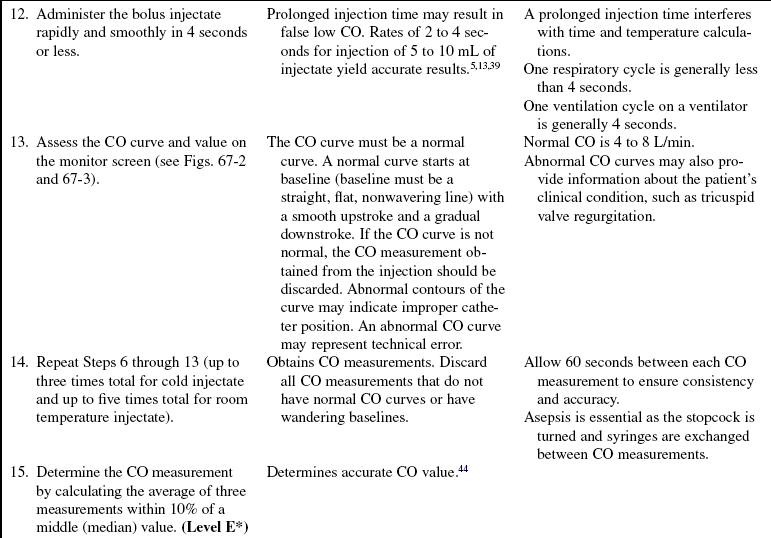
• The change in temperature over time is plotted as a curve and displayed on the bedside monitor screen. CO is mathematically calculated from the area under the curve and is displayed digitally and graphically on the monitor screen (Fig. 67-2). The area under the curve is inversely proportional to the rate of blood flow. Thus, a high CO is associated with a small area under the curve, whereas a low CO is associated with a large area under the curve (Fig. 67-3, A).
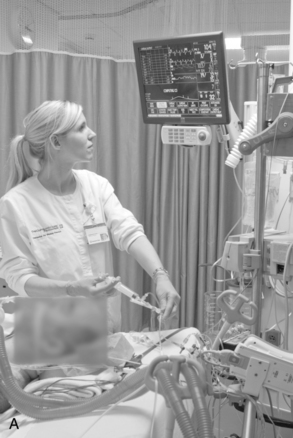
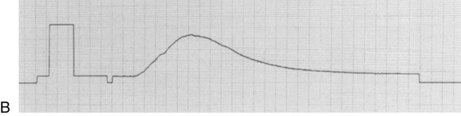
Figure 67-2 A, Examining cardiac output curves to establish reliability of values. B, Normal cardiac output curve with rapid upstroke and smooth progressive decrease in temperature sensing. (B: From Ahrens T: Hemodynamic monitoring, Crit Care Nurs Clin North Am 11[1]:28, 1999.)
• The thermistor near the distal tip of the catheter detects the temperature change and sends a signal to the CO computer and bedside monitor. The computer calculates the CO with the modified Stewart Hamilton equation, and the CO number is displayed on the monitor screen. The average result of three to five measurements is used to determine CO.
• Accuracy of TDCO is dependent on adequate mixing of blood and injectate, forward blood flow, steady baseline temperature in the PA, and appropriate procedural technique.3,16,19 In addition, loss of thermal indicator (heat), respiratory artifact, and hemodynamic instability can cause variability from one injection to another.19,29
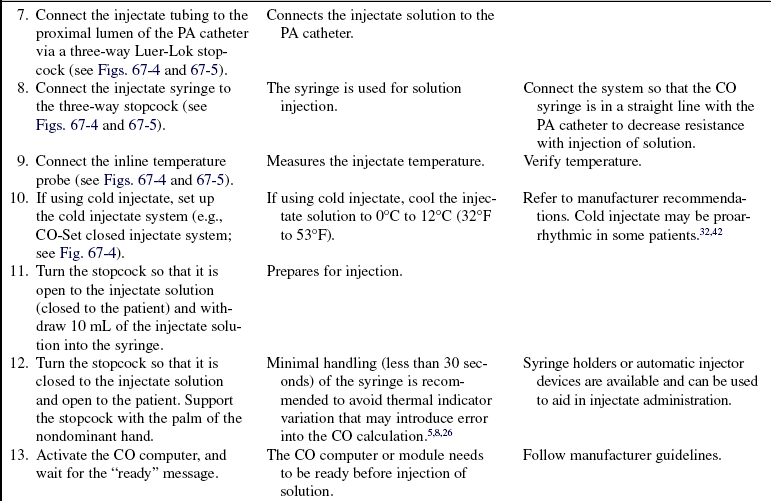
• Commercially available closed system delivery sets (CO-Set, Edwards Lifesciences, LLC, Irvine, CA) can be used with both cold and room temperature injectate (Figs. 67-4 and 67-5).
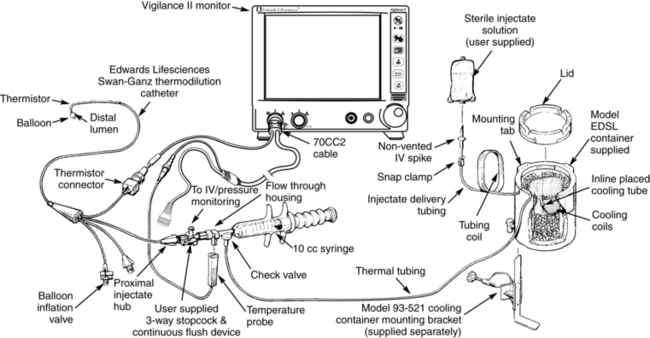
Figure 67-4 Closed injectate delivery system. Cold temperature injectate. (From Edwards Lifesciences, LLC, Irvine, CA.)
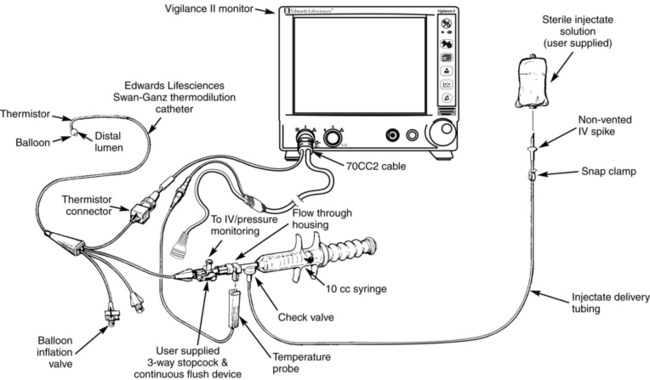
Figure 67-5 Closed injectate delivery system. Room temperature injectate. (From Edwards Lifesciences, LLC, Irvine, CA.)
• The CCO method proceeds as follows:
 CO can be obtained with a heat-exchange CO catheter. This catheter has a membrane that allows for heat to exchange with blood in the right atrium. Continuous measurement of CO can be performed without the need for injected fluid.
 The PA catheter with CCO capability contains a 10-cm thermal filament located close to the injection port (15 to 25 cm from the tip of the catheter, near the proximal lumen port). When a PA catheter is properly placed, the thermal filament section of the catheter is located in the right ventricle. This filament emits a pulsed low heat energy signal in a 30- to 60-second pseudorandom binary (on/off) sequence,2 which allows blood to be heated and the heat signal adequately processed over time as blood passes through the ventricle. A bedside computer constructs thermodilution curves detected from the pseudorandom heat impulses and measures CO automatically. The computer screen displays digital readings updated every 30 to 60 seconds, reflecting the average CO of the preceding 3 to 6 minutes. The CCO eliminates the need for fluid boluses, reduces contamination risk, and provides a continuous CO trend.1,2,29
 Because the CCO computer constantly displays and frequently updates the CO, treatment decisions can be expedited. Derived hemodynamic calculations (e.g., cardiac index and systemic vascular resistance) can be obtained with greater frequency, thereby providing up-to-time information in assessment of response to therapies that affect hemodynamics.1
• CCO has been compared with TDCO, transesophageal Doppler scan technique, and aortic transpulmonary technique to determine its precision. Study results all show small bias, limits of agreement, and 95% confidence limits, reflecting that CCO provides accurate measurement of CO and is a reliable method.1,2,6,21,29,36,48
• Adequate mixing of blood and indicator (heat) is necessary for accurate CCO measurements. Conditions that prevent appropriate mixing or directional flow of the indicator or blood include intracardiac shunts or tricuspid regurgitation.
• The CCO method is based on the same physiologic principle as the TDCO method (indicator-dilution technique). The TDCO method uses a bolus of injectate as the indicator for measurement of CO. The CCO method uses heat signals produced by the thermal filament as the indicator. The CCO computer provides a time-averaged rather than instantaneous CO reading. CCO values are influenced by the same principles as TDCO.
• The heated thermal filament has a temperature limit to a maximum of 44°C (111.2° F). When calibrated by the manufacturer, CCO computers produce reliable calculations within a temperature range of 30°C to 40°C (86° F to 104° F) or 31° C to 43° C (87.8° F to 109.4° F). An error message appears if the temperature in the PA is out of range.
• Infusions through proximal lumens should be limited to maintenance of patency of the lumen. Concomitant infusions through the proximal lumen can theoretically affect CCO measurements by altering the pulmonary artery temperature. Studies have shown that such infusions can cause variations in TDCO measurements.18,45 To date, no published data describing the effect of concurrent central line infusions on the accuracy of CCO measurements are available, but large infusions of fluid are discouraged.8,15
• Because bolus injections are not needed with the CCO method, the prevalence of user error is theoretically reduced.14
• The CCO catheter can be used to obtain both CCO and TDCO measurements.
• The CCO does not reflect acute changes in CO values because the updated value on the monitor display is an average of 3 to 6 minutes of data. A delay of approximately 10 or more minutes to detect a change of 1 L/min in CO may occur. When monitoring a patient with an unstable condition that is being aggressively treated with medication or other therapies, one should be aware of the delay in data displayed.
EQUIPMENT


PATIENT AND FAMILY EDUCATION
• Explain the procedure for CO and the reason for its measurement. Include expectations related to sensations during the procedure (the patient should not experience pain or discomfort).  Rationale: Explanation decreases patient and family anxiety. Preparatory information of sensations decreases patient fear of the impending procedure.
• Explain the monitoring equipment involved, the frequency of measurements, and the goals of therapy.  Rationale: Explanation encourages the patient and family to ask questions and voice specific concerns about the procedure.
• Explain any potential variations in temperature the patient may or may not experience if a cold injectate is used.  Rationale: This explanation acknowledges the varying physical responses to the injectate and the possible perception of cold solution and may decrease anxiety associated with the procedure.
PATIENT ASSESSMENT AND PREPARATION
Patient Assessment
• Assess the patient’s history of medication therapy, including medication allergies, recent bolus therapies, and current medication regime.  Rationale: Medications can influence CO measurements.
• Assess the patient’s medical history for the presence of coronary artery disease, valvular heart disease, and left or right ventricular dysfunction.  Rationale: Medical history provides baseline information regarding cardiovascular performance.
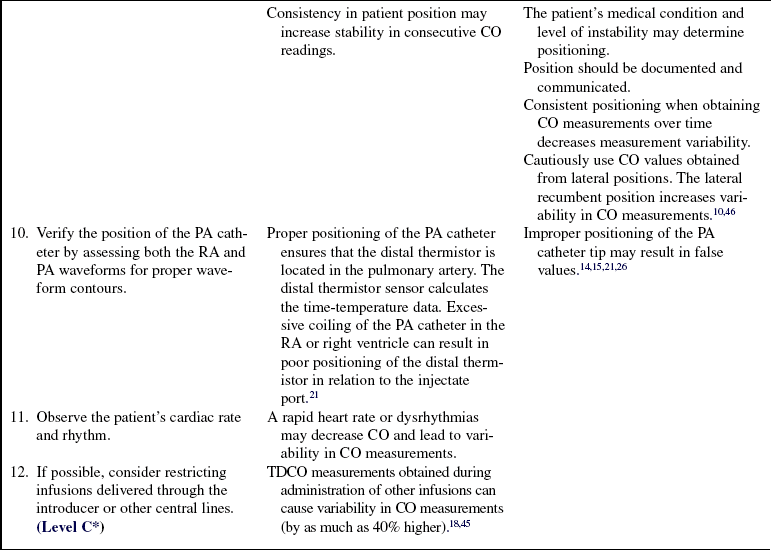
• Assess current intracardiac pressures and PAP, RAP, and PAOP waveforms.  Rationale: This assessment ensures the PA catheter is positioned properly with a free-floating thermistor sensor and provides useful information about the presence and severity of mitral and tricuspid valve regurgitation.
• Assess the patient’s vital signs, fluid balance, heart and lung sounds, skin color, temperature, mentation, peripheral pulses, cardiac rate and rhythm, and hemodynamic values. In patients with advanced systolic heart failure, assess for pulsus alternans (alternating strong and weak pulses).  Rationale: Clinical information provides data regarding blood flow and tissue perfusion. Abnormalities can influence the variability of CO measurements.
Patient Preparation
• Verify correct patient with two identifiers.  Rationale: Prior to performing a procedure, the nurse should ensure the correct identification of the patient for the intended intervention.
• Ensure that the patient and family understand preprocedural teaching. Answer questions as they arise, and reinforce information as needed.  Rationale: Understanding of previously taught information is evaluated and reinforced.
• Assist the patient to the supine position.  Rationale: CO measurements are most accurate in the supine position.
References
![]() 1. Albert, NM, Spear, B, Hammell, J. Agreement and clinical utility of two techniques for measuring cardiac output in patients with low cardiac output. Am J Crit Care. 1999; 8:464–474.
1. Albert, NM, Spear, B, Hammell, J. Agreement and clinical utility of two techniques for measuring cardiac output in patients with low cardiac output. Am J Crit Care. 1999; 8:464–474.
![]() 2. Baillard, C, et al, Haemodynamic measurements (continuous cardiac output and systemic vascular resistance) in critically ill patients. transesophageal Doppler versus continuous thermodilution. Anaesth Intensive Care 1999; 27:33–37.
2. Baillard, C, et al, Haemodynamic measurements (continuous cardiac output and systemic vascular resistance) in critically ill patients. transesophageal Doppler versus continuous thermodilution. Anaesth Intensive Care 1999; 27:33–37.
![]() 3. Balik, M, Pachl, J, Hendl, J. Effect of the degree of tricuspid regurgitation on cardiac output measurements by -thermodilution. Intensive Care Med. 2002; 28:1117–1121.
3. Balik, M, Pachl, J, Hendl, J. Effect of the degree of tricuspid regurgitation on cardiac output measurements by -thermodilution. Intensive Care Med. 2002; 28:1117–1121.
![]() 4. Berthelsen, PG, et al, Thermodilution cardiac output. cold vs. room temperature injectate and the importance of measuring the injectate temperature in the right atrium. Acta Anaesthesiol Scand 2002; 46:1103–1110.
4. Berthelsen, PG, et al, Thermodilution cardiac output. cold vs. room temperature injectate and the importance of measuring the injectate temperature in the right atrium. Acta Anaesthesiol Scand 2002; 46:1103–1110.
![]() 5. Bilfinger, TV, Lin, CY, Anagnostopoulos, CE. In vitro determination of accuracy of cardiac output measurement by thermal dilution. J Surg Res. 1982; 33:409–414.
5. Bilfinger, TV, Lin, CY, Anagnostopoulos, CE. In vitro determination of accuracy of cardiac output measurement by thermal dilution. J Surg Res. 1982; 33:409–414.
![]() 6. Boldt, J, et al. Is continuous cardiac output measurement using thermodilution reliable in the critically ill patient. Crit Care Med. 1994; 22:1913–1918.
6. Boldt, J, et al. Is continuous cardiac output measurement using thermodilution reliable in the critically ill patient. Crit Care Med. 1994; 22:1913–1918.
![]() 7. Bourdillon, PDV, Fineberg, N. Comparison of iced and room-temperature injectate for thermodilution cardiac output. Cathet Cardiovasc Diagn. 1989; 17:116–120.
7. Bourdillon, PDV, Fineberg, N. Comparison of iced and room-temperature injectate for thermodilution cardiac output. Cathet Cardiovasc Diagn. 1989; 17:116–120.
![]() 8. Bridges, EJ. Hemodynamic monitoring. In: Woods SL, et al, eds. Cardiac nursing. ed 5. Philadelphia: JB Lippincott Williams & Wilkins; 2005:478–526.
8. Bridges, EJ. Hemodynamic monitoring. In: Woods SL, et al, eds. Cardiac nursing. ed 5. Philadelphia: JB Lippincott Williams & Wilkins; 2005:478–526.
![]() 9. Daily, EK, Mersch, J, Thermodilution cardiac outputs using room and ice temperature injectate. comparison with the FICK method. Heart Lung 1987; 16:294–300.
9. Daily, EK, Mersch, J, Thermodilution cardiac outputs using room and ice temperature injectate. comparison with the FICK method. Heart Lung 1987; 16:294–300.
![]() 10. Doering, L, Dracup, K. Comparisons of cardiac output in supine and lateral positions. Nurs Res. 1988; 37:114–118.
10. Doering, L, Dracup, K. Comparisons of cardiac output in supine and lateral positions. Nurs Res. 1988; 37:114–118.
![]() 11. Driscoll, A, et al. The effect of patient position on the reproducibility of cardiac output measurements. Heart Lung. 1995; 24:38–44.
11. Driscoll, A, et al. The effect of patient position on the reproducibility of cardiac output measurements. Heart Lung. 1995; 24:38–44.
![]() 12. Elkayam, U, et al, Cardiac output by thermodilution technique. effect of injectate’s volume and temperature on accuracy and reproducibility in the critically ill. Chest 1983; 84:418–422.
12. Elkayam, U, et al, Cardiac output by thermodilution technique. effect of injectate’s volume and temperature on accuracy and reproducibility in the critically ill. Chest 1983; 84:418–422.
![]() 13. Enghof, E, Sjogren, S. Thermal dilution for measurement of cardiac output in the pulmonary artery catheter in man in relation to choice of indicator volume and injection time. Ups J Med Sci. 1973; 78:33–37.
13. Enghof, E, Sjogren, S. Thermal dilution for measurement of cardiac output in the pulmonary artery catheter in man in relation to choice of indicator volume and injection time. Ups J Med Sci. 1973; 78:33–37.
14. Frazier, SK, Hemodynamic monitoring Moser D, Reigel B, eds. Cardiac nursing: a companion to Braunwald’s heart disease. Philadelphia: Saunders, 2008.
![]() 15. Gawlinski, A, Protocols for practice. hemodynamic monitoring seriescardiac output monitoring,. American Association of Critical-Care Nurses, Aliso Viejo, CA, 1998.
15. Gawlinski, A, Protocols for practice. hemodynamic monitoring seriescardiac output monitoring,. American Association of Critical-Care Nurses, Aliso Viejo, CA, 1998.
![]() 16. Giuliano, KK, et al. Backrest angle and cardiac output measurement in critically ill patients. Nurs Research. 2003; 52:242–248.
16. Giuliano, KK, et al. Backrest angle and cardiac output measurement in critically ill patients. Nurs Research. 2003; 52:242–248.
![]() 17. Grap, MJ, et al, Use of backrest elevation in critical care. a pilot study. Am J Crit Care 1999; 8:495–496.
17. Grap, MJ, et al, Use of backrest elevation in critical care. a pilot study. Am J Crit Care 1999; 8:495–496.
![]() 18. Griffin, K, et al, Thermodilution cardiac output measurements during simultaneous volume infusion through the venous infusion port of the pulmonary artery catheter. J Cardiothorac Vasc Anesth 1997; 11:437–439.
18. Griffin, K, et al, Thermodilution cardiac output measurements during simultaneous volume infusion through the venous infusion port of the pulmonary artery catheter. J Cardiothorac Vasc Anesth 1997; 11:437–439.
![]() 19. Groeneveld, AB, et al. Effect of mechanical ventilatory cycle on thermodilution right ventricular volumes and cardiac output. J Appl Physiol. 2000; 89:89–96.
19. Groeneveld, AB, et al. Effect of mechanical ventilatory cycle on thermodilution right ventricular volumes and cardiac output. J Appl Physiol. 2000; 89:89–96.
![]() 20. Grose, BL, Wood, SL, Laurent, DJ. Effect of backrest position on cardiac output measured by the thermodilution method in acutely ill patients. Heart Lung. 1981; 10:661–665.
20. Grose, BL, Wood, SL, Laurent, DJ. Effect of backrest position on cardiac output measured by the thermodilution method in acutely ill patients. Heart Lung. 1981; 10:661–665.
![]() 21. Kalassian, KG, Raffin, TA, The technique of thermodilution cardiac output measurements. J Crit Illness 1996; 11 :249–256.
21. Kalassian, KG, Raffin, TA, The technique of thermodilution cardiac output measurements. J Crit Illness 1996; 11 :249–256.
![]() 22. Kiely, M, Byers, LA, Greenwood, R, Thermodilution measurement of cardiac output in patients with low output. room temperature versus iced injectate. Am J Crit Care 1998; 7:436–438.
22. Kiely, M, Byers, LA, Greenwood, R, Thermodilution measurement of cardiac output in patients with low output. room temperature versus iced injectate. Am J Crit Care 1998; 7:436–438.
![]() 23. Kleven, M. Effect of backrest position on thermodilution cardiac output in critically ill patients receiving mechanical ventilation with positive end-expiratory pressure. Heart Lung. 1984; 13:303–304.
23. Kleven, M. Effect of backrest position on thermodilution cardiac output in critically ill patients receiving mechanical ventilation with positive end-expiratory pressure. Heart Lung. 1984; 13:303–304.
![]() 24. Lehmann, KG, Platt, MS. Improved accuracy and precision of thermodilution cardiac output measurement using a dual thermistor catheter system. J Am Coll Cardiol. 1999; 33:883–891.
24. Lehmann, KG, Platt, MS. Improved accuracy and precision of thermodilution cardiac output measurement using a dual thermistor catheter system. J Am Coll Cardiol. 1999; 33:883–891.
![]() 25. Levett, JM, Replogle, RL, Thermodilution cardiac output. a critical analysis and review of the literature. J Surg Res 1979; 27:392–404.
25. Levett, JM, Replogle, RL, Thermodilution cardiac output. a critical analysis and review of the literature. J Surg Res 1979; 27:392–404.
![]() 26. Loveys, BJ, Woods, SL. Current recommendations for thermodilution cardiac output measurement. Progress Cardiovasc Nurs. 1986; 1:24–32.
26. Loveys, BJ, Woods, SL. Current recommendations for thermodilution cardiac output measurement. Progress Cardiovasc Nurs. 1986; 1:24–32.
![]() 27. Marcum, J, et al. A comparison of varying injectate volumes in determining thermodilution cardiac output in critically ill postsurgical patients. Am J Crit Care. 1995; 2:262.
27. Marcum, J, et al. A comparison of varying injectate volumes in determining thermodilution cardiac output in critically ill postsurgical patients. Am J Crit Care. 1995; 2:262.
![]() 28. McCloy, K, Leung, S, Beldon, J. Effects of injectate volume on thermodilution measurements of cardiac output in patients with low ventricular ejection fraction. Am J Crit Care. 1999; 8:86–92.
28. McCloy, K, Leung, S, Beldon, J. Effects of injectate volume on thermodilution measurements of cardiac output in patients with low ventricular ejection fraction. Am J Crit Care. 1999; 8:86–92.
![]() 29. Medin, DL, et al. Validation of continuous thermodilution cardiac output in critically ill patients with analysis of systematic errors. J Crit Care. 1998; 13:184–189.
29. Medin, DL, et al. Validation of continuous thermodilution cardiac output in critically ill patients with analysis of systematic errors. J Crit Care. 1998; 13:184–189.
![]() 30. Mihaljevic, T, et al, Continuous versus bolus thermodilution cardiac output measurement. a comparative study. Crit Care Med 1995; 23:944–949.
30. Mihaljevic, T, et al, Continuous versus bolus thermodilution cardiac output measurement. a comparative study. Crit Care Med 1995; 23:944–949.
![]() 31. Nelson, LD, Martinez, OV, Anderson, HB. Incidence of microbial colonization in open versus closed delivery systems for thermodilution injectate. Crit Care Med. 1986; 14:291–293.
31. Nelson, LD, Martinez, OV, Anderson, HB. Incidence of microbial colonization in open versus closed delivery systems for thermodilution injectate. Crit Care Med. 1986; 14:291–293.
![]() 32. Nishikawa, R, Dohi, S, Slowing of heart rate during cardiac output measurement by thermodilution . Anesthesiology . 1982; 57:538–539.
32. Nishikawa, R, Dohi, S, Slowing of heart rate during cardiac output measurement by thermodilution . Anesthesiology . 1982; 57:538–539.
![]() 33. Pearl, RG, et al. Effect of injectate volume and temperature on thermodilution cardiac output determination. Anesth. 1986; 64:798–801.
33. Pearl, RG, et al. Effect of injectate volume and temperature on thermodilution cardiac output determination. Anesth. 1986; 64:798–801.
![]() 34. Plachetka, JR, et al. Comparison of two closed systems for thermodilution cardiac output. Crit Care Med. 1981; 9:487–489.
34. Plachetka, JR, et al. Comparison of two closed systems for thermodilution cardiac output. Crit Care Med. 1981; 9:487–489.
![]() 35. Riedinger, MS, Shellock, FG, Swan, HJ. Reading pulmonary artery and pulmonary capillary wedge pressure waveforms with respiratory variations. Heart Lung. 1981; 10:675–678.
35. Riedinger, MS, Shellock, FG, Swan, HJ. Reading pulmonary artery and pulmonary capillary wedge pressure waveforms with respiratory variations. Heart Lung. 1981; 10:675–678.
![]() 36. Rocca, GD, et al, Continuous and intermittent cardiac output measurement. pulmonary artery catheter versus aortic transpulmonary technique. Br J Anaesth 2002; 88:350–356.
36. Rocca, GD, et al, Continuous and intermittent cardiac output measurement. pulmonary artery catheter versus aortic transpulmonary technique. Br J Anaesth 2002; 88:350–356.
![]() 37. Rodig, G, et al. Intraoperative evaluation of a continuous versus intermittent bolus thermodilution technique of cardiac output measurement in cardiac surgical patients. Eur J Anesthesiol. 1998; 15:196–201.
37. Rodig, G, et al. Intraoperative evaluation of a continuous versus intermittent bolus thermodilution technique of cardiac output measurement in cardiac surgical patients. Eur J Anesthesiol. 1998; 15:196–201.
![]() 38. Shellock, FG, Riedinger, MS. Reproducibility and accuracy of using room-temperature vs ice-temperature injectate for thermodiltion cardiac output determination. Heart Lung. 1983; 12:175–176.
38. Shellock, FG, Riedinger, MS. Reproducibility and accuracy of using room-temperature vs ice-temperature injectate for thermodiltion cardiac output determination. Heart Lung. 1983; 12:175–176.
![]() 39. Shellock, FG, et al, Thermodilution cardiac output determination in hypothermic postcardiac surgery patients. room vs. ice temperature injectate. Crit Care Med 1983; 11 :668–670.
39. Shellock, FG, et al, Thermodilution cardiac output determination in hypothermic postcardiac surgery patients. room vs. ice temperature injectate. Crit Care Med 1983; 11 :668–670.
![]() 40. Snyder, JV, Powner, DJ. Effects of mechanical ventilation on the measurement of cardiac output by thermodilution. Crit Care Med. 1982; 10:677–682.
40. Snyder, JV, Powner, DJ. Effects of mechanical ventilation on the measurement of cardiac output by thermodilution. Crit Care Med. 1982; 10:677–682.
![]() 41. Stevens, JH, et al. Thermodilution cardiac output measurement:effects of the respiratory cycle on its reproducibility. JAMA. 1985; 253:2440–2442.
41. Stevens, JH, et al. Thermodilution cardiac output measurement:effects of the respiratory cycle on its reproducibility. JAMA. 1985; 253:2440–2442.
![]() 42. Todd, MM, Atrial fibrillation induced by right atrial injection of cold fluid during thermodilution cardiac output determination. a case report. Anesthesiology 1983; 59:253–255.
42. Todd, MM, Atrial fibrillation induced by right atrial injection of cold fluid during thermodilution cardiac output determination. a case report. Anesthesiology 1983; 59:253–255.
![]() 43. Wallace, DC, Winslow, EH. Effects of iced and room-temperature injectate on cardiac output measurements in critically ill patients with low and high cardiac outputs. Heart Lung. 1993; 22:55–63.
43. Wallace, DC, Winslow, EH. Effects of iced and room-temperature injectate on cardiac output measurements in critically ill patients with low and high cardiac outputs. Heart Lung. 1993; 22:55–63.
![]() 44. Weil, MH. Measurement of cardiac output. Crit Care Med. 1977; 5:117–119.
44. Weil, MH. Measurement of cardiac output. Crit Care Med. 1977; 5:117–119.
![]() 45. Wetzel, RC, Latson, TW. Major errors in thermodilution cardiac output measurement during rapid volume infusion. Anesthesiology. 1985; 62:684–687.
45. Wetzel, RC, Latson, TW. Major errors in thermodilution cardiac output measurement during rapid volume infusion. Anesthesiology. 1985; 62:684–687.
![]() 46. Whitman, GR, Howaniak, DL, Verga, TS. Comparison of cardiac output measurements in 20-degree right- and left-lateral recumbent positions. Heart Lung. 1982; 11:256–257.
46. Whitman, GR, Howaniak, DL, Verga, TS. Comparison of cardiac output measurements in 20-degree right- and left-lateral recumbent positions. Heart Lung. 1982; 11:256–257.
![]() 47. Wilson, AE, et al. Effect of backrest position on hemodynamic and right ventricular measurements in critically ill adults. Am J Crit Care. 1996; 5:264–270.
47. Wilson, AE, et al. Effect of backrest position on hemodynamic and right ventricular measurements in critically ill adults. Am J Crit Care. 1996; 5:264–270.
![]() 48. Woods, S, Osguthorpe, S. Cardiac output determination. AACN Clin Issue Crit Care Nurs. 1993; 4(1):81–97.
48. Woods, S, Osguthorpe, S. Cardiac output determination. AACN Clin Issue Crit Care Nurs. 1993; 4(1):81–97.
Ahrens, T. Hemodynamic monitoring. Crit Care Nurs Clin North Am. 1999; 11:19–31.
Brandsteller, RD, et al, Swan-Ganz catheter. misconceptions, pitfalls, and incomplete user knowledgean identified trilogy in need of correction. Heart Lung J Acute Crit Care 1998; 27:218–222.
Burchell, SA, et al. Evaluation of a continuous cardiac output and mixed venous oxygen saturation catheter in critically ill surgical patients. Crit Care Med. 1997; 25:388–391.
Ditmyer, CE, Shively, M, Burns, CB. Comparison of continuous with intermittent bolus thermodilution cardiac output measurement. Am J Crit Care. 1995; 4:460–465.
Headley, JM. Strategies to optimize the cardiorespiratory status of the critically ill. AACN Clin Issues Crit Care Nurs. 1995; 6:121–134.
Headley, J, Invasive hemodynamic monitoring. physiological principles and clinical application. Edwards Lifesciences, Irvine, CA, 2002.
Hollenberg, SM, Hoyt, J. Pulmonary artery catheters in cardiovascular disease. N Horiz. 1997; 5:207–213.
Jansen, JR, et al. Mean cardiac output by thermodilution with a single controlled injection. Crit Care Med. 2001; 29:1868–1873.
Sandham, JD, et al. A randomized, controlled trial of the use of pulmonary-artery catheters in high-risk surgical patients. N Engl J Med. 2003; 348:5–14.
Taylor, RW. Controversies in pulmonary artery catheterization. N Horiz. 1997; 5:1–296.
