Indices of Oxygenation
PREREQUISITE NURSING KNOWLEDGE
• Arterial partial pressure of oxygen (PaO2) is primarily determined by the concentration of inspired oxygen and the amount of carbon dioxide in the alveolus.1–3
• In healthy lungs, alveolar oxygen diffuses rapidly into the pulmonary capillaries, and arterial oxygenation approximates that of the alveolus. The normal alveolar-arterial oxygen difference (A-aDO2) in a patient breathing 21% oxygen is 10 to 20 mm Hg (i.e., PAO2 [100], PaO2 [80]). When 100% oxygen is inspired, the normal gradient is 50 to 70 mm Hg.1–3
• Trends in alveolar-arterial (A-a) gradient are evaluated most accurately when the PAO2 and PaO2 are measured on room air or after inspiration of 100% oxygen for 15 minutes.1–3
• Other clinical indices of oxygenation that are commonly used include the PaO2😛AO2 (a:A) ratio and the ratio of PaO2 to fraction of inspired oxygen (FiO2; P:F). These indices all are relatively easy to use and are helpful in estimates of trends in hypoxemia.1,4,5
• The advantage of the a:A and P:F ratios is that a more constant value, despite changes in FiO2, can be calculated. A normal a:A ratio is 0.8 to 1. The smaller the number, the higher the degree of shunt. The normal value for P:F ratio is greater than 300. A smaller P:F ratio reflects a higher degree of shunt. A P:F ratio of 200 to 300 is used to define acute lung injury (ALI), whereas a P:F ratio of less than 200 is associated with acute respiratory distress syndrome (ARDS).4,5
• In patients with shunt (perfusion to unventilated lung units), venous blood is shunted past the closed alveoli without becoming oxygenated. Although PaO2 may be “normal” because of an increase in FiO2, a shunt exists. The A-a gradient increases. A-a gradient is considered a useful, albeit crude, clinical estimate of shunt. The A-a gradient value is helpful to trend changes in oxygenation status, the effect of therapies and other interventions.
• Concepts related to shunt and the refractory nature of shunt to increasing FiO2 are inherent in all the indices (i.e., shunt is not responsive to oxygen). Although other reasons for hypoxemia exist in addition to shunt (i.e., hypoventilation on room air, diffusion block, ventilation to perfusion [V/Q] mismatch), the indices are generally most often used in the most severe pulmonary conditions that affect oxygenation. In these conditions (e.g., ARDS), quantification of the degree of shunt is helpful to trend the progress of the disease, determine the efficacy of therapies, and aid in prognosis.1–3,5
• The gold standard for quantifying shunt is calculation of shunted blood flow–to–total blood flow ratio (Qs:Qt). Calculation of Qs:Qt requires analysis of a mixed venous sample (from a pulmonary artery catheter or venous oxygen saturation [SVO2] catheter); calculations of A-a gradient, PaO2:FiO2, and PaO2😛AO2 do not. The measurement of Qs:Qt is detailed in Procedure 34.2,3,5
• Accurate interpretation of arterial and mixed venous blood gas analysis is necessary.
PATIENT AND FAMILY EDUCATION
• Verify correct patient with two identifiers.  Rationale: Prior to performing a procedure, the nurse should ensure the correct identification of the patient for the intended intervention.
• Inform the patient and family about the patient’s oxygenation status and the rationale and implications for changes in therapy. If the patient or a family member requests specific information about oxygenation studies, explain the rationale for measurement.  Rationale: Most patients and families are less concerned with the diagnostic and therapeutic details and more concerned with how the patient’s condition is progressing overall.
PATIENT ASSESSMENT AND PREPARATION
Patient Assessment
• Assess for signs and symptoms of inadequate oxygenation:
 Decreasing arterial oxygen tension


 Intercostal and suprasternal retractions


 Rationale: Clinical findings may indicate problems with oxygenation.
• Determine arterial oxygen tension or saturation.  Rationale: Hypoxemia is confirmed by a decreasing PaO2 or saturation of arterial oxygen (SaO2) or an absolute PaO2 of less than 60 mm Hg or absolute SaO2 of less than 90%.
• Determine trend of indices and therapies.  Rationale: Improvement or deterioration can be quantified by monitoring indices over time.
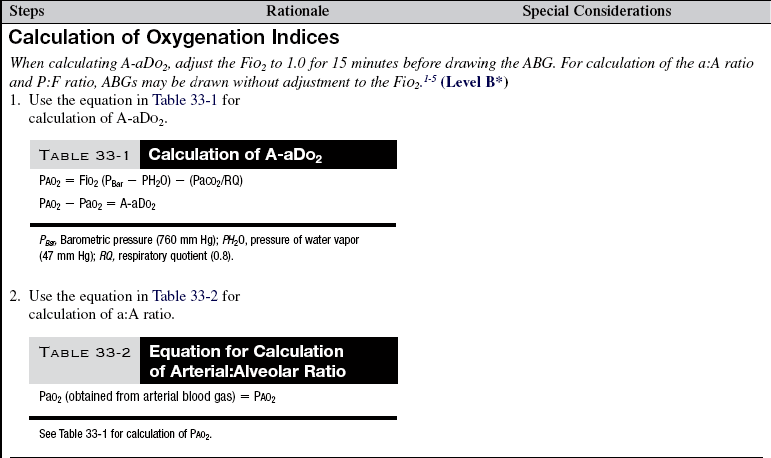
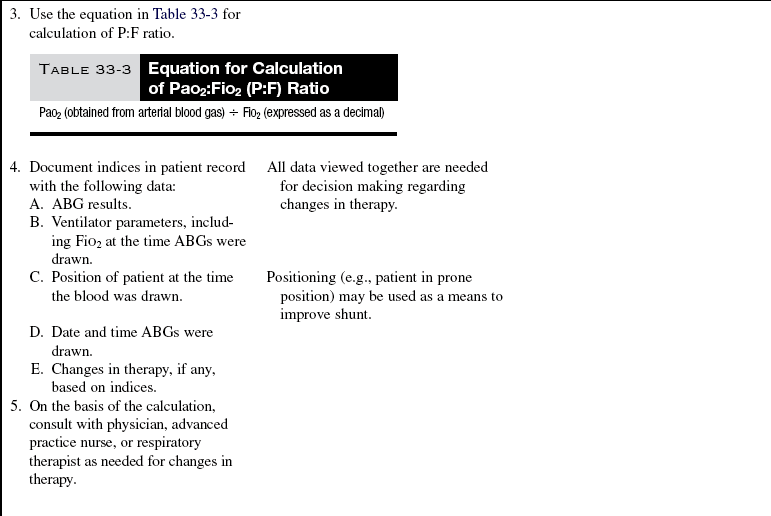
Table 33-1
PAO2 = FiO2 (PBar − PH2O) − (PaCO2/RQ)
PAO2 − PaO2 = A-aDO2
Table 33-2
Equation for Calculation of Arterial:Alveolar Ratio
PaO2 (obtained from arterial blood gas) = PAO2
Table 33-3
Equation for Calculation of PaO2:FiO2 (P:F) Ratio
PaO2 (obtained from arterial blood gas) ÷ FiO2 (expressed as a decimal)
References
1. West, JB, Respiratory physiology. the essentials. ed 8. Lippincott Williams & Wilkins, Baltimore, 2008.
2. West, JB, Pulmonary pathophysiology. the essentials. Lippincott Williams & Wilkins, Baltimore, 2008.
![]() 3. Covelli, HD, Nessan, VJ, Tuttle, WK. Oxygen derived -variables in acute respiratory failure. Crit Care Med. 1983; 11:646–649.
3. Covelli, HD, Nessan, VJ, Tuttle, WK. Oxygen derived -variables in acute respiratory failure. Crit Care Med. 1983; 11:646–649.
![]() 4. The Acute Respiratory Distress Syndrome Network. Ventilation with lower tidal volumes as compared with traditional tidal volumes for acute lung injury and the acute respiratory distress syndrome. N Engl J Med. 2000; 342:1301–1307.
4. The Acute Respiratory Distress Syndrome Network. Ventilation with lower tidal volumes as compared with traditional tidal volumes for acute lung injury and the acute respiratory distress syndrome. N Engl J Med. 2000; 342:1301–1307.
5. Theodore, AC, Jefferson, LS. Oxygenation and mechanisms of hypoxemia. UpToDate Online. 16(2), 2008.
