[level-membership-for-anesthesiology-category]
CHAPTER 27. Hemodynamic Monitoring
Maureen Mclaughlin
OBJECTIVES
At the conclusion of this chapter, the reader will be able to:
1. Identify surgical patients who may benefit from hemodynamic monitoring based on their risk of oxygen supply and demand imbalance.
2. Define the physiological variables affecting cardiac function and link their interactions.
3. Describe the principles of pressure monitoring and strategies to optimize accuracy.
4. Determine the indications, risks, complications, and perioperative considerations for specific hemodynamic monitoring, including arterial pressure, central venous pressure, and pulmonary artery pressure (PAP).
5. Identify normal waveform configurations for the preceding catheters.
6. List the various ports of the pulmonary artery (PA) catheter, and list their functions.
7. Identify normal and calculated hemodynamic pressures, and link the clinical significance of alterations in surgical patients.
8. Compare and contrast the bolus and continuous cardiac output techniques for thermodilution cardiac output, and determine the significance of altered cardiac output states in surgical patients.
9. Define the function of mixed venous oxygen saturation (Sv o2) and identify causes for variances.
I. GOALS OF HEMODYNAMIC MONITORING
A. Aid in the diagnosis of critically ill patients
B. Evaluate therapies such as vasoactive medications, fluid boluses, mechanical ventilation, etc.
C. Assess and optimize the balance between oxygen supply and demand.
II. INDICATIONS
A. Benefit and patient acuity must outweigh cost and potential for complications.
B. High risk and/or hemodynamically unstable surgical patients
III. PHYSIOLOGICAL VARIABLES AFFECTING CARDIAC FUNCTION
A. Cardiac output (CO)
1. Definition: amount of blood ejected from the ventricles measured in liters per minute
2. CO = Stroke volume (SV) × Heart rate (HR)
3. Influences on CO
a. HR
b. SV
(1) CO definition: amount of blood ejected from the ventricle with each beat
(2) Influences on SV
(a) Preload (right and left)
(i) Definition: amount of end-diastolic stretch on myocardial muscle fibers; determined by volume of blood filling the ventricle at the end of diastole
(ii) Right-sided preload: central venous pressure (CVP) or right atrial pressure (RAP)
(iii) Left-sided preload
[a] Left atrial pressure (LAP)
[b] Pulmonary artery diastolic (PAD) pressure
[c] Pulmonary artery occlusion (wedge) pressure (PAOP)
[d] Pulmonary capillary wedge pressure (PCWP)
(iv) Influences on preload
[a] Any condition that increases blood return to the heart or decreases ejection of blood from the heart. Examples:
[1] Pulmonary hypertension decreases the ability of the right ventricle (RV) to pump, thereby decreasing the ejection of blood from the RV and increasing RV preload.
[2] Fluid infusions increase circulating blood volume, thereby increasing right-sided and left-sided preload.
(b) Afterload (right and left)
(i) Definition: resistance, impedance, or pressure the ventricle must overcome to eject blood
(ii) Affected by:
[a] Volume and viscosity of the blood
[b] Size and thickness of the ventricle
[c] Tone of the vascular beds
(iii) Right-sided afterload: pulmonary vascular resistance
(iv) Left-sided afterload: systemic vascular resistance
(v) Influences on afterload: any condition that increases or decreases the pressure required for the ventricle to eject volume; conditions that would affect afterload include:
[a] Vascular resistance
[b] Valve function
[c] Increased blood viscosity
[d] Examples:
[1] Aortic stenosis would result in a narrowed outflow tract, increasing the pressure required for the left ventricle (LV) to eject blood and therefore increasing left-sided afterload.
[2] Use of a vasodilator would relax the vessel beds and increase the diameter of the vessels, decreasing the pressure required for the ventricles to eject blood and therefore decreasing afterload.
(c) Contractility
(i) Definition: inherent ability of myocardial muscle fibers to shorten and contract regardless of preload or afterload
(ii) Indirectly assessed through a calculated stroke work index
c. Atrioventricular (AV) synchrony
(1) Definition: coordinated contraction pattern between atria and ventricles
(2) Influences on AV synchrony
(a) Ischemia
(b) Infarction
(c) Conduction deficits
(d) Dysrhythmia
(3) Loss of synchrony
(a) Decreases CO
(b) Decreases blood pressure (BP)
(c) Decreases SV
(d) Increases LAP
IV. HEMODYNAMIC EVALUATION OF CARDIAC FUNCTION
A. Hemodynamic normal values (Table 27-1)
| Pressure | Value | Range |
|---|---|---|
| Right atrial pressure (RAP) | Mean | 2-6 mm Hg |
| Central venous pressure (CVP) | Mean | 3-8 cm H 2O |
| Right ventricular pressure (RVP) |
Systolic
Diastolic
|
15-30 mm Hg
0-8 mm Hg
|
| Pulmonary artery pressure (PAP) |
Systolic
Diastolic
Mean
|
15-30 mm Hg
5-15 mm Hg
10-20 mm Hg
|
| Left atrial pressure (LAP) | Mean | 8-12 mm Hg |
| Pulmonary artery occlusion pressure (PAOP) | Mean | 8-12 mm Hg |
| Pulmonary capillary wedge pressure (PCWP) | Mean | 8-12 mm Hg |
| Left ventricular end-diastolic pressure (LVEDP) | Mean | 4-12 mm Hg |
B. Hemodynamic calculations (Table 27-2)
| BP, Blood pressure; BSA, body surface area; CI, cardiac index; CO, cardiac output; CVP, central venous pressure; EDV, end-diastolic volume; HR, heart rate; MAP, mean arterial pressure; MPAP, mean pulmonary artery pressure; PAOP, pulmonary artery occlusion pressure; RAP, right atrial pressure; SI, stroke index; SV, stroke volume. | ||
| Pressure | Formula | Value |
|---|---|---|
| Mean arterial pressure | Systole + (2 × Diastole) / 3 | 70-105 mm Hg |
| Cardiac output | HR × SV | 4-8 L/min |
| Cardiac index | CO/BSA | 2.5-4.0 L/min/m 2 |
| Stroke volume | (CO/HR) × 1000 | 60-100 mL |
| Stroke index |
SV/BSA
or
CI/HR
|
30-65 mL/beat/m 2 |
| Left ventricular stroke work index | [1.36 × SI × (MAP − PAOP)] / 100 | 45-65 g-m/beat/m 2 |
| Right ventricular stroke work index | [1.36 × SI × (MPAP − RAP)] / 100 | 5-12 g-m/beat/m 2 |
| Systemic vascular resistance |
[(MAP − RAP) × 80] / CO
or
[(MAP − CVP) × 80] / CO
|
900-1400 dynes/sec/cm −5 |
| Pulmonary vascular resistance | {[RAP − (PAOP × MPAP)] × 80} / CO | <250 dynes/sec/cm −5 |
| Ejection fraction | (SV/EDV) × 100 | 55%-75% (left ventricle) |
V. LIMITATIONS OF HEMODYNAMIC MONITORING
A. Presumptions and assumptions
1. Major presumption: Pressure = Volume
a. RAP = Right ventricular end-diastolic volume = RV preload
b. PA diastolic pressure = LAP = PCWP = Left ventricular end-diastolic volume = LV preload
2. Reality
a. Relationship between pressure and volume is curvilinear.
b. Influenced by compliance or ease of distensibility of the ventricle
VI. PRINCIPLES OF PRESSURE MONITORING
A. Uses a fluid-filled tubing system with a pressure transducer
B. Mechanical impulse transmitted from tip of catheter through the fluid to the transducer chip
1. Impulse converted from a mechanical signal to an electronic signal
2. Signal sent to the monitor through the transducer cable to be displayed as an electronic waveform on the monitor screen
C. Optimizing accuracy of pressures
1. Remove bubbles from tubing when priming.
2. Use a continuous flush system with 300 mm Hg pressure to infusion bag.
3. Eliminate tubing extensions if possible (use only nondistensible extension tubing).
4. Level and zero transducer when indicated.
a. Position patient in 0° to 45° supine position (position of tolerance).
b. Place air and fluid interface at the phlebostatic axis (fourth intercostal space, midchest) and open to air while activating the zero function on your bedside monitor (Figure 27-1).
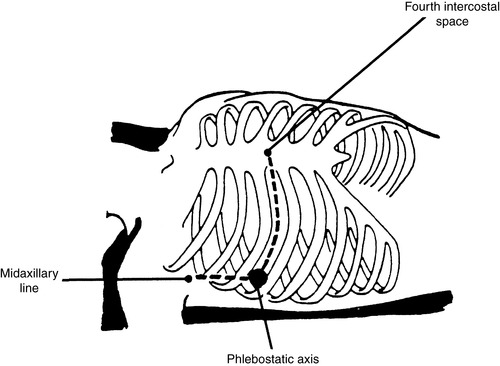 |
| FIGURE 27-1 ▪
Phlebostatic axis is an approximation of right atrium and is used for leveling air interface port of pressure monitoring system.
(Adapted from Dresden DG: Core curriculum for perianesthesia nursing practice, ed 4, Philadelphia, 1999, Saunders.)
|
c. Transducer must be leveled and zeroed to atmospheric pressure initially and whenever the tubing is disconnected or changed.
(1) Standards of care for the leveling and zeroing of pressure lines vary per institution.
(2) Common practice is to level and zero the transducer:
(a) At change of shift
(b) After a change in patient’s position
(c) Whenever there is a significant change in filling pressures
d. Allow 5 minutes after position changes before measuring pressures.
e. Maintain as much consistency in patient’s position as possible for measurement.
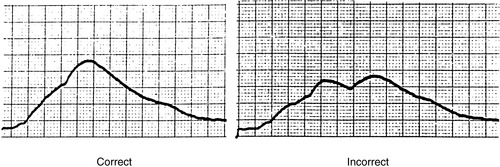
5. Square wave test: evaluates dynamic response of pressure monitoring system (Figure 27-2)
a. Perform by:
(1) Activate the fast flush device for 1 to 2 seconds.
(2) Immediately evaluate configuration on the monitor.
(3) Waveform will be replaced with a square wave.
b. Analyze waveform.
(1) Optimally damped waveform
(a) One to two oscillations
(b) No peaks >1 mm apart
(c) Straight vertical downstroke back to baseline
(2) Overly damped system
(a) Slurred upstroke with downstroke
(b) No oscillations after the square wave
(c) Treat
(i) Check for occlusion.
(ii) Ensure nonpliable tubing being used.
(iii) Make sure all components securely connected.
(3) Underdamped
(a) Numerous oscillations above and below baseline after activation of flush
(b) Overestimation of systolic pressure
(c) Underestimation of diastolic pressure
(d) Treatment
(i) Restrict catheter and tubing length to 4 feet.
(ii) Remove all air bubbles.
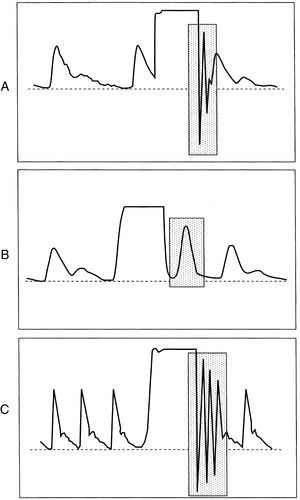 |
| FIGURE 27-2 ▪
Square wave test using the fast-flush valve. A, Normal test and accurate waveform. B, Overdamped. C, Underdamped.
(From Dennison RD: Pass CCRN!, ed 3, St Louis, 2007, Mosby.)
|
VII. DIRECT INTRA-ARTERIAL PRESSURE MONITORING (ARTERIAL LINE)
A. Allows for continuous observation of the patient’s systemic BP with calculation of the mean arterial pressure
B. Provides more accuracy than use of a sphygmomanometer during low CO states
C. Under optimal conditions, an indirect BP, such as an auscultated BP or one obtained via an automated BP cuff, will underestimate the systolic pressure and overestimate the diastolic pressure by about 5 mm Hg.
D. Indications
1. Cardiopulmonary bypass
2. Procedures with potential for wide variation in BP intraoperatively or postoperatively, such as:
a. Carotid endarterectomy
b. Aortic aneurysm resection
c. Craniotomies
3. Need for strict BP control
4. Multiple arterial blood gases or laboratory tests
5. Titration of vasoactive medications (particularly those with an extremely short half-life, e.g., nitroprusside)
E. Placement
1. Site needs to be accessible and easily compressible in case of bleeding.
2. Radial artery (most common)
a. Allen test should be performed before insertion to assess for collateral ulnar flow.
(1) Procedure
(a) Compress both ulnar and radial arteries on one extremity while the patient repeatedly makes a tight fist to squeeze blood out of the hand.
(b) Release compression of the ulnar artery to observe for reperfusion indicated by a blush of color.
(c) Color should return within 5 to 10 seconds or radial artery should not be cannulated.
(d) Test can be repeated on radial artery for evidence of brisk perfusion.
3. Femoral
a. Most commonly seen with patients undergoing cardiac catheterization laboratory procedures
4. Other sites may include axillary, brachial, or pedal artery (uncommon).
F. Arterial pressure waveform; two components (Figure 27-3)
1. Anacrotic limb: a sharp uprise in the tracing that reflects the outflow of blood from the ventricle and into the arterial system
2. Dicrotic limb: descending of the pressure tracing that reflects the decrease in pressure during diastole. Beginning of diastole is seen as a small notch on the descending limb of the tracing caused by the closing of the aortic valve and is commonly called the dicrotic notch.
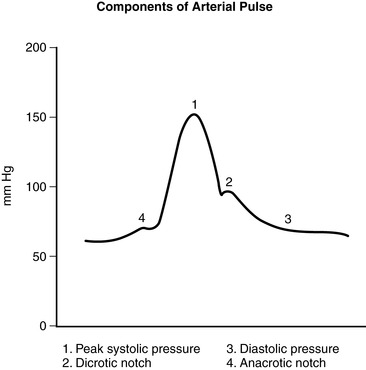 |
| FIGURE 27-3 ▪
Arterial pressure waveform.
(From Headley JM: Invasive hemodynamic monitoring: Physiological principles and clinical applications, Irvine, CA, 1996, Edwards Lifesciences.)
|
G. Risks and complications
1. Vascular compromise (e.g., thrombus, spasm)
2. Disconnection: hemorrhage
3. Accidental injection of drugs or air
4. Infection
5. Nerve damage
H. Preoperative considerations
1. Patient teaching
a. Potential for extremity immobilization
b. Instructed to inform nurse if experience coldness, numbness, pain, or tingling
c. May require arterial line postoperatively
I. Intraoperative and postoperative considerations
1. Maintain aseptic technique.
a. Keep dead-end caps on stopcock ports.
b. Occlusive dressing
c. Sterile technique maintained during insertion
2. Monitor pressures continuously (an arterial line should always be connected to the transducer cable and waveform displayed on the monitor).
3. Assess and document appearance of site, immobilization, capillary refill of extremity, temperature and color of extremity.
4. Document a monitor strip of the waveform in the chart to display waveform appearance.
5. Always use luerlock connections.
6. Level and zero transducer per standard of care or institutional policy.
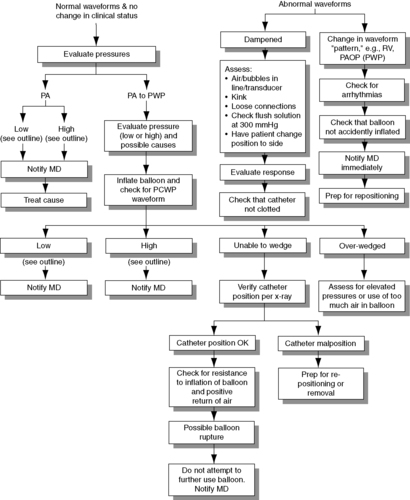
7. Troubleshoot variances in the patient waveform.
a. Always assess patient first when troubleshooting a dampened waveform (Figure 27-4).
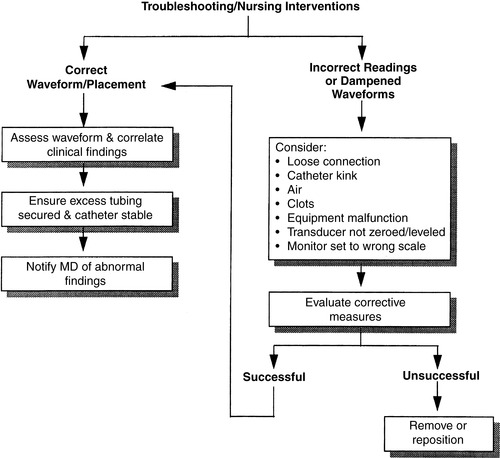 |
| FIGURE 27-4 ▪
Arterial pressure monitoring: Troubleshooting and nursing interventions.
(From Dresden DG: Core curriculum for perianesthesia nursing practice, ed 4, Philadelphia, 1999, Saunders.)
|
VIII. CVP MONITORING
A. Indications
1. Rapid infusion of fluid or blood
2. Inability to cannulate peripheral veins
3. Administration of vesicants or drugs that may cause peripheral sclerosis
a. Potassium
b. Epinephrine
c. Norepinephrine
d. Chemotherapeutic agents
e. Aminoglycosides
4. Administration of hyperalimentation
5. Access site for temporary transvenous pacing.
6. Assessment of fluid status
7. Assess right-sided heart function.
8. Aspiration of air emboli in neurosurgical patients who are positioned intraoperatively in the upright position and thus at risk for an air embolism
B. Placement
1. Single-lumen or multilumen catheter placed in a major vein leading to superior vena cava
a. Subclavian
b. Internal jugular
c. Femoral
d. Brachial
2. Side port of PA catheter introducer and proximal port of PA catheter can also be used as a central venous access.
a. Chest x-ray should always be performed:
(1) To confirm correct placement
(2) To rule out complications such as a pneumothorax
C. Risks and complications
1. Carotid artery puncture with insertion (internal jugular approach)
2. Infection
3. Thrombus or embolic event
4. Air embolism
5. Pneumothorax from insertion (increased risk with subclavian approach)
6. Hematoma formation
7. Arrhythmias
8. Vascular erosion
9. Improper placement, including heart chamber
D. Preoperative considerations
1. Patient teaching
a. Information regarding catheter insertion should be:
(1) Included in preoperative teaching
(2) Part of informed consent
b. Differentiate whether lines will be placed in preoperative holding or after induction of anesthesia.
E. Intraoperative and postoperative considerations
a. Obtain an order for a postinsertion chest x-ray to verify line placement and rule out complications, such as a pneumothorax, malposition.
b. Maintain a sterile dressing per hospital standards for central lines.
c. Intermittent readings via a water manometer are measured in centimeters of water (mm Hg x 1.36 = cm H 2O) (2-8 cm H 2O).
d. Continuous readings via pressure transducer are measured in millimeters of mercury (2-6 mm Hg).
e. Must be leveled and zeroed to phlebostatic axis
f. Assessment and documentation
(1) Pressures per unit standard
(2) Location of catheter and appearance of site if visualized
(3) Strip recording of waveform in chart (Figure 27-5)
(a) Record waveform on two-channel recorder concurrently with electrocardiogram to identify individual waves of waveform to ensure accuracy with increased respiratory artifact.
(i) Zero reference point is the phlebostatic axis.
(ii) CVP values should not be recorded when patient is in a lateral position.
(b) CVP waveform reflects the respiratory variation.
(i) Record pressure at mean of the “a” wave at end-exhalation (see Figure 27-8).
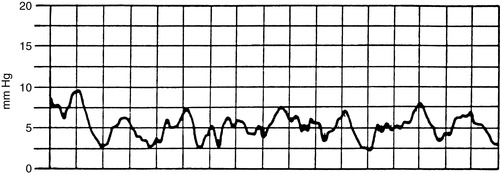 |
| FIGURE 27-5 ▪
Central venous pressure monitoring: Waveform.
(From Dresden DG: Core curriculum for perianesthesia nursing practice, ed 4, Philadelphia, 1999, Saunders.)
|
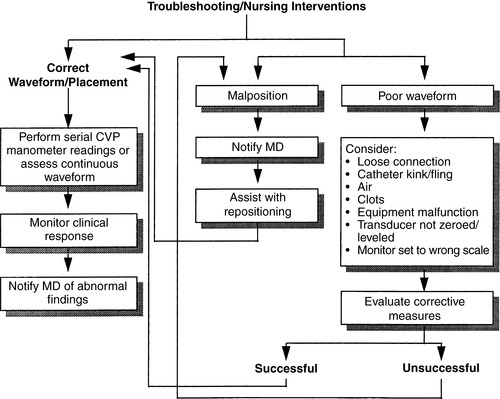 |
| FIGURE 27-6 ▪
Central venous pressure monitoring: Troubleshooting and nursing interventions.
(From Dresden DG: Core curriculum for perianesthesia nursing practice, ed 4, Philadelphia, 1999, Saunders.)
|
(c) Mean CVP value may be falsely elevated when the patient is receiving positive end-expiratory pressure (PEEP) during mechanical ventilation.
(d) CVP values should be examined for trends and incorporated into other assessment data such as:
(i) Urine output
(ii) Heart rate
(iii) BP
g. Troubleshooting and nursing interventions (Figure 27-6)
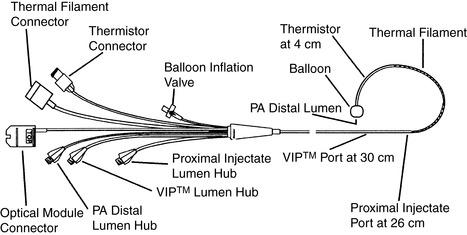 |
| FIGURE 27-7 ▪
Swan-Ganz CCO/Sv o2/VIP TD catheter. CCO, Continuous cardiac output; Svo2, mixed venous oxygen saturation; VIP, venous infusion port; TD, thermodilution.
(Reprinted with permission from Edwards Lifesciences, Irvine, CA.)
|
IX. PAP MONITORING (PA CATHETER)
A. Indications
1. Intraoperative patient risk that exceeds the cost and risk of complications of insertion of the catheter
a. Perioperative monitoring of surgical patients with major preexisting systems dysfunction undergoing extensive operative procedures
(1) Thoracic or abdominal aortic aneurysms
(2) Coronary artery bypass and valvular replacement
(3) Extensive intra-abdominal resections
(4) Prolonged orthopedic procedures
(5) Thoracic or abdominal aortic aneurysms
(6) Patients with a history of congestive heart failure, cardiomyopathy
2. Shock of severe or prolonged duration or unknown etiology
3. Assessment of cardiovascular function and response to therapy in patients with complicated, unstable cardiovascular disease unresponsive to conventional therapy
4. Use of mechanical assist devices (i.e., intra-aortic balloon pump, ventricular assist device)
5. Titration of cardioactive and vasoactive drugs
B. Placement
1. Internal jugular and subclavian veins are preferred, but may also be placed in the brachial or femoral vein.
C. Catheter types: all catheters are flow-directed thermal dilutional PA catheters.
1. Most common type of PA catheter contains several ports (detailed below) that allow for measurement of PAP, PAOP (PCWP), and CVP or RAP. The catheter allows for bolus injection of solutions for measuring CO and contains a thermistor port that measures core body temperature.
2. Most PA catheters also contain an additional “VIP” port that can be used for the infusion of medications and intravenous fluids.
3. Paceport—has an RV port for insertion of a ventricular pacing wire
4. Sv o2—has a fiberoptic tip that measures continuous mixed venous oxygen saturation in the PA
5. Continuous cardiac output (CCO)—measures CCO by emitting random thermal energy impulses (Edwards Lifesciences)
6. CCOmbo—measures continuous CO plus Sv o2 (Edwards Lifesciences) (Figure 27-7)
7. CCOmbo V—measures RV end-diastolic volume and RV ejection fraction as well as CCO and S vo2 (Edwards Lifesciences)
D. Ports and measurements
1. Distal port
a. Exits at tip of catheter in PA
b. Measures PAP (systolic/diastolic/mean), PAOP (PCWP), Sv o2 (see Table 27-1)
(1) PAP systolic: 15 to 30 mm Hg
(2) Diastolic: 5 to 15 mm Hg
(3) Mean: 10 to 20 mm Hg
(4) PAOP (PCWP) : 8 to 12 mm Hg
(5) Sv o2: 60% to 80%
c. Infuse only pressurized saline or heparinized saline at 300 mm Hg.
(1) Refer to institutional policy regarding the use of heparin-containing products as a flush solution.
d. Indirectly reflects right-sided (systolic) and left-sided (diastolic) heart pressures in the absence of lung or valvular disease
e. May be used to sample mixed venous blood
2. Proximal port
a. Exits in RA usually at 26- to 30-cm mark
b. Measures RAP (CVP) and used for infusion of injectate with bolus CO
c. RAP: 2-6 mm Hg
d. May be used for infusion, although blood products and vasoactive drugs are discouraged
e. Aspirate blood before performing bolus CO if using for infusion of medications (to prevent bolus of drugs).
3. Balloon port or gate valve
a. To obtain PAOP (PCWP), inflate balloon with up to 1.5 mL of air for the 7.0- to 8.0-French catheters. (Generally, balloon volume printed on hub of catheter)
b. Balloon should wedge with 1.25 to 1.5 mL of air. Allow syringe to passively refill, then lock gate valve when not in use.
c. Do not inflate for more than 15 seconds or two respiratory cycles.
d. Read pressure at end-expiration.
e. PAOP (PCWP) should be within 2 to 5 mm Hg of PAD pressure.
f. Indirectly reflects LAP and left ventricular end-diastolic pressure
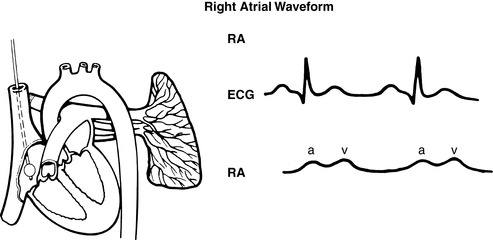 |
| FIGURE 27-8 ▪
Pulmonary artery waveforms: Right atrial waveform.
(From Headley JM: Invasive hemodynamic monitoring: Physiological principles and clinical applications, Irvine, CA, 1996, Edwards Lifesciences.)
|
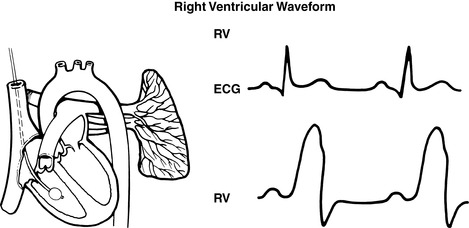 |
| FIGURE 27-9 ▪
Pulmonary artery waveforms: Right ventricular waveform.
(From Headley JM: Invasive hemodynamic monitoring: Physiological principles and clinical applications, Irvine, CA, 1996, Edwards Lifesciences.)
|
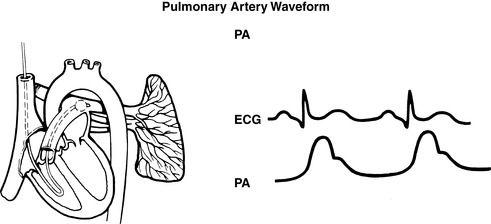 |
| FIGURE 27-10 ▪
Pulmonary artery catheter waveforms: Pulmonary artery.
(From Headley JM: Invasive hemodynamic monitoring: Physiological principles and clinical applications, Irvine, CA, 1996, Edwards Lifesciences.)
|
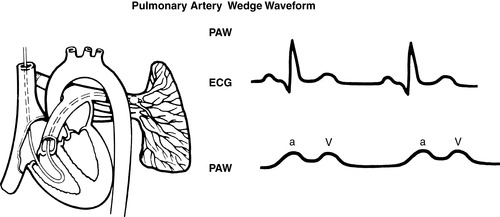 |
| FIGURE 27-11 ▪
Pulmonary artery catheter waveforms: Pulmonary capillary wedge.
(From Headley JM: Invasive hemodynamic monitoring: Physiological principles and clinical applications, Irvine, CA, 1996, Edwards Lifesciences.)
|
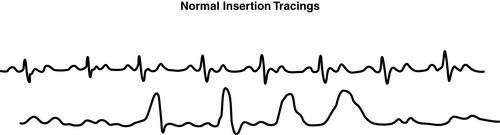 |
| FIGURE 27-12 ▪
Pulmonary artery catheter waveforms: Normal insertion tracings.
(From Headley JM: Invasive hemodynamic monitoring: Physiological principles and clinical applications, Irvine, CA, 1996, Edwards Lifesciences.)
|
F. Risks and complications
1. Carries the same risks and complications of an arterial line and central venous line plus some unique to the PA catheter
a. Pulmonary artery rupture
b. Perforation of RV
c. Dysrhythmias
d. Electrical microshocks
e. Catheter migration backward to RV or forward to wedged position
f. Catheter knotting or kinking
g. Balloon rupture
h. Overwedging or failure to unwedge, resulting in pulmonary necrosis or infarction
G. Preoperative considerations
1. Must have informed consent involving explanation of risks, alternatives, and benefits
2. Patient teaching
a. Important to stress this is a diagnostic aid and does not assist the heart or lungs
b. Generally inserted after initiation of anesthesia
H. Intraoperative and postoperative considerations
1. Ensure accuracy of measurements.
a. Visualize waveform for normal configuration.
b. Pressure readings
(1) Measure all readings at end-expiration.
(2) PCWP readings reflect respiratory variations and should be based on the mean of the “a” wave (see FIGURE 27-8 ▪, FIGURE 27-9 ▪, FIGURE 27-10 ▪, FIGURE 27-11 ▪ and FIGURE 27-12 ▪).
c. Level air-water interface stopcock to the phlebostatic axis and zero transducer to atmospheric pressure initially and if tubing is opened to air or changed.
d. Read pressures with the patient in the same position for consistency.
(1) Most accurate is supine position with head of bed less than 45° upright.
e. Maintain catheter in position where balloon wedges with 1.25 to 1.5 mL of air, and document placement (depth) to ensure consistency.
f. Remove all air bubbles from tubing and maintain distal infusion fluids at 300 mm Hg.
g. Discourage use of extra extension tubing.
2. Assessment and documentation
a. Measure and document hemodynamic parameters including calculated parameters upon insertion and per standard (initiation of vasoactive therapy or change in patient condition).
b. Assess site for bleeding or hematoma. Mark and document size of hematoma in centimeters.
c. Note and document centimeter markings at hub of catheter. (Thin markings are 10 cm, and thick markings are 50 cm.)
3. Apply sterile central line dressing per hospital standard.
a. Avoid taping across sheath covering external catheter.
4. Maintain aseptic technique: cover stopcock ports with sterile dead-ender caps.
I. PA catheter insertion in post anesthesia care unit
1. Assemble all equipment (e.g., insertion supplies, catheter, monitor cables).
2. Obtain consent if required.
3. Instruct patient.
4. Assess need for sedation.
5. Prime or flush transducer tubing to expel all air bubbles (must be done before insertion).
6. Maintain sterile technique.
7. Monitor patient during procedure (BP, oxygen saturation as measured by pulse oximetry [Sp o2], rhythm).
8. Be prepared to inflate balloon.
9. Cover site and obtain hemodynamic parameters quickly postinsertion.
10. Obtain chest x-ray after insertion to verify placement and rule out complications.
11. Document pressures and waveform strips in chart.
J. Clinical significance of alterations in hemodynamic pressures in surgical patients
1. Elevated PAP (systolic) may be caused by any condition that directly or indirectly increases pressure and/or volume in the lungs or RV.
a. Pulmonary hypertension
b. LV failure and mitral stenosis
c. Constrictive pericarditis
d. Cardiac tamponade
e. Congestive heart failure
f. Atrial or ventricular septal defects
2. Elevated PAP (diastolic) may be caused by any condition that directly or indirectly increases pressure and/or volume in the lungs or LV.
a. LV failure
b. Mitral stenosis
c. Pulmonary hypertension
d. Left-to-right shunts
3. Elevated PAOP(PCWP) may be caused by any condition that increases pressure and/or volume in LV.
a. Constrictive pericarditis
b. LV failure
c. Mitral valve dysfunction
d. Aortic insufficiency
e. Fluid overload
f. Ischemia
4. Decreased PAP and PAOP (PCWP) may be caused by any condition or situation that decreases volume and/or pressure in the LV or decreases the pressure the LV must generate to open the aortic valve.
a. Hypotension
b. Hypovolemia
c. Vasodilating drugs causing decreased afterload
X. THERMODILUTION CO
A. Method that applies indicator dilution principles, using temperature change as the indicator
B. Direct measurement that indirectly reflects myocardial performance
1. Bolus method
a. Known amount of saline (generally 5 or 10 mL) injected into RA via proximal port
b. This cooler solution mixes with and cools surrounding blood, and temperature is measured in PA by a thermistor bead on tip of catheter.
c. Computer plots change in temperature on a time-temperature curve.
2. CCO
a. Special PA catheter contains a thermal filament between 14 and 25 cm from distal tip.
b. This filament emits a random thermal signal, resulting in a minute elevation in blood temperature downstream.
c. Computer continuously cross-correlates the input signal with the temperature change to produce a thermodilution washout curve.
d. Computer continuously updates CO data.
3. Continuous-wave Doppler probe
a. Noninvasively measures thoracic electrical impedance via external electrodes placed on neck and chest wall
C. CO is 4 to 8 L/min; cardiac index (CI) is 2.5 to 4 L/min/m 2.
D. Indications
1. Used for determination of calculated hemodynamic variables
2. Perioperative fluid management
3. Assessment of intra-aortic balloon pump therapy and PEEP
4. Evaluation of effects of cardioactive drugs
5. Indication for myocardial ischemia and infarction
E. Techniques for accurate assessment
1. Use accurately measured injectate volume (generally 10 mL for adults and 5 mL for children).
2. Iced or room temperature (19° C to 24° C) injectate can be used.
3. Room temperature saline may be used for most patients.
4. In patients with either a high or low CO, use of cold injectate may improve results.
5. Ice-cold saline for injection if hyperthermic or in a high-flow state
6. Use correct computation constant (packaged with catheter and based on catheter size and amount and temperature of injectate).
7. Inject rapidly and smoothly within 4 seconds; wait 60 seconds between injections.
8. Average three to five injections, preferably with results within 10% of each other.
9. Perform injection during the same time in the respiratory cycle (end-expiration).
10. Visibly inspect CO curve for technique and accuracy (Figures 27-13 and 27-14).
 |
| FIGURE 27-13 ▪
Bolus cardiac output waveform.
(From Dresden DG: Core curriculum for perianesthesia nursing practice, ed 4, Philadelphia, 1999, Saunders.)
|
 |
| FIGURE 27-14 ▪
Troubleshooting and nursing interventions in thermodilution cardiac output.
|
F. Significance of CO and CI in surgical patients
1. Low CO states
a. Decreased or increased preload
(1) Hypovolemia or hypervolemia
(2) Hemorrhage
(3) Tamponade
b. Decreased myocardial contractility
(1) Drugs
(2) Myocardial infarction
(3) LV failure
(4) Dysrhythmias
c. Decreased or increased afterload
(1) Body temperature
(2) Valvular dysfunction
(3) Vasoconstriction or dilation
(4) Vasoactive drugs
(5) Loss of vascular neural control—spinal anesthesia
2. High CO states
a. Hypervolemia
b. Decreased afterload
(1) Vasodilatation
(2) Sepsis
c. High metabolic states
(1) Hyperthyroid states
(2) Pregnancy
XI. Sv o2
A. Global measures of end result of both oxygen delivery and consumption at the tissue level
B. Oxygen leftovers (hemoglobin [Hb] saturation) measured via a fiberoptic filament on distal tip of PA catheter by using reflective spectrophotometry
C. Sensitive, early indicator of oxygenation imbalances but not specific as to whether cause associated with an oxygen supply or demand problem
D. Necessary measurement for calculation of oxygen delivery (Da o2) and oxygen consumption (V o2) (Figure 27-15 and Table 27-3)
1. Da o2 definition: amount of oxygen delivered to tissues measured in milliliters per minute (normal ≈1000 mL/min)
2. V o2 definition: amount of oxygen consumed by tissues measured in milliliters per minute (normal ≈250 mL/min)
3. Oxygen demand definition: amount of oxygen necessary to maintain aerobic metabolism
a. A dynamic variable dependent on the process of metabolism
b. Impossible to measure
c. We can indirectly support oxygen demand by assessing and optimizing Da o2 and V o2.
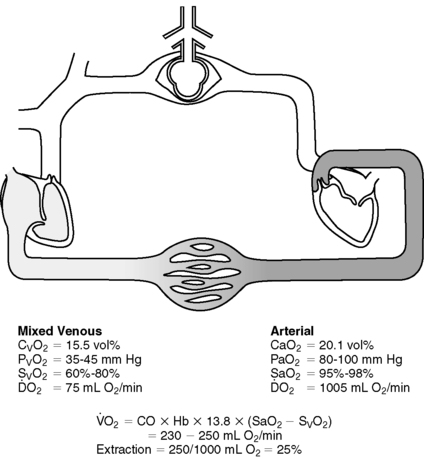 |
| FIGURE 27-15 ▪
Normal oxygenation values.
(From Understanding continuous mixed venous oxygen saturation [Sv o2]: Monitoring with the Swan-Ganz® Oximetry TD System, ed 2, Irvine, CA, 1996, Edwards Lifesciences.)
|
| A-V, Arteriovenous; CI, cardiac index; CO, cardiac output; CO 2, carbon dioxide; Hgb, hemoglobin; Pv o2, partial oxygen pressure in mixed venous blood. | ||
| Parameters | Equations | Normal Range |
|---|---|---|
| Partial pressure of arterial oxygen (Pao 2) | 80-100 mm Hg | |
| Partial pressure of arterial CO 2 (Paco 2) | 35-45 mm Hg | |
| Bicarbonate (HCO 3) | 22-26mEq/L | |
| pH | 7.35-7.45 | |
| Arterial oxygen saturation (Sa o2) | >95% | |
| Mixed venous saturation (Sv o2) | 60%-80% | |
| Arterial oxygen content (Ca o2) | (0.0138 × Hgb × Sao 2) + (0.0031 × Pa o2) | 17-20 mL/dL |
| Venous oxygen content (Cv o2) | (0.0138 × Hgb × Svo 2) + (0.0031 × Pv o2) | 12-15 mL/dL |
| A-V oxygen content difference (C[a-v] o2) | Ca o2 − Cv o2 | 4-6 mL/dL |
| Oxygen delivery (Da o2) | Ca o2 × CO × 10 | 900-1100 mL/min |
| Oxygen delivery index (Da o2i) | Ca o2 × CI × 10 | 550-650 mL/min/m 2 |
| Oxygen consumption (V o2) | (C[a-v] o2) × CO × 10 | 200-300 mL/min |
| Oxygen consumption index (V o2I) | (C[a-v] o2) × CI × 10 | 110-160 mL/min/m 2 |
| Oxygen extraction ratio ( o2ER) | ([Ca o2 − Cv o2]/Ca o2) × 100 | 22%-30% |
| Oxygen extraction index ( o2EI) | (Sa o2 − S vo2)/Sa o2 × 100 | 20%-275% |
E. Normal Sv o2 is 60% to 80%.
F. Decreased Sv o2 (<60%) a result of:
1. Decreased oxygen delivered
a. Lowered CO, lowered Hb level, or lowered Sa o2
2. Increased oxygen consumption
a. Increased cellular oxygen demand
(1) Fever
(2) Pain
(3) Shivering
(4) Seizing
(5) Injury
(6) Increased intracranial pressure
G. Increased Sv o2 (>80%) a result of:
1. Increased oxygen delivery
a. Increased CO
(1) Hyperthyroidism
(2) Pregnancy
(3) Sepsis
(4) Vasodilatation
2. Decreased oxygen consumption
a. Hypothermia,
b. Anesthesia
c. Neuromuscular paralysis
3. Faulty calibration of equipment
H. Techniques for ensuring accuracy
1. Calibrate PA catheter
a. Before insertion (in vitro)
b. After insertion (in vivo)
c. Daily
d. With major changes in Hb (2 g or more)
2. Withdraw blood sample for in vivo calibration from distal port very slowly (over 1-2 minutes) after discarding waste.
3. Maintain PA catheter position that requires 1.25 to 1.5 mL of air to wedge balloon.
4. Maintain PA catheter position for a signal quality index of 1 to 2.
I. Clinical application of Sv o2
1. Assess for causes of a 5% change in Sv o2 that does not return to baseline within 5 minutes.
2. Differentiate between alterations in oxygen supply versus demand.
BIBLIOGRAPHY
1. Chulay, M.; Gawlinski, A., Protocols for practice: Hemodynamic monitoring. ( 2001)American Association of Critical-Care Nurses, Aliso Viejo, CA.
2. Darovic, G., Hemodynamic monitoring: Invasive and noninvasive clinical application. ed 3 ( 2002)WB Saunders, Philadelphia.
3. Dennison, R., Pass CCRN!. ed 3 ( 2007)Mosby, St Louis.
4. Druding, M.C., Integrating hemodynamic monitoring and physical assessment, Dimens Crit Care Nurs 19 (4) ( 2000) 25–30.
5. Lichtenthal, P.R., Quick guide to cardiopulmonary care. ( 1998)Edwards Lifesciences, Irvine, CA.
6. McMillen, P., Calculating medication dosages, Crit Care Nurse 20 (6) ( 2000) 17–19.
7. Nagelhout, J.; Plaus, K., Nurse anesthesia. ed 4 ( 2010)Saunders, St Louis.
8. Rice, W.P.; Fernandez, E.G.; Jrog, D.; et al., A comparison of hydrostatic leveling methods in invasive pressure monitoring, Crit Care Nurse 20 (6) ( 2000) 20–30.
9. Springhouse, Critical care nursing made incredibly easy. ( 2004)Lippincott Williams & Wilkins, Philadelphia.
10. Springhouse, Hemodynamic monitoring made incredibly visual. ( 2007)Lippin-cott Williams & Wilkins, Philadelphia.
[/level-membership-for-anesthesiology-category][not-level-membership-for-anesthesiology-category]
CHAPTER 27. Hemodynamic Monitoring
Maureen Mclaughlin
OBJECTIVES
At the conclusion of this chapter, the reader will be able to:
1. Identify surgical patients who may benefit from hemodynamic monitoring based on their risk of oxygen supply and demand imbalance.
2. Define the physiological variables affecting cardiac function and link their interactions.
3. Describe the principles of pressure monitoring and strategies to optimize accuracy.
4. Determine the indications, risks, complications, and perioperative considerations for specific hemodynamic monitoring, including arterial pressure, central venous pressure, and pulmonary artery pressure (PAP).
5. Identify normal waveform configurations for the preceding catheters.
6. List the various ports of the pulmonary artery (PA) catheter, and list their functions.
7. Identify normal and calculated hemodynamic pressures, and link the clinical significance of alterations in surgical patients.
8. Compare and contrast the bolus and continuous cardiac output techniques for thermodilution cardiac output, and determine the significance of altered cardiac output states in surgical patients.
9. Define the function of mixed venous oxygen saturation (Sv o2) and identify causes for variances.
I. GOALS OF HEMODYNAMIC MONITORING
A. Aid in the diagnosis of critically ill patients
B. Evaluate therapies such as vasoactive medications, fluid boluses, mechanical ventilation, etc.
C. Assess and optimize the balance between oxygen supply and demand.
II. INDICATIONS
A. Benefit and patient acuity must outweigh cost and potential for complications.
B. High risk and/or hemodynamically unstable surgical patients
III. PHYSIOLOGICAL VARIABLES AFFECTING CARDIAC FUNCTION
A. Cardiac output (CO)
1. Definition: amount of blood ejected from the ventricles measured in liters per minute
2. CO = Stroke volume (SV) × Heart rate (HR)
3. Influences on CO
a. HR
b. SV
(1) CO definition: amount of blood ejected from the ventricle with each beat
(2) Influences on SV
(a) Preload (right and left)
(i) Definition: amount of end-diastolic stretch on myocardial muscle fibers; determined by volume of blood filling the ventricle at the end of diastole
(ii) Right-sided preload: central venous pressure (CVP) or right atrial pressure (RAP)
(iii) Left-sided preload
[a] Left atrial pressure (LAP)
[b] Pulmonary artery diastolic (PAD) pressure
[c] Pulmonary artery occlusion (wedge) pressure (PAOP)
[d] Pulmonary capillary wedge pressure (PCWP)
(iv) Influences on preload
[a] Any condition that increases blood return to the heart or decreases ejection of blood from the heart. Examples:
[1] Pulmonary hypertension decreases the ability of the right ventricle (RV) to pump, thereby decreasing the ejection of blood from the RV and increasing RV preload.
[2] Fluid infusions increase circulating blood volume, thereby increasing right-sided and left-sided preload.
(b) Afterload (right and left)
(i) Definition: resistance, impedance, or pressure the ventricle must overcome to eject blood
(ii) Affected by:
[a] Volume and viscosity of the blood
[b] Size and thickness of the ventricle
[c] Tone of the vascular beds
(iii) Right-sided afterload: pulmonary vascular resistance
(iv) Left-sided afterload: systemic vascular resistance
(v) Influences on afterload: any condition that increases or decreases the pressure required for the ventricle to eject volume; conditions that would affect afterload include:
[a] Vascular resistance
[b] Valve function
[c] Increased blood viscosity
[d] Examples:
[1] Aortic stenosis would result in a narrowed outflow tract, increasing the pressure required for the left ventricle (LV) to eject blood and therefore increasing left-sided afterload.
[2] Use of a vasodilator would relax the vessel beds and increase the diameter of the vessels, decreasing the pressure required for the ventricles to eject blood and therefore decreasing afterload.
(c) Contractility
(i) Definition: inherent ability of myocardial muscle fibers to shorten and contract regardless of preload or afterload
(ii) Indirectly assessed through a calculated stroke work index
c. Atrioventricular (AV) synchrony
(1) Definition: coordinated contraction pattern between atria and ventricles
(2) Influences on AV synchrony
(a) Ischemia
(b) Infarction
(c) Conduction deficits
(d) Dysrhythmia
(3) Loss of synchrony
(a) Decreases CO
(b) Decreases blood pressure (BP)
(c) Decreases SV
(d) Increases LAP
IV. HEMODYNAMIC EVALUATION OF CARDIAC FUNCTION
A. Hemodynamic normal values (Table 27-1)
| Pressure | Value | Range |
|---|---|---|
| Right atrial pressure (RAP) | Mean | 2-6 mm Hg |
| Central venous pressure (CVP) | Mean | 3-8 cm H 2O |
| Right ventricular pressure (RVP) |
Systolic
Diastolic
|
15-30 mm Hg
0-8 mm Hg
|
| Pulmonary artery pressure (PAP) |
Systolic
Diastolic
Mean
|
15-30 mm Hg
5-15 mm Hg
10-20 mm Hg
|
| Left atrial pressure (LAP) | Mean | 8-12 mm Hg |
| Pulmonary artery occlusion pressure (PAOP) | Mean | 8-12 mm Hg |
| Pulmonary capillary wedge pressure (PCWP) | Mean | 8-12 mm Hg |
| Left ventricular end-diastolic pressure (LVEDP) | Mean | 4-12 mm Hg |
B. Hemodynamic calculations (Table 27-2)
| BP, Blood pressure; BSA, body surface area; CI, cardiac index; CO, cardiac output; CVP, central venous pressure; EDV, end-diastolic volume; HR, heart rate; MAP, mean arterial pressure; MPAP, mean pulmonary artery pressure; PAOP, pulmonary artery occlusion pressure; RAP, right atrial pressure; SI, stroke index; SV, stroke volume. | ||
| Pressure | Formula | Value |
|---|---|---|
| Mean arterial pressure | Systole + (2 × Diastole) / 3 | 70-105 mm Hg |
| Cardiac output | HR × SV | 4-8 L/min |
| Cardiac index | CO/BSA | 2.5-4.0 L/min/m 2 |
| Stroke volume | (CO/HR) × 1000 | 60-100 mL |
| Stroke index |
SV/BSA
or
CI/HR
|
30-65 mL/beat/m 2 |
| Left ventricular stroke work index | [1.36 × SI × (MAP − PAOP)] / 100 | 45-65 g-m/beat/m 2 |
| Right ventricular stroke work index | [1.36 × SI × (MPAP − RAP)] / 100 | 5-12 g-m/beat/m 2 |
| Systemic vascular resistance |
[(MAP − RAP) × 80] / CO
or
[(MAP − CVP) × 80] / CO
|
900-1400 dynes/sec/cm −5 |
| Pulmonary vascular resistance | {[RAP − (PAOP × MPAP)] × 80} / CO | <250 dynes/sec/cm −5 |
| Ejection fraction | (SV/EDV) × 100 | 55%-75% (left ventricle) |
V. LIMITATIONS OF HEMODYNAMIC MONITORING
A. Presumptions and assumptions
1. Major presumption: Pressure = Volume
a. RAP = Right ventricular end-diastolic volume = RV preload
b. PA diastolic pressure = LAP = PCWP = Left ventricular end-diastolic volume = LV preload
2. Reality
a. Relationship between pressure and volume is curvilinear.
b. Influenced by compliance or ease of distensibility of the ventricle
VI. PRINCIPLES OF PRESSURE MONITORING
A. Uses a fluid-filled tubing system with a pressure transducer
B. Mechanical impulse transmitted from tip of catheter through the fluid to the transducer chip
1. Impulse converted from a mechanical signal to an electronic signal
2. Signal sent to the monitor through the transducer cable to be displayed as an electronic waveform on the monitor screen
C. Optimizing accuracy of pressures
1. Remove bubbles from tubing when priming.
2. Use a continuous flush system with 300 mm Hg pressure to infusion bag.
3. Eliminate tubing extensions if possible (use only nondistensible extension tubing).
4. Level and zero transducer when indicated.
a. Position patient in 0° to 45° supine position (position of tolerance).
b. Place air and fluid interface at the phlebostatic axis (fourth intercostal space, midchest) and open to air while activating the zero function on your bedside monitor (Figure 27-1).
|
|
| FIGURE 27-1 ▪
Phlebostatic axis is an approximation of right atrium and is used for leveling air interface port of pressure monitoring system.
(Adapted from Dresden DG: Core curriculum for perianesthesia nursing practice, ed 4, Philadelphia, 1999, Saunders.)
|
c. Transducer must be leveled and zeroed to atmospheric pressure initially and whenever the tubing is disconnected or changed.
(1) Standards of care for the leveling and zeroing of pressure lines vary per institution.
(2) Common practice is to level and zero the transducer:
(a) At change of shift
(b) After a change in patient’s position
(c) Whenever there is a significant change in filling pressures
d. Allow 5 minutes after position changes before measuring pressures.
e. Maintain as much consistency in patient’s position as possible for measurement.
5. Square wave test: evaluates dynamic response of pressure monitoring system (Figure 27-2)
a. Perform by:
(1) Activate the fast flush device for 1 to 2 seconds.
(2) Immediately evaluate configuration on the monitor.
(3) Waveform will be replaced with a square wave.
b. Analyze waveform.
(1) Optimally damped waveform
(a) One to two oscillations
(b) No peaks >1 mm apart
(c) Straight vertical downstroke back to baseline
(2) Overly damped system
(a) Slurred upstroke with downstroke
(b) No oscillations after the square wave
(c) Treat
(i) Check for occlusion.
(ii) Ensure nonpliable tubing being used.
(iii) Make sure all components securely connected.
(3) Underdamped
(a) Numerous oscillations above and below baseline after activation of flush
(b) Overestimation of systolic pressure
(c) Underestimation of diastolic pressure
(d) Treatment
(i) Restrict catheter and tubing length to 4 feet.
(ii) Remove all air bubbles.
|
|
| FIGURE 27-2 ▪
Square wave test using the fast-flush valve. A, Normal test and accurate waveform. B, Overdamped. C, Underdamped.
(From Dennison RD: Pass CCRN!, ed 3, St Louis, 2007, Mosby.)
|
VII. DIRECT INTRA-ARTERIAL PRESSURE MONITORING (ARTERIAL LINE)
A. Allows for continuous observation of the patient’s systemic BP with calculation of the mean arterial pressure
B. Provides more accuracy than use of a sphygmomanometer during low CO states
C. Under optimal conditions, an indirect BP, such as an auscultated BP or one obtained via an automated BP cuff, will underestimate the systolic pressure and overestimate the diastolic pressure by about 5 mm Hg.
D. Indications
1. Cardiopulmonary bypass
2. Procedures with potential for wide variation in BP intraoperatively or postoperatively, such as:
a. Carotid endarterectomy
b. Aortic aneurysm resection
c. Craniotomies
3. Need for strict BP control
4. Multiple arterial blood gases or laboratory tests
5. Titration of vasoactive medications (particularly those with an extremely short half-life, e.g., nitroprusside)
E. Placement
1. Site needs to be accessible and easily compressible in case of bleeding.
2. Radial artery (most common)
a. Allen test should be performed before insertion to assess for collateral ulnar flow.
(1) Procedure
(a) Compress both ulnar and radial arteries on one extremity while the patient repeatedly makes a tight fist to squeeze blood out of the hand.
(b) Release compression of the ulnar artery to observe for reperfusion indicated by a blush of color.
(c) Color should return within 5 to 10 seconds or radial artery should not be cannulated.
(d) Test can be repeated on radial artery for evidence of brisk perfusion.
3. Femoral
a. Most commonly seen with patients undergoing cardiac catheterization laboratory procedures
4. Other sites may include axillary, brachial, or pedal artery (uncommon).
F. Arterial pressure waveform; two components (Figure 27-3)
1. Anacrotic limb: a sharp uprise in the tracing that reflects the outflow of blood from the ventricle and into the arterial system
2. Dicrotic limb: descending of the pressure tracing that reflects the decrease in pressure during diastole. Beginning of diastole is seen as a small notch on the descending limb of the tracing caused by the closing of the aortic valve and is commonly called the dicrotic notch.
|
|
| FIGURE 27-3 ▪
Arterial pressure waveform.
(From Headley JM: Invasive hemodynamic monitoring: Physiological principles and clinical applications, Irvine, CA, 1996, Edwards Lifesciences.)
|
G. Risks and complications
1. Vascular compromise (e.g., thrombus, spasm)
Buy Membership for Anesthesiology Category to continue reading. Learn more here
[/not-level-membership-for-anesthesiology-category]
