[level-membership-for-cardiovascular-category]
History
Comments
Medications
Comments
Current Symptoms
Comments
Physical Examination
Comments
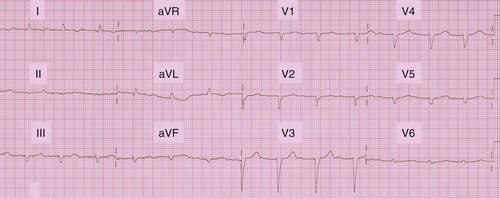
FIGURE 18-1 Baseline electrocardiogram.
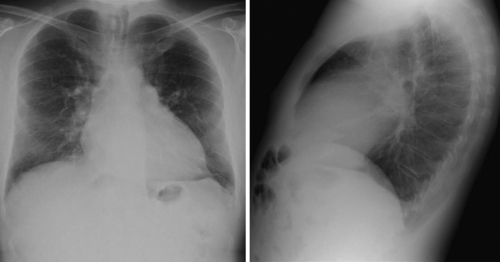
FIGURE 18-2 The cardiothoracic ratio is over 50%. Some pulmonary overloading can be observed.
Laboratory Data
Comments
Electrocardiogram
Findings
Comments
Echocardiogram
Findings
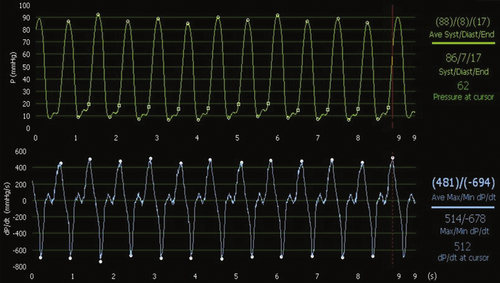
FIGURE 18-3 In spontaneous rhythm, dP/dtmax is very low (481 mm Hg/sec) with a low left ventricular systolic pressure found at 88 mm Hg.
Comments
Catheterization
Comments
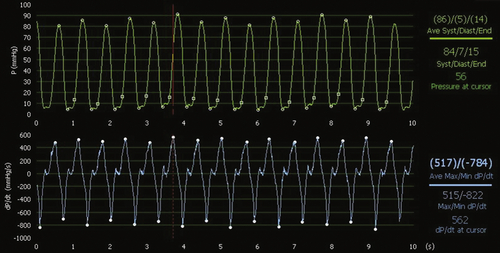
FIGURE 18-4 During atriobiventricular pacing with the endocardial left ventricular lead placed at the apex, dP/dtmax rises to 517 mm Hg/sec, without change in the left ventricular systolic pressure, but the difference is not significant.
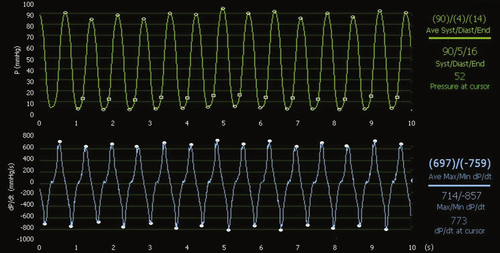
FIGURE 18-5 During atriobiventricular pacing with the endocardial left ventricular lead placed at the anterior and lateral site, dP/dtmax rises significantly to 697 mm Hg/sec, with a slight increase in left ventricular systolic pressure.
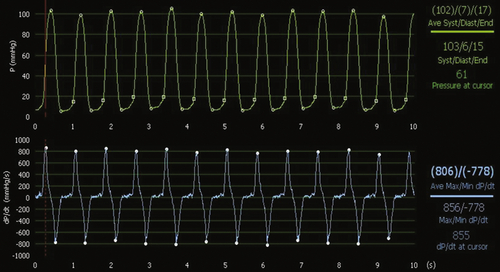
FIGURE 18-6 During atriobiventricular pacing with the left ventricular lead placed at the posterior site, left ventricular dP/dtmax rises further to 806 mm Hg and systolic pressure to 102 mm Hg. dP/dtmin is also higher than in the spontaneous condition, demonstrating faster left ventricular relaxation.
Implantation
Postoperative Radiograph
Postoperative Electrocardiogram
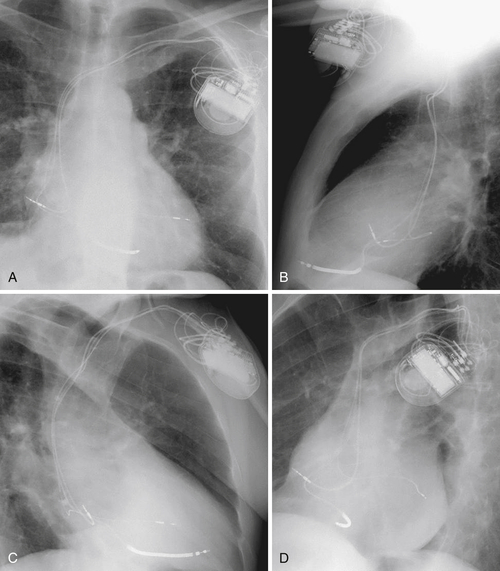
FIGURE 18-7 Postoperative chest radiographic examination showing the location of the three leads: atrial lead at the lateral wall of the right atrium, right ventricular lead at the right ventricular paraapical site, and left ventricular lead at the midposterior wall of the left ventricular endocardium. A, Anteroposterior view. B, Lateral view. C, right anterior oblique view. D, Left anterior oblique view.
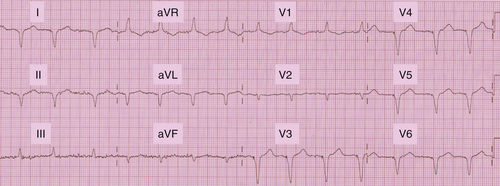
FIGURE 18-8 Postoperative electrogram recorded in DDD mode during atrio–left ventriciular pacing.
Electrical Activation Pattern
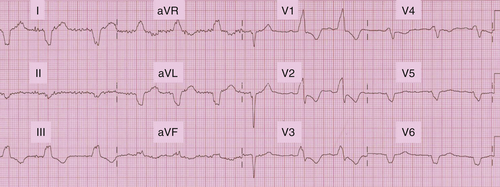
FIGURE 18-9 Postoperative electrogram recorded in DDD mode during atrial left ventricular pacing.
Outcomes
Comments
Focused Clinical Questions and Discussion Points
Question
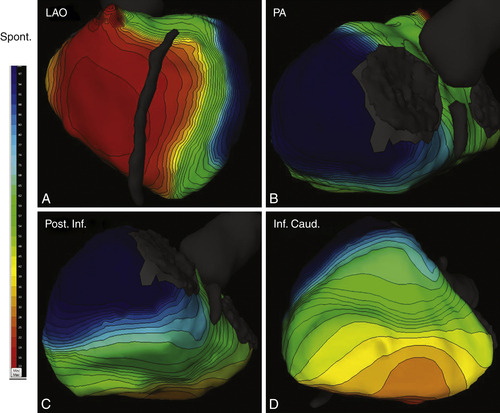
FIGURE 18-10 A, Left anterior oblique view. The right ventricle activates first, and this activation is homogeneous. The left anterior wall is rapidly activated, whereas the lateral wall is much delayed. B, Posteroanterior view. The atrioventricular valves are on the right, and the left ventricular apex is on the left. This view demonstrates the delay in activation of the lateral and posterior wall. C, A posterior and inferior view of the left ventricle (atrioventricular valves on the right, apex on the left). This view confirms the late activation of the posterior wall. The inferior wall is less delayed and activation goes fast (D).
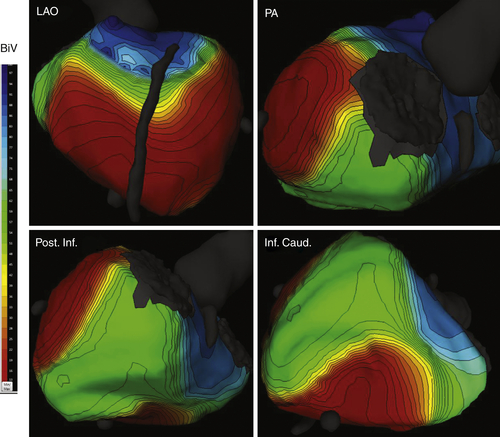
Figure 18-11 The same views as in intrinsic rhythm and same time scale. During biventricular pacing, the activation pattern is quite altered. Depolarization clearly starts from the spots of lead locations—apical right ventricular and posterior left ventricular walls. As a result, the right ventricular free wall and anterior, posterior, and some inferior left ventricular walls appear to be electrically synchronized. The posterior and inferior left ventricular wall is slightly delayed, and basal segments are the most delayed, but the concerned region is small.
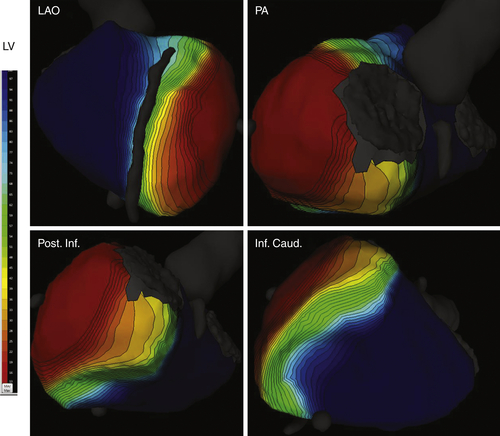
FIGURE 18-12 The same views as in intrinsic rhythm and biventricular pacing and same time scale. During left ventricular pacing only, the activation pattern is totally reversed with primodepolarization at the lateral left ventricular wall. Two lines of block appear at the anterior wall facing the septum and at the posterior and lateral wall. As a consequence, right ventricular and inferior left ventricular walls are largely delayed. The difference between mean right ventricular and mean left ventricular activations is +110 ms.
Discussion
Question
Discussion
Question
Discussion
Question
Discussion
Selected References
1. Bourassa M.G., Khairy P., Roy D. An early proof-of-concept of cardiac resynchronization therapy. World J Cardiol. 2011;3:374–376.
2. Derval N., Steendijk P., Gula L.J. et al. Optimizing hemodynamics in heart failure patients by systematic screening of left ventricular pacing sites: the lateral left ventricular wall and the coronary sinus are rarely the best sites. J Am Coll Cardiol. 2010;55:566–575.
3. Duckett S.G., Ginks M., Shetty A.K. et al. Invasive acute hemodynamic response to guide left ventricular lead implantation predicts chronic remodeling in patients undergoing cardiac resynchronization therapy. J Am Coll Cardiol. 2011;58:1128–1136.
4. McMurray J.J., Adamopoulos S., Anker S.D. et al. ESC guidelines for the diagnosis and treatment of acute and chronic heart failure 2012: The Task Force for the Diagnosis and Treatment of Acute and Chronic Heart Failure 2012 of the European Society of Cardiology. Developed in collaboration with the Heart Failure Association (HFA) of the ESC. Eur J Heart Fail. 2012;14:803–869.
5. Ploux S., Whinnett Z., Bordachar P. Left ventricular endocardial pacing and multisite pacing to improve CRT response. J Cardiovasc Transl Res. 2012;5:213–218.
6. Prinzen F.W., Houthuizen P., Bogaard M.D. et al. Is acute hemodynamic response a predictor of long-term outcome in cardiac resynchronization therapy? J Am Coll Cardiol. 2012;59:1198.
7. Rickard J., Kumbhani D.J., Gorodeski E.Z. et al. Cardiac resynchronization therapy in non-left bundle branch block morphologies. Pacing Clin Electrophysiol. 2010;33:590–595.
8. Strik M., Ploux S., Vernooy K. et al. Cardiac resynchronization therapy: refocus on the electrical substrate. Circ J. 2011;75:1297–1304.
9. Strik M., Regoli F., Auricchio A. et al. Electrical and mechanical ventricular activation during left bundle branch block and resynchronization. J Cardiovasc Transl Res. 2012;5:117–126.
10. Whinnett Z., Bordachar P. The risks and benefits of transseptal endocardial pacing. Curr Opin Cardiol. 2012;27:19–23.
[/level-membership-for-cardiovascular-category][not-level-membership-for-cardiovascular-category]
History
Comments
Medications
Comments
Current Symptoms
Comments
Physical Examination
Comments
FIGURE 18-1 Baseline electrocardiogram.
FIGURE 18-2 The cardiothoracic ratio is over 50%. Some pulmonary overloading can be observed.
Laboratory Data
Comments
Electrocardiogram
Findings
Comments
Echocardiogram
Findings
FIGURE 18-3 In spontaneous rhythm, dP/dtmax is very low (481 mm Hg/sec) with a low left ventricular systolic pressure found at 88 mm Hg.
Comments
Catheterization
Comments
[/not-level-membership-for-cardiovascular-category]
