CHAPTER 15
Glucose metabolism and the pathophysiology of diabetes mellitus
David B. Wile; John P.H. Wilding
CHAPTER OUTLINE
PHYSIOLOGY AND PATHOPHYSIOLOGY OF GLUCOSE HOMOEOSTASIS
Introduction: the maintenance of normoglycaemia
Insulin-like growth factors and their receptors
CLASSIFICATION AND DIAGNOSIS OF DIABETES MELLITUS
Maturity onset diabetes of the young (MODY)
ENDOCRINE ASSOCIATIONS WITH DIABETES
DIABETES, NUTRITION AND GROWTH
MECHANISMS OF DIABETIC TISSUE DAMAGE
Other aspects of diabetic tissue damage
CONDITIONS ASSOCIATED WITH INADEQUATELY CONTROLLED DIABETES MELLITUS
BIOCHEMICAL MEASUREMENTS IN DIABETES MELLITUS
PHYSIOLOGY AND PATHOPHYSIOLOGY OF GLUCOSE HOMOEOSTASIS
Introduction: the maintenance of normoglycaemia
Blood glucose concentrations are maintained within very close limits in healthy people. Any given individual has a very strictly maintained postabsorptive (e.g. fasted overnight) blood glucose concentration of 4.5–5.2 mmol/L, with intraindividual coefficients of variation (CV) of only 1–2%. Interindividual CV (assuming similar times since previous meal, levels of activity, composition of previous meal etc.) is less than 5%, so that a fasting glucose of 6.0 mmol/L is usually 4–5 standard deviations away from the mean in most populations. Glucose concentrations in healthy people increase after meals, but typical meals will not raise blood glucose above 8–10 mmol/L and normoglycaemia is usually restored within 2–4 h. Falls in glucose concentration may be produced by severe, sudden unaccustomed exercise or prolonged fasting (or both), by the pathological conditions discussed in Chapter 17 and by pharmacological means, but are not typically encountered in healthy adults on a daily basis.
The strictness of glucoregulation is remarkable when compared with the relative laxity of regulation of the concentrations of other circulating metabolic fuels such as ketone bodies and non-esterified fatty acids (NEFA, also known as free fatty acids, FFA). The reason for strict avoidance of low blood glucose concentrations is readily apparent in terms of the avoidance of the neurological and other consequences of hypoglycaemia, and it may be no accident that of all the hormones known to influence blood glucose concentration, insulin is the only one able to lower it. The threshold for the onset of detectable neuroglycopaenia is of the order of 3.0–3.5 mmol/L, and it is thus appropriate that counter-regulatory mechanisms are set to respond to maintain glycaemia comfortably above this level.
The reason for the strict avoidance of hyperglycaemia is less immediately apparent. Symptoms of hyperglycaemia are florid (in subjects used to relative normoglycaemia) at blood glucose concentrations of > 12–13 mmol/L and may become apparent at concentrations < 10 mmol/L. Such concentrations may be seen, for example following a myocardial infarction, so-called ‘stress hyperglycaemia’ owing to the effect of catecholamine release, and are usually transient. Stress hyperglycaemia also occurs when plasma cytokine concentrations rise, for example in sepsis, with an increase in oxidative metabolism. (The severe metabolic consequences of hyperglycaemia at concentrations usually > 20 mmol/L are discussed in the section on diabetic emergencies in Chapter 16.) In contrast, mild hyperglycaemia (glucose 6–9 mmol/L) is usually asymptomatic. The only obvious teleological value of preventing mild hyperglycaemia is the avoidance of the consequences of chronic hyperglycaemia, usually referred to as ‘long-term diabetic complications’ or ‘diabetic tissue damage’ (p. 296 and 322), and the increased susceptibility to infection that may occur acutely.
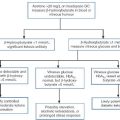
The mechanisms for regulation of normoglycaemia are summarized in Box 15.1, which lists the counter-regulatory mechanisms responsible for preventing hypoglycaemia, and Figure 15.1, which outlines the main sites of insulin action relevant to prevention of hyperglycaemia.
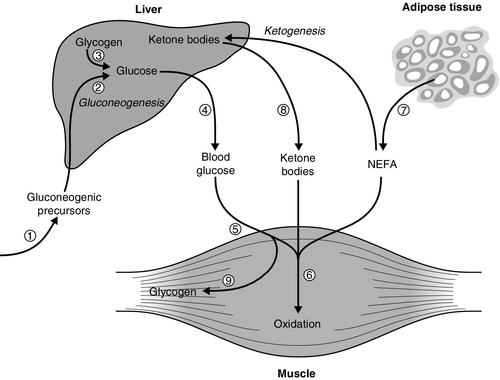
FIGURE 15.1 The principal antihyperglycaemic actions of insulin. Insulin  reduces the production of gluconeogenic precursors such as glycerol, alanine and lactate,
  reduces activity of hepatic gluconeogenic enzymes and
  increases hepatic glycogenolysis to glucose. These effects contribute to
  reduced hepatic glucose output. Insulin
  increases cellular glucose uptake mediated by insulin-sensitive glucose transporters (GLUT4) and
  reduces competition for glucose oxidation by alternative fuels (‘Randle effect’). The reduction of competing fuels involves
  inhibition of NEFA release from adipose tissue and
  reduced hepatic ketogenesis.
  Insulin promotes glucose storage as glycogen.
Normal glucose metabolism
Circulating glucose derives from three main sources:
• the gut, as the result of hydrolysis or hepatic conversion of a variety of ingested carbohydrates
• hepatic and some other glycogen stores (glycogenolysis)
• new synthesis from precursors (gluconeogenesis). Gluconeogenesis takes place in the liver (~75–90%) and kidneys (~10–25%) from glucogenic amino acids, especially alanine, and from glycerol, lactate and pyruvate. Principally it involves the synthesis of a 6-carbon compound from various 3-carbon skeletons. Partial oxidative metabolism in tissues like adipocytes and muscle provides lactate and pyruvate but they can also be donated by red blood cells, in which anaerobic metabolism occurs in the absence of the enzymes of the Krebs (tricarboxylic acid) cycle. Triacylglycerol (triglyceride) released from adipocytes during lipolysis provides glycerol.
Regulation of gluconeogenesis can be via changes in the amount of substrate arriving at the liver or by the amount that the liver itself extracts, as well as by regulation within the liver. This process is subject to direct hormonal modulation by insulin, glucagon and catecholamines and indirectly by other hormones.
Hepatic glucose output is ~2.0 mg/kg body weight/min in the resting postabsorptive state, or 200–300 g during the average 24 h period (varying with the availability of glucose from food and with the body’s requirements during exercise). Plasma glucose concentration is determined by the balance between glucose influx into the circulation (principally from food and hepatic glucose production) and peripheral glucose clearance.
Glucose is stored as glycogen, a 70 kg man typically having a total of 700–1000 g (hydrated) glycogen. Most of this is in the skeletal muscle (400–600 g), and liver (60–125 g), with lesser amounts in other tissues. Glycogen is synthesized from both glucose and the gluconeogenic substrates (see above). Glycogen is a polymeric storage form of glucose. Extension of the polymer by the addition of glucose 6-phosphate subunits is catalysed by glycogen synthase, which is the main regulatory enzyme for glycogen synthesis. This enzyme is itself subject to regulation by a dephosphorylation/phosphorylation cycle controlled by a cyclic AMP dependent protein kinase. Glycogen in skeletal muscle can provide fuel for muscle but does not provide a source of glucose for release into the circulation.
Glucose provides approximately 40–60% (on a typical diet in the developed world) of the total fuel expended by the body during a 24 h period. It provides almost all the energy for the central nervous system (especially in well-nourished subjects, although sustained fasting allows cerebral ketone body utilization). During high-intensity exercise and during the 4–6 h postprandial period, glucose is the predominant fuel for the whole body. Glucose is the most efficient fuel for oxidation in terms of the liberation of energy (112.2 kcal or 6 moles ATP per mole of oxygen consumed). Many tissues can use ketone bodies, fatty acids or glucose for their basal metabolism, switching between these different fuels depending upon their availability in the circulation.
Glucose is fully oxidized to carbon dioxide and water in skeletal muscle, the brain and the liver. The brain accounts for most of the glucose oxidized in the fasting state (100–125 g/24 h). In the resting, fasted state, skeletal muscle takes up 10–20% of hepatic glucose output: this is not all oxidized but can be converted to lactate, pyruvate, glycerol or the carbon skeletons of amino acids, much of which subsequently return to the liver and act as precursors for gluconeogenesis. Fatty acids (or their partial oxidation products, ketone bodies) are the prime fuel of resting muscle, heart and liver. Other tissues such as red blood cells, skin, adipose tissue and the renal medulla derive energy from glycolysis to lactate and pyruvate, even in the resting state. Glycolysis to lactate is an anaerobic process to which many cells may resort when faced with hypoxia, for example skeletal muscle during high-intensity exercise. The brain can adapt to the utilization of ketone bodies as a source of fuel during a prolonged fast, but this is far from being an instantaneous process, and the more immediate response depends upon increasing glucose supply as a result of the action of the counter-regulatory hormones glucagon, cortisol, catecholamines and growth hormone. Although each can achieve the objective of restoration of blood glucose supply to the brain, the mechanism for each differs. Adrenaline (epinephrine) and glucagon are the ‘rapid response’ team, activating hepatic glucose formation via glycogen phosphorylation, whilst growth hormone and cortisol are the ‘back up’ team inducing the enzymes responsible for gluconeogenesis. Catecholamines can additionally increase circulating non-esterified fatty acid concentrations by upregulating lipolysis so muscle uptake of glucose falls, leaving more glucose for the brain to use.
In contrast, if the counter-regulatory hormones are present in excess and there is also a relative deficiency of insulin then hyperglycaemia results; infections and trauma are common causes of increased secretion of catecholamines.
Glucose transporters
Glucose is a hydrophilic molecule that is unable directly to penetrate the lipid bilayer of cells: its uptake into cells is therefore achieved by an energy-independent process of facilitated diffusion down its concentration gradient, mediated by a family of glucose transporter proteins (GLUTs) composed of at least 12 membrane spanning helices with a larger intracellular loop connecting the sixth and seventh helices. These transporters allow uptake of glucose into cells from the interstitial fluid into which glucose diffuses from the bloodstream and, by virtue of differences in kinetics, tissue and subcellular expression profiles, and substrate specificities, mediate specific functions such as glucose sensing (GLUT2) and insulin-dependent glucose uptake (GLUT4) (Table 15.1).
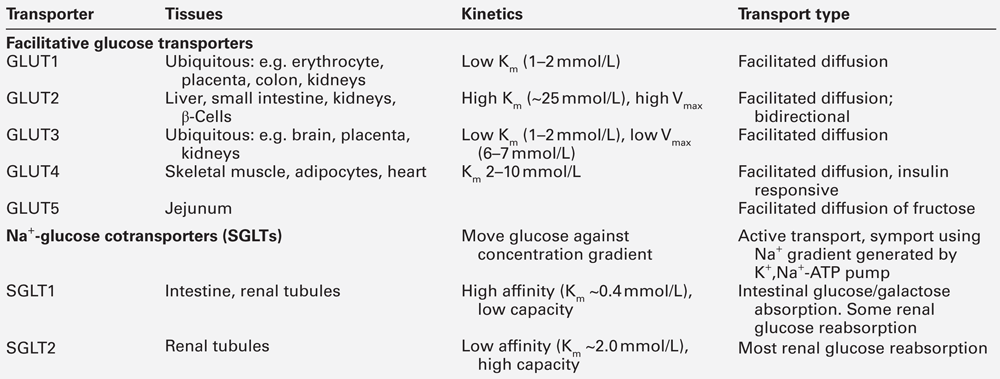
The 14 facultative glucose transporters recognized to date are classified into those having high glucose affinity (class I comprising GLUTs 1–4), high fructose affinity (class II, e.g. GLUT5) and novel transporters whose physiology is not yet fully understood (GLUTs 6–14). The different functions of the class I GLUTs are partly predictable from their differing Km values. Glucose transporters 1, 3 and 4 have Km values of ~2–5 mmol/L but GLUT2 has a Km of ~25 mmol/L. This permits high rates of glucose entry into essential cells (e.g. in the central nervous system (CNS), which is relatively protected from neuroglycopaenia by the low Km of its GLUT3 transporters). Pancreatic β-Cells are able to sense increments in blood glucose over a range considerably exceeding normal values via the high Km GLUT2 transporter protein.
Certain glucose transporters (GLUT1 and GLUT3) are present on cell surfaces at all times. In contrast, GLUT4 is stored in the cytoplasm when insulin is not present; it responds to insulin by moving from intracellular stores to cell membranes, thereby increasing total transporter number (typically 6–10-fold). When insulin concentrations decline, GLUT4 is removed from cell membranes by endocytosis and rapidly recycled back to its intracellular storage compartments. Erythrocytes are insulin non-responsive because they possess only GLUT1. Many cells can express a variety of different GLUT transporters, and the expression of GLUT receptors changes with circumstances: for example liver cells express more GLUT1 and GLUT3 during starvation. Dysfunction of the insulin-regulated GLUT4 translocation process appears to play a part in the insulin resistance syndrome, and mutations of several transporters (e.g. GLUT1, GLUT2) have been associated with inherited metabolic diseases of carbohydrate metabolism.
Tissue glucose uptake via GLUT transporters involves facilitated diffusion down a concentration gradient, the intracellular concentration of glucose being very low because of its active metabolism by phosphorylating enzymes (hexokinases and glucokinases). In resting, postabsorptive subjects, ~ 70% of the body’s glucose metabolism occurs independently of the action of insulin. However, these insulin-independent mechanisms cannot maintain normoglycaemia for very long without insulin orchestrating the response to food and integrating the balance between fatty acid, ketone body and glucose metabolism. Insulin-independent (as well as insulin-dependent) glucose clearance is impaired in subjects with type 2 diabetes and also in normoglycaemic subjects with a family history of diabetes. This suggests that abnormalities in insulin-independent glucose disposal manifest at a very early stage of disease development. This phenomenon of ‘glucose resistance’ appears to be quantitatively important: in normal subjects, as much as half an intravenous glucose load is cleared by non-insulin-mediated glucose disposal. Although polymorphisms of GLUT4 do not appear to be any more common among patients with type 2 diabetes than in the normal population, there is evidence that targeting and trafficking of this glucose transporter may be abnormal in both skeletal muscle and adipose tissue in this condition. The insulin-sensitizing agents metformin and the thiazolidinediones appear to increase cell surface expression of GLUT4, as does physical exercise.
The ability to move glucose against a concentration gradient, necessary in the special circumstances of the renal tubules and intestinal epithelium, is conferred by a family of sodium-dependent glucose cotransporters. Sodium-dependent glucose cotransporter 1 (SGLT1) is present in the gut, where it is responsible for absorption of glucose and galactose from the diet. Mutations of SGLT1 are associated with the glucose–galactose malabsorption syndrome that may cause fatal infantile diarrhoea unless these sugars are removed from the diet. Sodium-dependent cotransporter 2 (SGLT2) is a low affinity high capacity transporter that is present in the S1 segment of the proximal renal tubules and is responsible for 90% of renal glucose reabsorption, the remaining glucose being reabsorbed by the high affinity but low capacity SGLT1 transporter found in the S3 segment; reduced function mutations of SGLT2 are associated with renal glycosuria. Drugs that block SGLT2 (thus increasing urinary glucose loss) have recently been licensed in the UK as glucose-lowering agents.
The fate of intracellular glucose and its role in diabetes
Some of the principal intracellular metabolic pathways for glucose, together with their rate-limiting enzymes, are schematically illustrated in Figure 15.2, with the pathways labelled a–k.
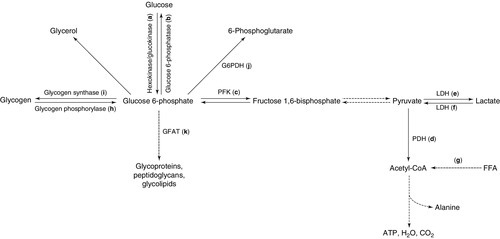
FIGURE 15.2 Intracellular metabolic pathways for glucose. FFA, free fatty acids; G6PDH, glucose 6-phosphate dehydrogenase; GFAT, glutamine:fructose 6-phosphate amidotransferase; LDH, lactate dehydrogenase; PDH, pyruvate dehydrogenase. Broken lines indicate pathways from which intermediates have been omitted for clarity. Lower case letters refer to reactions, which are discussed in the text.
In order to trap glucose within cells (since all the GLUTs are potentially bidirectional), glucose is phosphorylated on entry by a family of hexokinases (a). Hexokinase types I–III are widely expressed and have low Km, but hexokinase type IV (also called glucokinase, and predominantly expressed in liver and the β-Cells of the islets of Langerhans) has a much higher Km (up to 15 mmol/L), permitting it to function as a glucose sensor over (and beyond) the physiological range of blood glucose. Since glucokinase is also the rate-limiting step in glucose metabolism, it thus becomes the ultimate determinant of the rate of insulin secretion from β-Cells.
Loss of function mutations of glucokinase are responsible for one form of maturity onset diabetes of the young (MODY 2, which represents approximately 30% of all cases of MODY). Patients present with mildly elevated blood glucose concentrations owing to apparent elevation of the set point for blood glucose concentrations. For reasons that are not totally clear, patients with this condition appear to be at very low risk for the development of diabetic complications and are rarely symptomatic. Although a good response is typically obtained with augmentation of the insulin response by sulfonylurea therapy, this is often not necessary. Although glucokinase might be a potential candidate gene in type 2 diabetes (and a treatment target, given that activating mutations can cause hypoglycaemia in man), mutations appear to be no more common among people with type 2 diabetes than in the general population.
Dephosphorylation of glucose (the reverse reaction) is catalysed by glucose 6-phosphatase (b). This process is necessary for the export of glucose (from gluconeogenesis) by hepatic and renal cells in hypo-insulinaemic situations. Deficiency of this enzyme (or of the associated glucose 6-phosphate transport protein) is the cause of glycogen storage disease type 1 (von Gierke disease), and its overactivity is a feature of the increased and relatively insulin-insensitive hepatic glucose production typical of type 2 diabetes. The insulin sensitizing agents metformin and the thiazolidinediones appear to reduce the activity of glucose 6-phosphatase, although it is not clear whether these are direct effects or are mediated through some other upstream action.
Having entered the cell and undergone phosphorylation, glucose undergoes one of four distinct metabolic fates. It may be:
• metabolized aerobically to yield energy
• metabolized anaerobically to yield energy
• used to synthesize other molecules (glycerol and the carbon skeletons of certain non-essential amino acids)
• stored as glycogen.
The dominant flux along each pathway will depend on the tissue (e.g. gluconeogenesis can take place in the liver and kidneys, glycogen storage in liver and muscle, glycerol generation in adipose tissue) and on the prevailing metabolic circumstances such as cellular ATP requirements (requiring glycolysis), ‘housekeeping’ requirements (e.g. plasma membrane stability in erythrocytes), oxygen availability (determining whether glycolysis is anaerobic (yielding lactate) or aerobic (yielding pyruvate, which can be converted to acetyl-CoA and enters the tricarboxylic acid cycle) and alternative substrate availability (e.g. fatty acids or ketone bodies in the fasting state). Some of these pathways, and in particular the rate of glucose oxidation, have been shown to be abnormal in subjects with type 2 diabetes and also in their non-diabetic relatives.
Glucose oxidation proceeds via the action of the rate-limiting enzyme phosphofructokinase (c) through various intermediates to pyruvate. Pyruvate may cross the mitochondrial membrane to enter the tricarboxylic acid cycle via the mitochondrial pyruvate dehydrogenase (PDH) enzyme complex (d) (releasing a net 38 molecules of ATP per molecule of glucose) or may remain in the cytosol and be converted anaerobically to lactate via the bidirectional enzyme lactate dehydrogenase (LDH) (e) (yielding only a net two molecules of ATP per molecule of glucose). Pyruvate dehydrogenase in muscle is stimulated by exercise and in most tissues by insulin, but this stimulation is reduced in diabetes. Pyruvate dehydrogenase is inactivated by phosphorylation, catalysed by PDH kinase (which is over expressed in insulin resistance). As a result, glucose metabolism is shifted away from the tricarboxylic acid cycle. This effect may be prevented by activation of peroxisome proliferation activating receptor α (PPARα, see p. 720), one of a family of lipid-activated transcription factors. Mitochondrial diseases have been reported to cause insulin resistance or diabetes (e.g. diabetes insipidus, diabetes mellitus, optic atrophy and deafness (DIDMOAD) syndrome, Friedreich ataxia and HIV-associated lipodystrophy); indices of mitochondrial activity (e.g. mitochondrial number and size) are generally reduced in insulin-resistant states.
Lactate, generated under anaerobic conditions (and in cells such as erythrocytes, which lack the requisite enzymes) can be used as a substrate for gluconeogenesis either locally or after export to the liver (the Cori cycle), or may enter the tricarboxylic acid cycle after reconversion to pyruvate (f).
It has been postulated that an increased availability of substrates such as FFAs or ketone bodies, entering the tricarboxylic acid cycle via acetyl-CoA (g), may lead to excess generation of citrate, with the consequent inhibition of phosphofructokinase (PFK), thus shunting glucose down alternative, non-oxidative pathways (the glucose-FFA or Randle cycle). The consequent reduction in the entry of glucose into the tricarboxylic acid cycle could contribute to diminished glucose oxidation and thus to diabetes.
Glycogenolysis (h) is initiated by glycogen phosphorylase, the activity of which is stimulated by glucagon (in liver) and catecholamines (in muscle). In muscle, the glucose liberated from glycogen is used locally as an energy source: it is not exported into the circulation. Muscle glycogen storage via glycogen synthase (i) is diminished in type 2 diabetes, potentially contributing to reduced glucose disposal.
Intracellular glucose can also be metabolized through the pentose phosphate shunt (hexose monophosphate shunt) via glucose 6-phosphate dehydrogenase (j). Deficiency of this enzyme causes an X-linked form of haemolytic anaemia, owing to the fact that this pathway is the only route of glucose metabolism in red blood cells; it is prevalent in people originating from the Mediterranean littoral.
The rate-limiting enzyme of the hexosamine synthetic pathway (glutamine:fructose 6-phosphate amidotransferase, GFAT) (k) is overactive in diabetes and hyperglycaemia; this pathway leads to the glycosylation of proteins, including transcription factors, and can affect cellular sensing of glucose. The hexosamine pathway is also relevant to the development of complications of diabetes through alterations in endothelial function mediated by endothelial nitric oxide synthase (eNOS), protein kinase A and protein kinase C. Defects in glucose oxidation and glycogen storage may cause shunting of glucose down this pathway, leading to insulin resistance, reduced insulin secretion and diabetic complications.
Animal models of glucotoxicity show many of the features of type 2 diabetes, for example reduced GLUT4 translocation (reducing glucose uptake into cells), reduced glycogen synthase activity (reducing glucose incorporation into glycogen), increased hepatic glucokinase activity (increasing intracellular glucose trapping), increased hepatic glucose output and reduced β-Cell glucokinase activity (reducing insulin secretion). Insulin resistance may thus be a defence against excessive intracellular accumulation of glucose, sensed by excessive shunting down the hexosamine synthetic pathway and mediated via the transcriptional regulation of key enzymes and pathways (‘cellular satiety’). Reduced glucose oxidation in pancreatic β-Cells could lead to impairment of insulin secretion, and in other tissues could lead to diminished glucose disposal, both of which are hallmarks of type 2 diabetes. However, the extent to which these abnormalities actually contribute to diabetes rather than relate to specific experimental conditions (e.g. glucose and insulin concentrations), or are simply consequences of some other pathological processes, remains unclear.
Insulin
Biosynthesis
Insulin is a peptide hormone (51 amino acids arranged in two peptide chains linked by two disulphide bonds, molecular weight 5807 Da), which is secreted by the β-Cells of the islets of Langerhans in the pancreas. In the synthesis of insulin, translation of mRNA yields preproinsulin, a prohormone that undergoes post-translational modification prior to release of the mature insulin molecule. Removal of 24 amino acids from preproinsulin yields proinsulin, which consists of 86 amino acids. Proinsulin is stored in secretory granules prior to release from β-Cells by exocytosis. In healthy subjects, > 90% of proinsulin is converted to mature insulin by the removal of the metabolically inert C-peptide component prior to secretion. The other products of the post-translational modification are either released when exocytosis occurs or are degraded within the secretory granules prior to release. C-peptide is co-secreted in equimolar amounts with mature insulin. In healthy subjects, only small amounts (< 10% of mature insulin output) of proinsulin and partially split proinsulin are released. These ratios are characteristically disturbed in certain pathological states, including autonomous insulin secretion from an insulinoma and type 2 diabetes mellitus. Plasma concentrations of proinsulin and C-peptide are low or undetectable in cases of surreptitious administration of exogenous insulin. Assay of these substances may, therefore, prove helpful in the differential diagnosis of hypoglycaemia in some circumstances. Proinsulin may accumulate in renal failure and its plasma concentration is elevated in familial hyperproinsulinaemia.
Substances stimulating the synthesis and storage of insulin include glucose, mannose, leucine, arginine and a variety of metabolizable sugars and sugar derivatives. Most of these also promote secretion.
Secretion and pharmacokinetics
The mechanisms by which insulin release is triggered are the focus of much research. It is apparent that there is an ATP-dependent, sulfonylurea-sensitive K+ channel whose closure is a late event in the intracellular signalling mechanism within the β-Cell; closure triggers calcium influx and exocytosis. It is not clear how this K+ channel is activated, although a wide range of secretagogues can stimulate activation of this final common pathway. The most important of these is hyperglycaemia, although mannose, lactate, arginine, leucine and other amino acids, glucagon, glucagon-like peptide 1 (GLP-1), glucose-dependent insulinotropic peptide (GIP, known formerly as gastric inhibitory peptide), cholecystokinin, vasoactive intestinal peptide (VIP), sulfonylureas and parasympathetic cholinergic (muscarinic) nerve activity also stimulate insulin release; many of these secretogogues have synergistic effects. Both neural sympathetic tone and circulating catecholamines inhibit insulin secretion.
Because of cephalic and gastric influences, oral glucose is a more potent stimulus to insulin secretion than an equivalent amount of intravenous glucose. This difference is known as the ‘incretin’ effect and is predominantly mediated by gut-derived hormones such as the N-terminally truncated GLP-1 (7–36) amide, and GIP. Recently, drugs have become available that augment the release of insulin via the sulfonylurea-sensitive K+ channels of β-Cells (meglitinide analogues) and GLP-1 receptors (GLP-1 analogues), both acting in a glucose-dependent manner. These mechanisms afford the clinically desirable possibility of augmenting insulin release during conditions of hyperglycaemia, while at the same time reducing the risk of hypoglycaemia. They are discussed further in Chapter 16.
In healthy adults, insulin is secreted in pulses with a pulse periodicity of 11–15 min. Stimuli of insulin secretion increase the frequency and amplitude of these pulses. Approximately 30–40 U (210–280 nmol) of insulin are secreted per 24 h in healthy subjects of normal weight. Insulin secretion is basal (0.25–1.0 U/h) until glucose concentration exceeds a threshold of ~5 mmol/L, and becomes maximal at a concentration of 15–20 mmol/L.
Insulin is secreted into the portal venous system and thus must pass through the liver before reaching the systemic circulation. Approximately half of the insulin is cleared in the ‘first pass’ through the liver. The liver is exposed to insulin concentrations approximately three-fold higher than other tissues during endogenous insulin secretion. The first pass clearance of insulin by the liver is variable, being controlled not only by the prevailing blood glucose concentration but also by factors released from the gut before absorption is complete, and by the integrated action on β-Cell receptors of a range of endocrine and nutritional signals. It is, therefore, not surprising that it is difficult to replicate physiological patterns of insulin concentrations by giving exogenous insulin subcutaneously.
Autocrine and paracrine regulation of insulin secretion by pancreatic and gut hormones (which may reach very high concentrations within islets) is not well understood. Increased secretion of insulin involves recruitment of more β-Cells to the secreting mode.
Fasting peripheral insulin concentrations vary between 20 and 140 pmol/L (~ 2.9–20 mU/L), as measured by immunoassays in healthy subjects, the higher values being associated with increasing age and obesity. After a typical mixed meal (700–800 kcal), peak plasma insulin concentrations reach ~ 350–580 pmol/L (50–84 mU/L) in lean young adults. The half-life of insulin injected into a peripheral vein is 2–6 min, with most being cleared by the liver and smaller amounts being cleared by other tissues that have insulin receptors, such as skeletal muscle, although there is also non-receptor mediated clearance by a variety of tissue proteases.
Abnormalities of the synthesis and secretion of insulin
There are a number of recognized genetic abnormalities of insulin structure involving mutations of the insulin gene and hence altered amino acid sequences. Some of these are listed in Table 15.2. Each of the proinsulin and insulin variants mentioned has reduced biological activity in relation to insulin. This causes a propensity to diabetes, although individuals who can sustain a compensatory hypersecretion may not develop the condition. For example, in familial hyperproinsulinaemia, hypersecretion is usually sufficient to prevent diabetes, whereas in insulin Wakayama, diabetes is usual. There are also recognized associations between some polymorphisms affecting the insulin secretory mechanism (e.g. calpain 10, a molecule that promotes the fusion of secretory granules with cell membranes) and diabetes.
TABLE 15.2
Some genetically determined abnormal insulins
| Condition | Abnormality | Consequences |
| Familial hyperproinsulinaemia | Failure to cleave C-peptide from proinsulin |
True insulin concentrations and glucose tolerance normal |
| Insulin Chicago | Leu for Phe substitution at position 25 of β chain | Reduced receptor binding |
| Insulin Los Angeles | Ser for Phe substitution at position 24 of β chain | Reduced receptor binding |
| Insulin Wakayama | Leu for Val substitution at position 3 of α chain | Reduced receptor binding |
| Proinsulins Boston and Tokyo | His for Arg substitution at position 65 | Inability to cleave proinsulin to insulin |
| Proinsulin Providence | Asp for His substitution at position 10 of β chain | Inability to cleave proinsulin to insulin |
| Proinsulin Kyoto | Leu for Arg substitution at position 65 | Inability to cleave proinsulin to insulin |
More common abnormalities of insulin secretion involve loss of the normal pulsatility of insulin release, an early feature of both obesity and type 2 diabetes. The progressive loss of insulin secretory capacity in diabetes is discussed below.
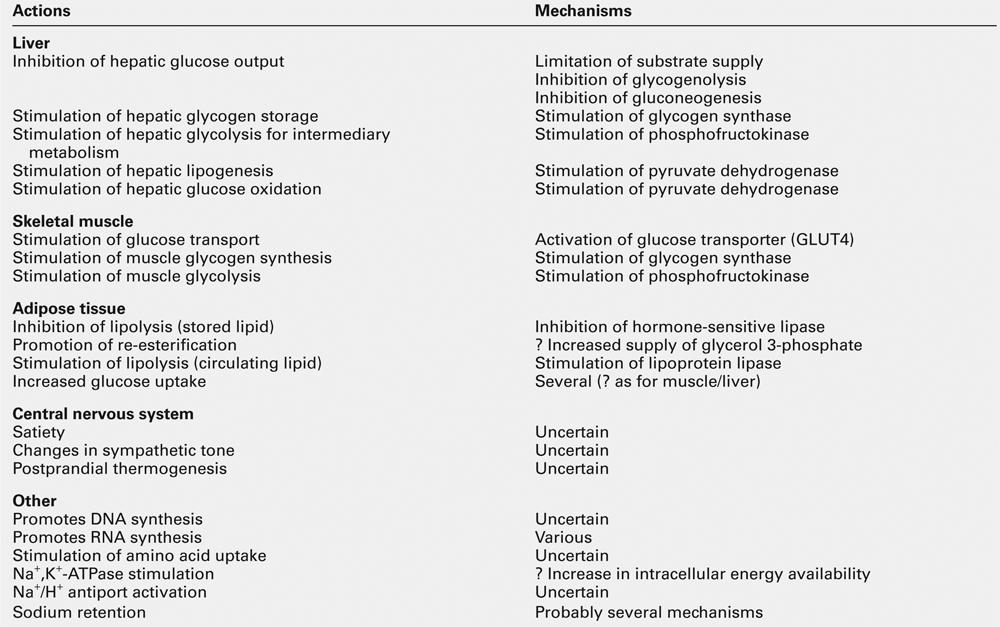
Actions of insulin
Insulin has widespread actions, some of which are listed in Table 15.3. It is the dominant hormone regulating blood glucose concentration. It should be noted that while the mechanisms of its glucoregulatory action have been the subject of extensive research, much less is known about its other actions in health or in insulin-resistant states, although vascular effects (vascular smooth muscle proliferation, vasodilatation), CNS effects (appetite, learning, memory) and effects in relation to growth, differentiation and apoptosis have all been proposed.
At present, only two receptors that mediate the actions of insulin have been identified: the insulin receptor and the IGF (insulin-like growth factor) receptor. It is apparent, however, that there are individual dose–response curves for the different actions of insulin in different tissues. For example, the median effective dose (ED50) for insulin’s antilipolytic action on adipose tissue is < 140 pmol/L (20 mU/L) (and may be < 70 pmol/L), while those for inhibition of hepatic glucose output and stimulation of glucose uptake into skeletal muscle are 210–350 pmol/L (30–50 mU/L) and 350–490 pmol/L (50–70 mU/L), respectively. A doubling of insulin concentration inhibits hepatic glucose output by ~80% and stimulates peripheral glucose utilization by ~ 20%. In patients with type 2 diabetes, these differential effects on lipolysis, hepatic glucose output and glucose uptake, coupled with ongoing (if reduced) insulin secretion, are probably responsible for the fact that most individuals are not at risk of developing ketoacidosis (at least for many years), despite the clear defect in glucoregulation that is evident.
The different actions of insulin have different time courses, with the glucoregulatory and antilipolytic occurring within a few minutes, and growth regulation and actions dependent upon synthesis of new proteins occurring over periods of hours or days. Intravenous injection of insulin typically has little effect on blood glucose for 5–10 min, the maximal hypoglycaemic action occurring after 5–15 min. Insulin stimulation of skeletal muscle glucose uptake declines with a half-life of 10–20 min after the insulinaemic stimulus has been removed.
Proinsulin and partially split proinsulins have metabolic activities generally similar to those of insulin, although their plasma half-lives are 3–5 times longer and their biological potencies are only 8–15% that of insulin. It has been suggested that the hepatic activity of proinsulin may be relatively more potent than its effect on peripheral glucose uptake.
The insulin receptor
The main glucoregulatory effects of insulin are mediated by a transmembrane receptor found on insulin-sensitive cells. This receptor is a glycoprotein, with total molecular weight of 350 000 Da, comprising four peptide chains (two α- and two β-subunits), linked by disulphide bridges (Fig. 15.3). Two isoforms of the receptor (IR-A and IR-D) are formed by alternative splicing. The gene for, and amino acid structure of, the insulin receptor have been characterized and show homology with those of the IGF-1 receptor (see below). Within the intracellular domain of the β-subunit is a tyrosine kinase capability, which is activated when insulin binds with the extracellular domain of the α-subunits. The tyrosine kinase promotes autophosphorylation of the receptor followed by activation of threonine and serine kinases.
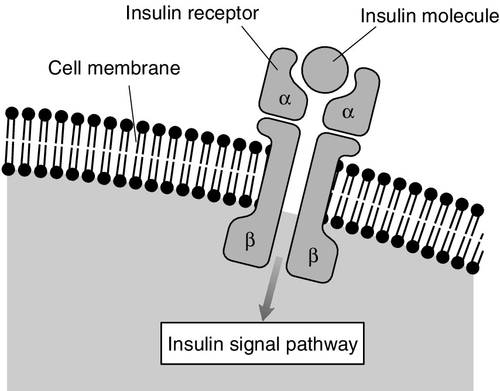
FIGURE 15.3 The insulin receptor.
The insulin receptor gene is located on the short arm of chromosome 19 (19p 13.2). Rare gene mutations have been described, for example leprechaunism and Rabson–Mendenhall syndrome, which result in severe glucose intolerance with resistance to exogenous insulin, and profoundly disordered growth, rather than typical insulin resistance. These conditions are usually lethal in infancy and adolescence, respectively. There are also more common, ‘milder’ polymorphisms of the insulin receptor gene. However, these appear to explain only a small proportion of the marked variance in population insulin sensitivity and they are considered to be a rare (< 1%) cause of type 2 diabetes mellitus. Indeed, most mutations of the insulin gene that have been recognized are not sufficient to cause diabetes alone, although they may render it more likely to occur in the presence of other risk factors.
Second messengers mediating the effects of insulin
Insulin can have multiple actions, even on a single responsive cell, and hence there are probably several different intracellular pathways mediating its actions. Glucoregulatory and antilipolytic responses are rapid and probably mediated via serine and threonine kinases and cAMP. Stimulation of lipid and protein synthesis, inhibition of proteolysis, the nuclear transcription of RNA and the replication of DNA are slower and have different second messenger systems. Second messenger systems involving diacylglycerol, protein kinase C and glycosyl-phosphatidyl-inositol are under investigation, but abnormalities in them have yet been demonstrated to be necessary or sufficient to cause diabetes in man. As a result of these second messenger cascades, glucose transporter proteins are translocated from within cells to their surface membranes to increase glucose flux into the cytoplasm.
After activation, insulin–receptor complexes are internalized by an endocytotic process; receptors are later recycled to the cell surface. Internalization of the insulin is important (and possibly essential) for insulin signals to reach the nucleus and influence cell growth and protein synthesis. Internalization is an important route by which insulin is cleared from the circulation and degraded. The actions of insulin in stimulating DNA transcription and mRNA translation do not depend upon the plasma membrane insulin receptor kinase activity and the second messenger systems discussed above, or on the IGF receptors described below, but rather involve direct effects within the nucleus and on ribosomes.
Insulin-like growth factors and their receptors
In addition to its acute effects on glucose uptake and release and on lipid metabolism, insulin has growth promoting activity in a variety of tissue culture models. At least two protein hormones, insulin-like growth factors 1 and 2 (IGF-1 and IGF-2), have actions that partly resemble these actions of insulin. The amino acid sequences of these proteins and the base sequences of their coding DNA are known and show some homology with those of insulin. Insulin-like growth factors are weak agonists for the insulin receptor and hence have weak glucoregulatory and antilipolytic effects. In addition, they have growth-promoting effects mediated by two IGF receptors. Insulin itself binds only weakly to IGF receptors.
The physiological role of IGFs is not yet fully established. It has been suggested that they act as somatomedins (they were previously called somatomedins C and A, terms that are no longer recommended), in that they are induced by growth hormone and mediate its growth-promoting effects in children. In adults, they are believed to promote the growth of continually dividing cells such as osteoblasts, chondrocytes, fibroblasts and erythroid cells.
Adult growth hormone deficiency is manifest by low overall quality of life scores, reduction in lean body mass, centripetal fat distribution, loss of bone mineral, abnormal lipid profile, insulin resistance and changes in the secretion and metabolism of other circulating hormones, for example thyroxine (see p. 367). The effects of growth hormone deficiency on insulin sensitivity are complex. While glucose intolerance is a common feature of acromegaly, in growth hormone deficiency states, adverse changes consequent upon an increase in body fat composition tend to outweigh the lack of a counter-regulatory hormone to produce insulin resistance overall. Replacement therapy in adult growth hormone deficiency produces somewhat unpredictable effects, although a period of increased insulin resistance may herald a modest longer-term improvement.
Tumour-related hypoglycaemia may be due to excess production of IGFs, specifically ‘big’ IGF-2. Local and systemic concentrations of IGFs are modulated by a range of binding proteins. While total IGF-2 may not be increased in tumour-related hypoglycaemia, the IGF-2 is present in an immature form which, because of impaired ability to form the normal ternary 150 kD complex with IGF binding protein-3 (IGFBP-3) and the acid-labile subunit (ALS), circulates with greater than normal bioavailability. This effect has been described in a number of tumours, especially those of mesenchymal and epithelial origin. Further discussion of this topic is presented in Chapter 17.
It was first observed many years ago that proliferative diabetic retinopathy could regress following hypophysectomy in both animals and humans. This effect appears to be mediated via reduction in IGF-1, owing to the growth hormone deficiency seen after pituitary ablation. It has been hypothesized that the metabolic derangements of diabetes reduce hepatic IGF-1 generation in response to growth hormone (i.e. induce growth hormone resistance), which is then hypersecreted (owing to a lack of negative feedback from IGF-1), reaching concentrations that are able to stimulate IGF-1 generation in non-hepatic tissues. However, studies of pegvisomant, a growth hormone analogue that antagonizes IGF-1 generation in response to growth hormone, have not shown benefit in diabetic retinopathy.
CLASSIFICATION AND DIAGNOSIS OF DIABETES MELLITUS
Introduction
Diabetes is the most common metabolic disorder, with a cumulative incidence of 5–10% in people in the developed world aged > 40 years, in whom > 90% of cases are due to type 2 diabetes. Population screening programmes typically reveal that up to half of the subjects found to have type 2 diabetes had previously been undiagnosed. While the burden of type 2 diabetes is increasing exponentially with the epidemic of obesity in many parts of world, the incidence of type 1 diabetes has also been increasing for many years for reasons that are much less apparent. Nevertheless, the prevalence of type 2 diabetes in children is approaching that of type 1 diabetes, having been only ~2–4% of all childhood diabetes prior to 1994, and is predicted to outstrip type 1 diabetes by 2025 on current trends. A high proportion of these children, typically presenting around the time of puberty, require insulin from the time of diagnosis. Whether this is due to the accelerator hypothesis (‘double diabetes effect’), whereby an individual’s risk of contracting type 1 diabetes is increased by the prior existence of type 2 diabetes or insulin resistance, is not clear.
Although insulin has many actions, as described above, diabetes is defined only in terms of elevated blood glucose concentrations. Since blood glucose is a continuous variable, the cut-off points for diagnosis are necessarily somewhat arbitrary.
Recent changes to the diagnostic criteria for diabetes and glucose intolerance reflect the increased cardiovascular risk evident at even moderate levels of fasting hyperglycaemia (~6.0 mmol/L in some studies). However, the blood glucose threshold for this effect is almost certainly lower than that for the predominantly microvascular complications unique to diabetes mellitus. Some people so diagnosed may not, therefore, necessarily be at risk of developing the unique set of complications (nephropathy, retinopathy, neuropathy) that have traditionally characterized the disease and determined its management.
Definitions
The diagnostic criteria for diabetes mellitus set out by The World Health Organization (WHO) have been adopted by both the American Diabetes Association (ADA) and Diabetes UK, although they differ slightly for glucose intolerance. The WHO introduced diagnostic criteria in 1979, but introduced revised criteria in 2000 to reflect better understanding of ‘milder’ glucose intolerance. The use of glycated haemoglobin (HbA1c) for diagnosis was introduced in 2011. The WHO glucose criteria for diagnosis are shown in Box 15.2 and Table 15.4 and its recommendations regarding the use of HbA1c are shown in Box 15.3. World Health Organization criteria consider fasting and 120 min values in the oral glucose tolerance test (OGTT). The reproducibility of the OGTT leaves much to be desired (the CV of 120 min plasma glucose concentrations is reported to be up to 50%). If a subject fulfils the WHO criteria for diabetes, subsequent improvement of glucose tolerance may occur (e.g. as a result of weight loss or spontaneously), but such individuals are considered to have a lifelong tendency to diabetes.
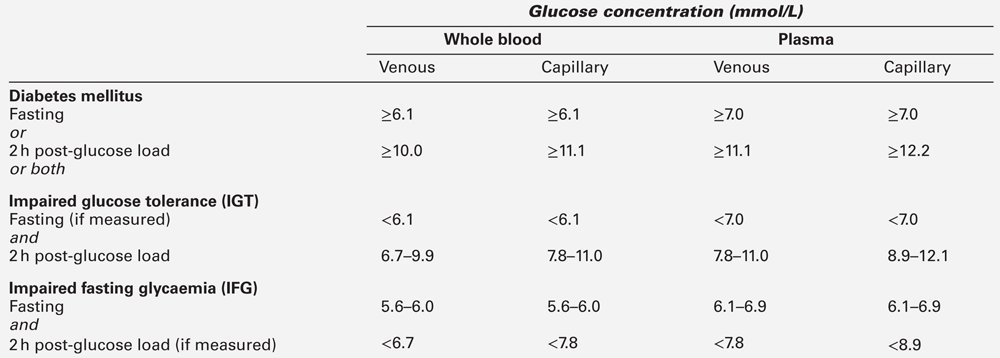
Table 15.4 indicates the criteria for the diagnosis of impaired glucose tolerance (IGT) and impaired fasting glycaemia (IFG), which are metabolic states intermediate between normal glucose tolerance and diabetes. For epidemiological or population screening purposes, the fasting or 2 h value after 75 g oral glucose may be used alone. For clinical purposes, the diagnosis of diabetes should always be confirmed by repeating the test on another day, unless there is unequivocal hyperglycaemia with acute metabolic decompensation or obvious symptoms. Glucose concentrations should not be determined on serum or plasma unless red cells have been immediately removed, or glycolysis will result in an unpredictable underestimation of the true concentrations. It should be stressed that glucose preservatives such as fluoride do not totally prevent glycolysis. If whole blood is used, the sample should be kept at 0–4 °C, and assayed as soon as possible.
Subjects with IGT and IFG are at high risk of progression to diabetes; IGT and IFG should therefore be considered as risk categories for future diabetes and/or cardiovascular disease. In certain cases, glycated haemoglobin (HbA1c), the concentration of which reflects glycaemia over several weeks, gives sensitivity and specificity for diagnosis almost equal to that of glucose measurements, and a cut-off value of 48 mmol/mol (6.5%) is now accepted as diagnostic, although it is important to note that a value below this level does not necessarily exclude diabetes. Several classifications of diabetes have been proposed. The most widely used is that proposed by the WHO and adopted by the ADA shown in Box 15.4. However, it should be recognized that unanimity in nomenclature has yet to be achieved, especially in the areas of gestational diabetes, diabetes related to pancreatitis and tropical/malnutrition-related diabetes.
Type 1 diabetes mellitus
Introduction
Approximately 5–10% of all patients with diabetes have type 1 diabetes mellitus: this is characterized by severe insulin deficiency because of β-Cell destruction. The degree of insulin deficiency is so severe that patients require exogenous insulin therapy to avoid the rapid decline into cachexia, dehydration, ketoacidosis and death that was the inevitable consequence of this disease before the discovery of insulin by Banting and Best in 1921. Dietary measures cannot prevent this problem, although they may delay its onset, and survival for several years in the pre-insulin era with harshly restrictive hypoketotic diets was not unknown. Withdrawal of exogenous insulin therapy in patients with type 1 diabetes usually results in ketoacidosis within 48 h, and this may supervene in less than 12 h when insulin has previously been administered intravenously (and therefore cleared within minutes with no depot effect) and in conditions of increased insulin requirement or counter-regulatory response such as systemic sepsis.
The severity of type 1 diabetes is such that most patients come to medical attention within weeks or, at most, months of onset, whereas the onset of type 2 diabetes is usually more insidious, so it may be present many years before diagnosis. Although the condition (including latent autoimmune diabetes of adults, LADA, see below) can present at any age, most patients present in childhood and the diagnosis becomes rare after 30 years of age. However, the distinction between types 1 and 2 diabetes is not always clear-cut and it is not always possible to categorize patients on clinical grounds alone, even after a detailed history taking into account such factors as the duration of symptoms and degree of weight loss, so that in some patients additional investigations are required to establish the correct diagnosis. Latent autoimmune diabetes of adults is a rare subtype of type 1 diabetes. Affected individuals tend to develop diabetes more insidiously and appear to respond, at least initially, to treatments other than insulin such as sulfonylureas. Some patients with autoimmune type 1 diabetes, even though they may have presented with ketoacidosis, retain sufficient islet cell reserve for some months after the diagnosis to remain ketosis free on little or even no insulin (the so-called ‘honeymoon period’). Conversely, some patients with type 2 diabetes may become ketosis prone as β-Cell failure progresses from being relative to being absolute in the face of islet cell exhaustion or destruction, particularly in conditions of increased insulin requirement such as systemic sepsis. The ‘accelerator hypothesis’ of type 2 diabetes predisposing to type 1 diabetes via islet cell stress, and the high prevalence of the co-aggregation of features of both type 1 and type 2 diabetes is discussed above in relation to childhood onset diabetes.
Where confirmation of type 1 (autoimmune) diabetes is required, quantification of anti-glutamic acid decarboxylase (GAD) antibodies and/or islet cell antibodies (ICA) may be helpful. However, these antibodies may be detectable in healthy individuals (~ 2%), and the likelihood of a positive result in true autoimmune diabetes declines from > 85% at disease onset to negligible rates after 10–15 years of disease. Although normal basal or glucagon-stimulated concentrations of C-peptide (the normal response is a doubling of C-peptide concentration 6–20 min after glucagon 1 mg i.m.) rule out the existence of severe absolute insulopaenia at the time of the test, negative results are potentially harder to interpret, as endogenous insulin secretion may have been suppressed by long-term treatment with exogenous insulin.
Individuals who do not have diabetes but who have detectable anti-GAD or ICAs may be at increased future risk of developing type 1 diabetes (and other autoimmune conditions). Several studies have attempted to determine whether intervention with immunosuppressive therapy reduces this risk in those at highest risk (usually first-degree relatives of people with type 1 diabetes, with high-risk genotype and positive antibodies), or helps to preserve any residual β-Cell function at the time of diagnosis. Thus far, the side-effects of the drugs used would appear to outweigh their benefit, although some delay in progression to complete insulin deficiency has been demonstrated, at least in some of the studies.
Aetiology: genetic susceptibility and possible environmental cofactors
Type 1 diabetes typically results from an autoimmune attack upon pancreatic β-Cells. It is not understood what factors may trigger the attack. Although viral infection can provoke the attack (as seen clearly with congenital rubella), for most patients it is not clear what factor(s) is/are responsible. In those patients with other autoimmune diseases (e.g. Addison disease, autoimmune thyroid disease, coeliac disease), it appears that the attack on the pancreas is part of a multiorgan or polyglandular process. It is marked by systemic indices of the autoimmune process such as circulating islet cell autoantibodies (which, when in high titre, may be complement fixing) and changes in circulating T and B lymphocyte subsets. The process of β-Cell destruction usually takes many months and occurs in cycles of deterioration and remission. The acute presentation of type 1 diabetes mellitus usually occurs during an acute deterioration of β-Cell function, the disorder frequently being unmasked by an intercurrent illness. After the patient recovers from the intercurrent illness, adopts a suitable diet and is treated with exogenous insulin, there is often a temporary period of improved β-Cell function, known clinically as the ‘honeymoon period’, during which glycaemic control may be relatively easily maintained. This honeymoon period typically lasts six, but occasionally up to 24 months, and β-Cell function may be misleadingly good during this period.
Subsequently, insulin and C-peptide secretion are almost completely lost (maximal C-peptide response following a glucose load < 0.5 μg/L); however, the degree of any residual β-Cell function may determine the ease with which good glycaemic control can be achieved with exogenous insulin therapy.
Although β-Cell destruction is the cause of type 1 diabetes mellitus, secondary metabolic defects occur, including resistance to exogenous insulin, although this is more commonly seen in type 2 diabetes mellitus. There are a number of mechanisms for this, including the development of anti-insulin antibodies (relatively rare with synthetic human insulins) and abnormal body composition due in part to the peripheral administration of insulin, or because the individual is predisposed to insulin resistance by the genetic and morphological factors that also operate in type 2 diabetes mellitus. These morphological factors are becoming increasingly common with the worldwide increase in obesity, which affects individuals with type 1 diabetes as well as those without.
Certain genetic markers are associated with a high prevalence of type 1 diabetes. Most of these are found on chromosome 6, in genes related to histocompatibility linked antigens (HLAs), which together probably account for about half the genetic risk, although recent genome-wide association studies have identified several other markers of risk. Some of the associations are listed in Table 15.5. Most type 1 diabetes associated with HLA-DR4 presents in childhood while that associated with HLA-DR3 has a more variable age of onset.
TABLE 15.5
Genetic associations with type 1 diabetes mellitus
| Allele | Chromosome | Notes |
| HLA-DR3 | 6 | Relative risk = × 5 |
| HLA-DR4 | 6 | Relative risk = × 7 |
| HLA-B8, B15 and B18 | 6 | Due to linkage disequilibrium with DR3 and DR4 |
| HLA-DQR4 | 6 | Relative risks up to × 90 |
| Insulin gene | 11 | |
| T cell receptor | ? | Importance disputed |
| Ig heavy chain | 14 | Importance disputed |
| Kidd blood group | 18 |
Type 2 diabetes mellitus
Introduction: the heterogeneity of type 2 diabetes
Type 2 diabetes mellitus is the commonest form of diabetes mellitus worldwide. It is often considered a diagnosis of exclusion, that is, patients are assumed to have type 2 diabetes because they do not demonstrate the typical features of type 1.
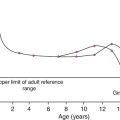
Type 2 diabetes is probably not a single condition. In all patients with the condition, there is both insulin resistance and relative insulin deficiency. Some patients with late onset diabetes initially presumed to be type 2 will turn out to have type 1 (latent autoimmune diabetes in adults, LADA). With time (over perhaps 5–15 years from diagnosis), glycaemic control in type 2 patients usually becomes more difficult to achieve; insulin deficiency becomes more apparent and a subgroup of patients becomes prone to ketosis. Data from the UK Prospective Diabetes Study (UKPDS) trial suggested that the average time to insulin use was approximately seven years from diagnosis of type 2 diabetes, and confirmed the clinical impression of a progressive rather than static disease process. The typical patient with type 2 diabetes mellitus is overweight (average BMI at presentation > 27 kg/m2), with a central distribution of obesity (most conveniently assessed by waist circumference or waist:hip ratio) conferring risk that is independent of and additional to that of elevated body mass index (BMI). The age-adjusted relative risk for diabetes begins to increase at values of BMI that are considered normal based on mortality risk (24 kg/m2 for men, 22 kg/m2 for women), and rises exponentially as BMI rises (Fig. 15.4). The marked increase in the prevalence of obesity is an important contributor to the increased prevalence of type 2 diabetes. Increases in abdominal fat mass, weight gain since young adulthood and a sedentary lifestyle are additional obesity-related risk factors for diabetes. In some ethnic groups (particularly those from parts of south Asia), the risk of diabetes may be higher at lower levels of obesity.
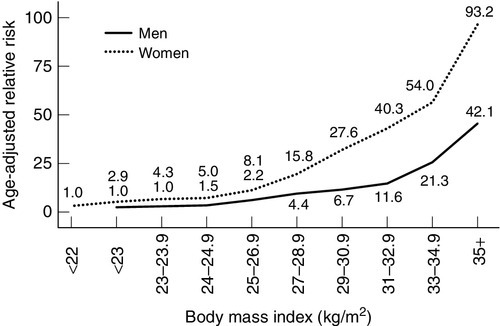
FIGURE 15.4 Relationship between BMI and risk of type 2 diabetes. The risk of diabetes increases with increasing BMI values in men and women.
Other independent environmental risk factors include being born to a mother with gestational diabetes mellitus, being of exceptionally high birth weight and being of exceptionally low birth weight. The latter is postulated by the ‘Barker hypothesis’ to predispose to diabetes and obesity by, among other things, switching on ‘thrifty’ genes to counter the effects of intrauterine malnutrition.
Leaner patients with type 2 diabetes tend to show more severe insulin deficiency. Greater degrees of obesity are associated with more insulin resistance. A major unresolved controversy of type 2 diabetes remains whether, for the typical type seen in Europid individuals, the prime defect in glucose homoeostasis is insulin deficiency or insulin resistance or both. Given that many individuals with severe insulin resistance do not have diabetes and that some patients with type 2 diabetes have little insulin resistance, it is probably true to say that insulin resistance is neither a necessary nor sufficient cause: rather, some degree of β-Cell dysfunction (whether as an inherited tendency or as a result of reduced β-Cell function as part of a degenerative process) is the sine qua non of type 2 diabetes. Such β-Cell dysfunction may take the form of a relative lack of insulin secretion or of abnormal patterns of insulin secretion. Such abnormalities have been described in patients who later developed type 2 diabetes, and include changes in the amplitude and frequency of insulin secretory pulses and the loss of first-phase insulin secretion (the initial pulse of insulin secretion seen after a meal or glucose tolerance test), with prolongation and augmentation of the second phase (the later response seen after a meal). These abnormalities of insulin secretion are reversible after certain forms of bariatric surgery for morbid obesity in patients with type 2 diabetes.
Population studies indicate that the concurrent existence in an individual of both a cause for insulin resistance (usually obesity) and of a relatively low insulin secretory reserve predicts the later onset of type 2 diabetes mellitus.
The differentiation of idiopathic type 2 diabetes and ‘secondary’ diabetes can be difficult. Secondary diabetes is a term that implies that another disease process has caused the diabetes (see Box 15.4). While there is good understanding of the natural history and approach to treatment in type 2 diabetes, there is less for secondary diabetes: occasionally, the diabetes can be improved significantly by treating the primary condition.
Genetic factors in type 2 diabetes mellitus
Family studies suggest that type 2 diabetes mellitus is strongly inheritable. Concordance rates for identical twins exceed 90%. Some racial groups have a very high incidence of type 2 diabetes. Notable examples of this include the Pima Indians of Arizona and Pacific Islanders, with prevalence rates of up to 50%. In the UK, the prevalence of type 2 diabetes in people of South Asian extraction is approximately two or three times that in people of European origin. African-Caribbean people show an intermediate prevalence. The natural history of type 2 diabetes and its propensity to give rise to long-term complications varies between races (examples being the relative lack of diabetic foot disease in British Asians and the high prevalence of diabetic nephropathy among those of African-Caribbean descent).
In the majority of patients with type 2 diabetes, the pattern of inheritance suggests a polygenic disorder, with an important role for environmental factors such as obesity and a low level of exercise.
Molecular biological techniques have not yet shown type 2 diabetes to be consistently associated with any abnormalities of the DNA coding of insulin, the insulin receptor or glucose transporter peptides, except in a small percentage (< 1%) of cases. Abnormalities of the glucokinase gene and of certain hepatic nuclear factor genes have been shown to cause some cases of maturity onset diabetes of the young (MODY) (see p. 292), but not typical type 2 diabetes mellitus. More recent genome wide association studies have identified several predisposing genetic factors; most of these appear to relate to β-Cell function, but interestingly the strongest factor yet identified (the FTO gene, which is expressed in the hypothalamus and thought to be involved in body weight regulation), appears to increase diabetes risk by predisposing to a higher body weight; homozygotes for the predisposing gene variant are on average 3 kg heavier than those without.
Glucoregulatory defects in type 2 diabetes mellitus
The exact cause(s) of type 2 diabetes mellitus is (are) unknown. Hyperglycaemia is due to elevated hepatic glucose output and, to a lesser extent, failure of skeletal muscle to take up glucose and store it as glycogen. Although many factors are believed to contribute to these two defects, they can broadly be categorized into three groups: β-Cell deficiency/dysfunction, insulin resistance and abnormalities of non-insulin-mediated glucose disposal. It is also perhaps useful to indicate that, although only abnormal concentrations are observed in clinical practice, fluxes can be measured in research studies, and some of these are indicated in Table 15.6.
TABLE 15.6
Some comparisons of concentrations and fluxes in obesity/insulin resistance syndrome/early type 2 diabetes
| Substance or process | Concentrations | Fluxes |
| Glucose | Increased fasting concentration | Normal whole body disposal rate Normal whole body glucose production and clearance |
| Non-esterified fatty acids | Variable | Usually normal fasting total body production Impaired responsiveness to meal |
| Very low density lipoproteins | Increased concentration | Increased production, increased plasma half-life and increased whole body clearance |
| Oxidation of fuels | Whole body respiratory quotient (RQ) reflects diet | Whole body RQ reflects diet but RQ is lower in obese subjects |
Pancreatic β-Cell deficiency/dysfunction in type 2 diabetes mellitus
The importance of β-Cell deficiency varies between different groups and different individuals with type 2 diabetes mellitus. Abnormalities of insulin secretion are present in all patients, but the causes(s) of these defects is/are not yet established. Nor is it yet clear whether an abnormality of insulin secretion is usually the primary aetiological defect or whether other glucoregulatory defects are secondary to this pancreatic defect. Several workers have suggested that β-Cell dysfunction is the primary abnormality of type 2 diabetes, but that β-Cell dysfunction may be more subtle than that seen in type 1 diabetes.
Insulin deficiency has been described in type 2 diabetes mellitus, but may sometimes be due to misclassifying a late onset type 1 patient. Some patients with type 2 diabetes can exhibit both insulopaenia and hyperinsulinaemia (relative to normal weight controls) at different times during a single day. Some, especially obese subjects with mild glucose intolerance, may have hyperinsulinaemia throughout the whole 24 h. Other patients, usually those who are less obese, resemble patients with late onset type 1 diabetes mellitus and have absolute insulin deficiency throughout. Fortunately, the accurate distinction between insulin-deficient type 2 diabetes mellitus and late onset type 1 diabetes mellitus rarely has significant implications for the clinical management of individual patients.
Patients with type 2 diabetes mellitus most frequently show hyperinsulinaemia during fasting, combined with reduced β-Cell reserve, relative to healthy subjects. The time course of insulin secretion in type 2 diabetes is abnormal: subjects typically exhibit relative insulin deficiency during both the early phase of insulin secretion after an oral glucose load or meal and the first-phase insulin response to an intravenous glucose load. This loss of early insulin response to glucose is paralleled by defects in the pulsatility of insulin secretion.
Assuming insulin clearance to be normal in such (hyperglycaemic) type 2 diabetes patients, hyperinsulinaemia implies hypersecretion of immunoreactive insulin compared with healthy (euglycaemic) subjects. However, secretion of insulin by β-Cells is dependent on the prevailing blood glucose concentration as well as several other factors. Thus, the level of insulinaemia can be considered a reflection of β-Cell function only if it is considered in relation to the blood glucose concentration. The hyperglycaemic drive to the islets may compensate or even overcompensate for β-Cell dysfunction, producing near-normal or even supranormal insulin concentrations. In the 1990s, it became clear that conventional radioimmunoassays for insulin failed to distinguish mature insulin from proinsulin and partially split proinsulins. Since the precursor molecules have much less biological activity than mature insulin, conventional radioimmunoassays had probably been overestimating the degree of insulinaemia typically found in type 2 diabetes. However, even modern specific assays do confirm at least some degree of hyperinsulinaemia in obese type 2 patients with milder degrees of hyperglycaemia.
With increasing time, even patients who were hyperinsulinaemic at diagnosis usually become relatively insulin deficient. This group of patients, together with those who are insulin deficient from diagnosis, often need exogenous insulin treatment to maintain near-normal glycaemia. They may then be termed ‘insulin-treated’ or ‘insulin-requiring’, but it should be recognized that such insulin-treated patients form a heterogeneous group, very different in character from type 1, insulin-dependent patients.
Amylin
Amylin (also known as islet amyloid polypeptide, IAPP) is a 39-amino acid peptide co-secreted with insulin by β-Cells in all subjects with intact insulin secretion, but not those with type 1 diabetes. The amino acid structure has some homology with calcitonin gene-related peptide. Plasma concentrations of amylin are very low (<10−10 molar) in both diabetic and non-diabetic subjects. There is no established physiological role for the peptide in the systemic circulation, but it has been suggested that amylin may have a physiological role in the regulation of insulin secretion within pancreatic islets or some effects on bone metabolism. Possible pathophysiological roles of amylin include the induction of insulin resistance in skeletal muscle, but this only occurs at pharmacological concentrations. Amylin fibrils (with typical amyloid features of secondary protein structure and insolubility) are deposited in islet cells in conditions of excess insulin secretion (such as insulinoma), and in situations where insulin secretion may initially have been increased but has subsequently declined (such as in old age and type 2 diabetes). The possible role of amylin in the islet damage of type 2 diabetes is under intensive investigation.
Insulin resistance in type 2 diabetes mellitus
In 1970, Berson and Yalow defined insulin resistance as ‘a state in which greater than normal amounts of insulin are required to elicit a quantitatively normal [glucose] response’. The concept of insulin resistance had been suggested in the 1930s when Himsworth noted that the same amount of exogenous insulin injected into different diabetic subjects had different antihyperglycaemic effects. Those with lesser antihyperglycaemic responses were labelled insulin insensitive (or insulin resistant). When early assays showed that many patients with type 2 diabetes had high concentrations of circulating insulin as detected by radioimmunoassay, the concept of insulin resistance was reinforced. These patients were hyperglycaemic, and hence by definition relatively insulin deficient, yet they actually appeared to have more immunoreactive insulin than other people so that their true insulin requirement was believed to be larger still. Hyperinsulinaemia with eu- or hyperglycaemia is generally taken to indicate insulin resistance, since hyperinsulinaemia produces hypoglycaemia in subjects with normal insulin sensitivity. The type 2 patients who apparently needed supranormal amounts of insulin were seen to be the same group that Himsworth had found to be insulin resistant.
As insulin has several actions, resistance can take several forms. It appears that some subjects show resistance to its hepatic effects while some show resistance to its effects on skeletal muscle (activation of muscle glycogen synthase by insulin is often defective), and some show resistance to liporegulatory effects, the degree of resistance being different for different actions of insulin. There is no consensus as to the cellular mechanisms underlying insulin resistance in most patients with type 2 diabetes, though several have been suggested (see Fig. 15.2). Some workers have highlighted the competition between lipids and glucose as metabolic fuels (the glucose–fatty acid cycle (Randle cycle) hypothesis): it can be shown experimentally that high circulating concentrations of alternative fuels such as triglycerides, NEFA, lactate and ketone bodies compete with glucose for uptake and that, in their presence, glucose clearance is reduced. Others have suggested that insulin resistance is a consequence of ‘cellular satiety’, seen whenever intracellular sensors such as uridine diphosphate (UDP)-glucosamine detect excess energy supply, and other workers have implicated specific cellular abnormalities such as reduced numbers of insulin receptors, reduced receptor function, dysfunction of second messenger systems and intracellular antagonists of the effects of insulin.
Abnormalities of non-insulin-mediated glucose disposal in type 2 diabetes mellitus
As discussed above, most glucose clearance from the plasma occurs independently of insulin. This process, largely via GLUT1, is defective in type 2 diabetes, and contributes to hyperglycaemia, although the mechanism is uncertain. Changes in tissue blood flow in diabetes, particularly within skeletal muscle, may also reduce clearance of plasma glucose.
Associations of type 2 diabetes mellitus
The metabolic syndrome and obesity
Type 2 diabetes mellitus often occurs in patients with a syndrome of morphological and metabolic abnormalities together with associated conditions that has been termed the metabolic syndrome (also known as ‘Reaven syndrome’, ‘syndrome X’ or the ‘hyperinsulinaemia syndrome’). The features include insulin resistance, dyslipidaemia, obesity (particular abdominal obesity) and hypertension among others. Unfortunately, there have been multiple definitions of these syndromes (e.g. different factors, different combinations of factors and different cut-offs for their definition) and no consensus has been reached. However, these syndromes all reflect co-segregation of factors in patients with type 2 diabetes mellitus and those with lesser degrees of glucose intolerance, as well as in individuals with normal glucose tolerance. Subjects with metabolic syndrome, with or without diabetes, have an increased predisposition to atherosclerosis, and subjects with glucose intolerance (type 2 diabetes mellitus or IGT) have an increased predisposition to atherosclerosis mediated by these associated risk factors. However, identifying metabolic syndrome itself has no unique implications for clinical management: this should focus on the management of the obesity (hence insulin resistance) and the individual cardiovascular risk factors. Some workers specifically exclude obese subjects from this syndrome, but there are many features in common between slim subjects with the metabolic syndrome and those who are obese.
The natural history of type 2 diabetes usually involves an evolution from normal glucose tolerance through impaired glucose tolerance (usually accompanied by other features of insulin resistance syndromes) to the onset of frank diabetes, followed by a continuing β-Cell failure leading to the need for exogenous insulin (Fig. 15.5). Obesity, low physical fitness or other hereditary factors can all hasten this evolution.
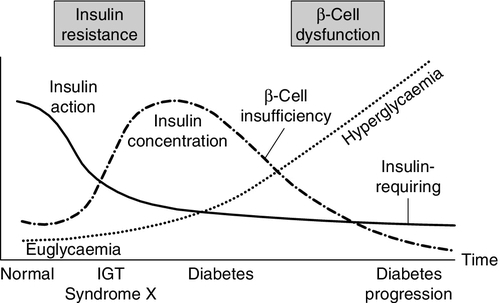
FIGURE 15.5 The natural history of type 2 diabetes. (From DeFronzo et al. Diabetes Care 1992; 15:318, with permission).
The morphological associations of type 2 diabetes mellitus include shorter stature (by 1–4 cm compared with non-diabetic subjects), with obesity of the android type (also known as ‘apple’, upper body, central or visceral obesity) marked by a high waist:hip ratio, low capillary density in skeletal muscle and high ratios of slow to fast twitch muscle fibres. Insulin resistance is a prominent feature of obesity, especially of the android type, even in the absence of diabetes, and obesity powerfully identifies individuals within a population at greatest risk of developing type 2 diabetes. Compensatory hyperinsulinaemia is marked in obesity and contributes to the associated dyslipidaemia and probably to the hypertension.
Hypertension
The association between diabetes and hypertension has been long recognized and is strong. The prevalence of hypertension in obese patients with type 2 diabetes approaches 50% in some series. The typical body habitus of patients with type 2 diabetes is associated with hypertension even in non-diabetic subjects. Although diabetic patients are liable to develop the same secondary forms of hypertension as the non-diabetic population (and renal artery stenosis is commoner in diabetes), most diabetic hypertensive patients have a low renin hypertension that is unlike that in non-diabetic patients with essential hypertension.
Patients with either type 1 or type 2 diabetes and hypertension and characteristically have sodium retention and impaired natriuresis: exchangeable body sodium is increased by an average of 10%. This abnormality is seen even before the development of any clinically detectable complications of diabetes. Possible sodium-retaining mechanisms include hyperinsulinaemia induced overactivity of tubular sodium transporters, increased glomerular filtration of glucose leading to enhanced proximal tubular sodium–glucose cotransport, extravascular shift of fluid with sodium and, in later stages, renal impairment. Plasma renin activity, angiotensin II, aldosterone and catecholamine concentrations are usually normal in glycaemically well-controlled type 1 and type 2 patients. On the other hand, plasma natriuretic peptide concentrations are usually increased, and an exaggerated vascular reactivity to noradrenaline (norepinephrine) and angiotensin II is common even in uncomplicated types 1 and 2 diabetes.
In type 1 diabetes, hypertension is strongly linked with the development of diabetic nephropathy. Although it is uncertain whether this is initially cause or effect, it becomes a vicious circle. There appear to be familial effects, with non-diabetic relatives of diabetic nephropathic hypertensive patients showing defects in ion transport function (erythrocyte Na+/Li+ counter transport and leukocyte Na+/H+ antiport) and an increased liability to develop essential hypertension.
Data from the UKPDS confirm the clinical impression that hypertension in type 2 diabetes is often refractory to treatment. Typically, a combination of three antihypertensive agents was required to maintain good control of blood pressure. Furthermore, the same study showed that even a modest reduction in blood pressure reduced the incidence of nephropathy and death. The relationship between blood pressure and the development and progression of diabetic nephropathy was particularly striking.
Dyslipidaemia
Diabetes is strongly associated with abnormalities of lipid metabolism. Several mechanisms are postulated for these associations. The obesity and body fat distribution common in type 2 diabetes is itself linked with dyslipidaemias in non-diabetic subjects. Non-enzymatic glycation of apolipoproteins impairs lipoprotein clearance. Insulin is the principal antilipolytic regulator, through its inhibition of hormone-sensitive lipase. This enzyme breaks down adipose tissue triglyceride and consequently mobilizes fat stores for subsequent utilization. As a result of its regulation by insulin, hormone-sensitive lipase is most active in the fasting state and least so upon feeding. In diabetes, insulin-mediated inhibition is attenuated or lost, so breakdown of fat stores carries on even if food is available. The uncontrolled release of free fatty acids is followed by their uptake by the liver in a simple concentration-dependent manner.
Free fatty acids are metabolized by β-oxidation, but once their concentration exceeds capacity for oxidation they are re-esterified with glycerol to form triacylglycerol (triglyceride) which leads to increased rate of synthesis (and thereby release) of triglyceride-rich very low density lipoprotein (VLDL). Peripheral VLDL-triglyceride clearance may be impaired because insulin is needed to synthesize and secrete lipoprotein lipase, the principal enzyme responsible for clearing VLDL-triglyceride.
Type 2 diabetes mellitus is associated with low plasma concentrations of high density lipoprotein (HDL), which, by acting as an antioxidant, may limit the lipid peroxidation that is one of the factors responsible for atheroma formation. This may contribute to increased cardiovascular risk in diabetes, but high VLDL-cholesterol and elevated triglyceride concentrations may also contribute. Total plasma cholesterol concentration is often normal in type 2 diabetes, but the HDL:LDL and HDL:total cholesterol ratios are usually low. The composition of VLDL changes such that it contains more triglyceride and cholesteryl esters relative to the apoprotein content. The size distribution of LDL changes towards smaller, denser particles. These abnormalities are particularly atherogenic and underline the need to consider the whole lipid profile rather than just total or LDL-cholesterol in the dyslipidaemia of type 2 diabetes. Improved glycaemic control only partly improves these lipid abnormalities.
In type 1 diabetes, poor glycaemic control is typically associated with high plasma concentrations of VLDL-cholesterol, LDL-cholesterol and triglycerides, and sometimes with low HDL-cholesterol. The triglyceride concentration falls in response to improved glycaemic control and the abnormalities of VLDL and LDL usually also improve. In contrast to patients with type 2 diabetes, those with well-controlled type 1 diabetes usually achieve plasma lipid concentrations similar to those seen in non-diabetic groups; HDL concentrations may even be elevated.
Lipotoxicity and glucotoxicity
Lipotoxicity
Although adipose tissue is now known to have a large number of important functions, related, for example, to thermo-insulation, immunity, fertility and protection of tissues such as the eye in the orbit, its main function is the storage of energy in the form of triglycerides in the postprandial state and the subsequent release of lipid in the form of NEFA in the fasting state. The consequences of accumulation of lipids in lean tissues, as observed in fatless rodents and humans with generalized lipodystrophy, include hepatic steatosis, lipid-induced cardiomyopathy, insulin resistance and type 2 diabetes mellitus. This process is termed lipotoxicity (lipoapoptosis, where programmed cell death occurs) and is reversible in fatless rodents by the transplantation of small amounts of normal adipose tissue, but not by transplantation of adipose tissue from ob/ob mice, which lack the ability to secrete leptin. In humans with generalized lipodystrophy, long-term treatment with leptin improves insulin resistance, hyperlipidaemia and hepatic steatosis dramatically.
Non-esterified fatty acids can induce insulin resistance in muscle via at least three putative mechanisms: through the glucose–fatty acid cycle, whereby increased intracellular citrate derived from fat leads to diversion of glucose away from the tricarboxylic acid; through an effect of intermediates such as diacylglycerol that increase the activity of protein kinase C activity, thereby phosphorylating and inactivating the insulin receptor and insulin receptor substrate (IRS)-1, and via activation of the NFκB transcription factor pathway, which has putative vascular effects that might contribute to the observed increase in vascular damage that precedes hyperglycaemia. In the liver, NEFAs inhibit the suppression of glycogenolysis by insulin. Other mechanisms include modulation of adipokines, such as tumour necrosis factor α (TNFα), which could promote insulin resistance, or adiponectin, which reduces it. The question then arises of why it is that so many individuals with obesity and elevated plasma concentrations of NEFA do not develop diabetes. One explanation for this may lie in the fact that NEFAs are potent stimulators of insulin secretion in healthy individuals, an effect that might mitigate the tendency for NEFAs to induce insulin resistance. However, both in subjects with type 2 diabetes and their normoglycaemic first-degree relatives, NEFAs do not induce a sufficient compensatory rise in insulin secretion to overcome the induced insulin resistance. Thus NEFAs may be able to cause diabetes in those with a genetic predisposition to β-Cell dysfunction but not in those with normal β-Cell reserve. Activators of PPARγ (see p. 315) may alleviate several of these NEFA-induced abnormalities by reducing plasma NEFA concentrations, increasing adiponectin and redistributing fat from visceral to subcutaneous deposits, thus reducing the direct effects on the liver and elsewhere. Lipotoxicity may also contribute to β-Cell dysfunction – accumulation of lipid droplets has been observed in the islets in rodent models of obesity and diabetes, and these may both interfere with insulin secretion and promote an inflammatory response leading to β-Cell destruction.
Glucotoxicity
It has long been known that acute elevation of plasma glucose concentrations to very high levels is able to induce a state of insulin resistance characterized by impairment of insulin secretion in response to glucose. Elevation of plasma glucose to concentrations just above the physiological range potentiates insulin secretion in both humans and animals when transient and in the presence of a normal β-Cell mass, but reduces it otherwise. Conversely, strict metabolic control is able to induce improvements in both insulin secretion and sensitivity, although not usually to normality. It is likely that multiple mechanisms contribute to this effect, including changes in the Km of glucose sensing systems such as glucokinase/hexokinase, which may lead to alteration of the dose–response curve of islet cells to blood glucose concentrations, changes in the ratios of proinsulin to insulin secretion and alteration in the functional activity of the membrane sulfonylurea-sensitive K+ channel. It is likely that the honeymoon period often observed in new onset type 1 diabetes is at least partly attributable to a reduction in glucotoxicity.
Prevention studies in type 2 diabetes
Type 2 diabetes may be prevented, or at least its onset delayed, by relatively modest degrees of weight loss. In four intervention studies, conducted in the USA, Finland, China and India in patients with impaired glucose tolerance, lifestyle interventions resulting in average weight loss of <7 kg over six months, with some later regain, resulted in up to 58% reduction in the cumulative incidence of diabetes in the intervention groups over periods of up to four years. Other studies have shown that adopting a more physically active lifestyle appears to confer useful protection, independently of body weight. For patients unable to lose weight after appropriate lifestyle interventions, treatment with metformin may bring about a modest reduction in the incidence of type 2 diabetes. Other diabetes treatments, including acarbose, thiazolidinediones and the weight loss drug orlistat also reduce progression to diabetes in those a greatest risk.
The role of bariatric surgery in managing type 2 diabetes
Weight loss is the cornerstone of the management of overweight and obese subjects with type 2 diabetes. Increasingly, patients are being considered for bariatric surgery after other methods of weight control have proved fruitless. Whereas the time course and degree of improvement in diabetes are more or less in line with predictions based on the degree of postoperative weight loss resulting from operations that physically limit food intake, such as laparoscopic gastric banding, the effects of gastric and intestinal bypass procedures appear to be quite different. Not only have improvements in glycaemia been reported well before weight loss becomes apparent, but they appear also to exceed those expected on the basis of the amount of weight lost. It has been proposed that increased secretion of a number of gut peptides with insulinotropic actions such as glucagon-like peptide-1 (GLP-1) and glucose-dependent insulinotropic peptide (GIP), and decreased secretion of orexigenic peptides such as ghrelin may be responsible for the success of bypass techniques, raising the intriguing possibility that operations of this kind have a partly endocrine mechanism of action. Many studies have purported to show ‘cure’ of diabetes, often associated with restoration of first-phase insulin response, in up to 80% of subjects for as long as 16 years of follow-up. However, more recent prospective studies suggest that the true rate of remission of type 2 diabetes after bariatric surgery is closer to 40%, with those patients with shorter duration of diabetes, and lower requirements for glucose-lowering drugs most likely to remain free of the need for treatment for many years. Long-term studies comparing surgery with optimal medical treatment are really needed to resolve the question as to whether surgery is a better treatment.
Gestational diabetes mellitus
The study of diabetes occurring in association with pregnancy has been characterized (and hampered) by the local adoption of many different criteria for the diagnosis of gestational diabetes, coupled with different recommendations for screening. Such local diversity is probably a consequence of different levels of provision of care for pregnant women, and the balance between the unnecessary labelling of a pregnancy as ‘abnormal’ or ‘high risk’ and the avoidance of preventable risk to mother and fetus.
Gestational diabetes mellitus (GDM) was defined by Lowy as glucose intolerance that presents in pregnancy. However, it must be appreciated that this will group together a number of conditions that are associated with a variety of qualitative and quantitative threats to the pregnancy. The offspring of women who have undiagnosed pre-existing type 2 diabetes discovered during pregnancy will, for example, have been exposed to hyperglycaemia and other metabolic abnormalities in the first trimester of pregnancy during which organogenesis occurs. They will therefore be subject to the increased risk of fetal malformation seen in pre-existing diabetes despite the diabetes being labelled ‘gestational’. When the glucose intolerance is induced by the pregnancy itself, its onset is typically in the late second or early third trimester, and the risks of major fetal malformations are therefore similar to those in the non-diabetic population.
The reported incidence of GDM varies enormously between populations, not least because of local differences in screening procedures and definition. The recommendations of the UK National Institute for Health and Care Excellence (NICE) for screening and diagnosis of diabetes during pregnancy are shown in Box 15.5.
Glycaemic control during pregnancy should be strictly optimized in order to minimize fetal mortality and morbidity. In patients with type 1 diabetes who are attempting to conceive, similarly strict glycaemic control (together with folic acid supplements) is believed to reduce the incidence of congenital malformations. One large UK study showed, in an unselected population, that the infants of women with type 1 diabetes have a ten-fold greater risk of a congenital malformation and a five-fold greater risk of being stillborn than those from a representative general population. These effects are reduced but not abolished by pre-pregnancy counselling, the use of folic acid and tight glycaemic control prior to conception and throughout pregnancy. Local targets for glycaemic control vary, but most would agree that, at the least, all overnight fasting and preprandial blood glucose concentrations should be <7 mmol/L during pregnancy. In practice, many adopt targets for overnight fasting concentrations of <5.9 mmol/L and 1 h postprandial glucose concentrations of <7.8 mmol/L, in both pre-existing diabetes and gestational diabetes. Although the use of oral hypoglycaemic agents appears to be safe, they are at present not licensed for use in pregnancy, although they are recommended by many guidelines (including NICE in the UK), on the basis of a published evidence base supporting the use of both metformin and glibenclamide in pregnancy. Glibenclamide does not appear to cross the placental barrier and thus does not cause neonatal hypoglycaemia, but may cause maternal hypoglycaemia, so should be used with caution.
Despite the above, insulin treatment remains the gold standard in all forms of gestational diabetes, despite the fact that, at the time of writing, no insulin is licensed for such use. As with diabetes not associated with pregnancy, many regimens have been used with success and there is no single recommended regimen. However, the predominantly postprandial nature of the glycaemic derangements in GDM lend themselves to treatment with short-acting insulins at meal times, supplemented if necessary with a long-acting insulin, and such regimens usually prove satisfactory.
In patients with pre-existing diabetes, particularly where complicated by microvascular disease, retinopathy and neuropathy may advance rapidly during pregnancy, and screening by fundoscopy and for microalbuminuria in each trimester is probably warranted. Angiotensin-converting-enzyme inhibitors are teratogenic and should be discontinued during pregnancy.
The timing and mode of obstetric delivery merits consideration in pregnancies complicated by diabetes. Again, there is a lack of clear evidence, but many would advocate intervention at around 38 weeks in cases where diabetes was present prior to pregnancy, to reduce the risk of late placental failure; this occurs in approximately 1–2% of pregnancies, presenting with sudden and apparently unexpected late intrauterine fetal death (sometimes manifest by a sudden improvement in glycaemic control).
Gestational diabetes or delivery of a large-for-dates or macrosomic baby is strongly predictive of subsequent type 2 diabetes, and many recommend screening such women for type 2 diabetes mellitus six weeks after delivery, and periodically (every 1–2 years) thereafter.
Maturity onset diabetes of the young (MODY)
This syndrome is a rare (<5% of childhood diabetes and <1% of all type 2 diabetes) form of type 2 diabetes, inherited in an autosomal dominant fashion and typically presenting at a young age. It is sometimes known as ‘Mason-type’ diabetes after the index family. Strict diagnostic criteria for the condition include a diagnosis of type 2 diabetes (with preservation of C-peptide response) with onset before the age of 25 years in at least two family members, with evidence of vertical transmission through at least three generations. In clinical practice, it may not always be possible to ensure that all these criteria are met. Thus, many patients with a probable diagnosis of MODY will not fulfil the criteria by virtue of later age of onset (at least 25% present later than 25 years of age), the occurrence of new mutations and incomplete family histories.
All the six known MODY subtypes are characterized by defects in insulin secretion rather than in insulin action, although, in some, a degree of insulin resistance may supervene, probably as a result of glucotoxicity. They have been characterized as being due to mutations in genes encoding glucokinase (MODY 2) or a range of transcription factors that result in defects in insulin secretion. In patients with MODY1, abnormalities in hepatocyte nuclear factor 4a (HNF-4A) result in impaired or absent first-phase insulin secretion, reduced peaks of insulin secretion, hyperglycaemia, a degree of secondary insulin resistance reversible by good metabolic control and fully susceptibility to the complications of diabetes expected for the degree of exposure to hyperglycaemia. In contrast, patients with MODY 2 have mild fasting hyperglycaemia, as a result of the defect in glucose sensing that correlates with the degree of functional inactivation of the enzyme. MODY 2 is associated with low risk of microvascular complications of diabetes and thus often does not require treatment. The condition often only comes to light as a chance finding. These patients are characteristically highly sensitive to sulfonylurea treatment, if used. As predicted by the actions of glucokinase in the liver, hepatic glycogen production is reduced and gluconeogenesis increased in the postabsorptive state in this condition.
Mutations in the HNF-1A gene that encodes hepatocyte nuclear factor 1a (HNF-1A) (MODY 3) account for up to two-thirds of all MODY diagnoses. This condition has a variable age of onset, and progressive β-Cell dysfunction that leads to potentially severe hyperglycaemia and similar microvascular complications to those encountered in type 2 diabetes. Abnormal HNF-1A function in the proximal renal tubules may lead to incomplete reabsorption of glucose, phosphate and amino acids, but nephropathy appears no more common than would be expected for the degree and duration of hyperglycaemia. These patients are characteristically highly sensitive to sulfonylurea treatment, and there are several cases reported where patients have been misdiagnosed as type 1 diabetes, treated with insulin (sometimes for many years) but later transferred safely to sulfonylurea treatment. MODY 4 results from abnormalities of IPF-1, which plays a role in pancreatic development: patients may present with varying degrees of hyperglycaemia at variable ages of onset. MODY 5 is caused by defects in HNF-1B, which plays a role in renal development as well as β-Cell function. It is characterized by renal cyst formation (which may lead to chronic kidney disease) and variable degrees of hyperglycaemia. MODY 6 is associated with abnormalities of NeuroD1, which plays a role in pancreatic development.
Clinicians need to be aware of the possibility of MODY in patients with a strong family history of early onset type 2 diabetes, and consider genetic testing. Other tests are also being developed, for example low plasma concentrations of C-reactive protein (measured with a highly sensitive assay) can be highly predictive of MODY 3 and may eventually be incorporated into diagnostic algorithms.
Secondary diabetes
Several diseases may cause diabetes or glucose intolerance. Most of these are readily diagnosed, perhaps with haemochromatosis and chronic pancreatitis being the least readily apparent. Clinical concern is frequently raised about Cushing syndrome when an obese subject presents with glucose intolerance, and a number of studies have suggested that up to 4% of patients with type 2 diabetes are in fact suffering from Cushing syndrome. Pseudo-Cushing syndrome, either idiopathic or related to alcohol excess, is a more common association.
Tropical diabetes
Fibrocalcific pancreatic diabetes is a form of secondary diabetes that occurs in the tropical developing countries. The condition has typical clinical features, pancreatic calcification being characteristic, but its aetiology has not been established. There was previously considered to be another form of tropical diabetes termed protein-deficient pancreatic, or J-type, diabetes, but this is not included in current classifications.
Alcohol-related and pancreatic causes of diabetes
Chronic pancreatitis accounts for <1% of all diabetes in the developed world. Alcohol is the usual cause. Most patients give a history of long-term (>5 years) excessive alcohol consumption with recurrent episodes of mild abdominal pain. Hospitalization during these episodes of pancreatitis is unusual. There may or may not be pancreatic calcification, but sclerosis of islets occurs. Insulin secretion is reduced, causing diabetes, but patients are highly sensitive to exogenous insulin therapy (perhaps because glucagon secretion is also reduced). Chronic heavy alcohol consumption may also induce severe exocrine pancreatic failure and, consequently, steatorrhoea. Pancreatic resection, for example for cancer, is a rare cause of diabetes.
Acute pancreatitis is associated with transient glucose intolerance resulting from reduced insulin secretion and the insulin resistance of systemic illness. Acute haemorrhagic pancreatitis occasionally produces such damage to the pancreas that permanent diabetes mellitus results.
Mild (subclinical) abnormalities of exocrine pancreatic function and reductions in pancreatic lipase and immunoreactive trypsin are seen in 20–70% of diabetic patients. The cause for these abnormalities is not established, although the pancreas is smaller in patients with diabetes (especially type 1 diabetes). Changes in insulin secretion, glucagon secretion and autonomic neural function may also play a role in exocrine pancreatic dysfunction.
Haemochromatosis
Iron storage disease, whether owing to familial defects or repeated iron infusion, results in liver damage that may progress to cirrhosis (see Chapter 14) and β-Cell damage, as well as damage to other endocrine and non-endocrine tissues (e.g. cardiac muscle). Diabetes is a common result of such problems. Glucose tolerance improves with treatment of the iron overload, but the more severe the damage, the lower the probability of recovery with treatment. Screening diabetic clinic populations typically reveals 0.1–0.5% of type 2 diabetes mellitus to be associated with undiagnosed iron storage disorders. However, modestly elevated concentrations of ferritin are commonly associated with type 2 diabetes, particularly at the time of diagnosis, and do not of themselves necessarily suggest the diagnosis of haemochromatosis.
Endocrine disorders
In many of the conditions mentioned in this section, insulin resistance occurs but, in most subjects, β-Cell reserve is sufficient to produce compensatory hyperinsulinaemia so that, although there is mild glucose intolerance, full-blown diabetes mellitus is unusual. The unrecognized development of an endocrine condition in a known diabetic patient may present as worsening glycaemic control or recurrent ketoacidosis. It is more common for endocrine disease to exacerbate or unmask pre-existing glucose intolerance rather than for it to be the sole cause of diabetes.
Polycystic ovary syndrome is a common condition, associated with obesity, insulin resistance and glucose intolerance or frank type 2 diabetes (see below and Chapter 22).
Active thyrotoxicosis is associated with glucose intolerance in 30–50% of patients, but this rarely extends to frank diabetes. The mechanism causing this may vary between patients. Hepatic glucose production is often increased; increased gastrointestinal motility may exaggerate postprandial hyperglycaemia; insulin clearance is increased, and hypersensitivity of β-adrenoreceptors may mediate the elevated NEFA concentrations found in hyperthyroidism.
The increased incidence of impaired glucose tolerance in patients with hypothyroidism is well established, although the mechanism for it is uncertain.
Hyperprolactinaemia causes insulin resistance and glucose intolerance, which is reversed by treating the primary condition; symptomatic diabetes is rare.
The hypercortisolaemia of Cushing syndrome, whatever the cause, results in increased hepatic gluconeogenesis and hepatic glucose output while skeletal muscle becomes insulin resistant. Glucocorticoids increase lipolysis and protein catabolism, increasing the circulating concentrations of alternative fuels and reducing glucose clearance. Glucose intolerance is found in 80–90% and frank diabetes in 15–20% of patients with Cushing syndrome. Treatment with glucocorticoids is a common cause of secondary diabetes.
Conn syndrome was originally described as including glucose intolerance. However, this is usually mild and only a small minority of patients has even moderate glucose intolerance. The cause is thought to be impaired insulin secretion owing to severe potassium depletion.
Growth hormone is a counter-regulatory hormone. Acromegaly frequently causes glucose intolerance (seen in 60–70% of cases) and even symptomatic diabetes (in 6–25%). Successful treatment of acromegaly usually improves glucose tolerance. Isolated growth hormone deficiency is also associated with glucose intolerance, probably as a result of the insulin resistance that results from the decrease in lean body mass and the increase in abdominal fat and a blunted insulin response to glucose. Diabetic microvascular disease is rare in this group.
Phaeochromocytoma is associated with multiple abnormalities of glucoregulation, adrenaline (epinephrine) having a greater hyperglycaemic effect than noradrenaline (norepinephrine). Catecholamines stimulate hepatic glycogenolysis and hepatic glucose output, and inhibit insulin secretion via α-receptors; β-receptor effects include promotion of adipose tissue lipolysis, increased skeletal muscle glycogenolysis and reduced skeletal muscle glucose uptake. Both α- and β-receptors augment glucagon secretion. Improvement of glucose tolerance occurs within a few weeks of successful surgical resection.
Hypercalcaemia and hypophosphataemia, as seen in primary hyperparathyroidism, reduce peripheral insulin sensitivity, probably through effects on intracellular second messenger systems and glucose uptake, and are associated with hyperinsulinaemia, although glucose tolerance is rarely impaired.
Gastrointestinal endocrine tumours of several types are associated with glucose intolerance. Glucose intolerance is a cardinal feature in patients with glucagonomas. Zollinger–Ellison (gastrinoma) syndrome; Verner–Morrison or watery diarrhoea hypokalaemia, achlorhydria (WDHA or VIPoma) syndrome; carcinoid syndrome; polyneuropathy, organomegaly, endocrinopathy, monoclonal gammopathy, skin changes (POEMS) syndrome and somatostatinoma, all have glucose intolerance as a frequent, and often florid, feature.
Autoimmune hypoadrenalism is associated with type 1 diabetes mellitus but not causative: indeed, adrenal failure is a cause of hypoglycaemia.
Iatrogenic diabetes
Treatment with steroids is the most common form of iatrogenic diabetes. Some frequently used drugs, including thiazides and β-blockers, especially in combination, may worsen glucose tolerance, their effects being most clinically relevant in diabetic patients. Other drugs may cause diabetes via effects on lipid metabolism (e.g. protease inhibitors), via weight gain or through mechanisms that are not fully understood (e.g. atypical antipsychotic agents).
Rare conditions associated with glucose intolerance
Several congenital conditions with varying degrees of impairment of glucose intolerance are listed in Table 15.7. In most of these conditions, the diabetes is not the most pressing clinical problem.
TABLE 15.7
Congenital conditions with associated glucose intolerance
| Condition | Main features |
| Klinefelter syndrome | Skeletal, gonadal (infertility) |
| Turner syndrome | Skeletal, gonadal (infertility) |
| Down syndrome | Neurological |
| Friedreich ataxia | Neurological |
| Ataxia telangiectasia | Neurological |
| Dystrophia myotonica | Neurological |
| Huntington chorea | Neurological |
| DIDMOAD | Diabetes insipidus, diabetes mellitus, optic atrophy and deafness |
| Refsum disease | Neurological |
| Alstrom syndrome | Neurological |
| Laurence–Biedl–Moon syndrome | Neurological, obesity |
| Prader–Willi syndrome | Neurological, obesity |
| Cystic fibrosis | Respiratory, pancreatic (malabsorption) |
| Werner syndrome | Growth retardation, premature senility |
| Fetal rubella syndrome | Neurological, cardiac |
| Lipodystrophy (various forms) | Metabolic, renal, vascular, hepatic |
| Glycogen storage disorders | Hepatic/myopathic |
Severe insulin resistance
Most of the endocrine causes of glucose intolerance are the result of circulating insulin antagonists causing insulin resistance. A variety of other medical conditions, although rare, may be associated with severe resistance to insulin.
Acanthosis nigricans is characterized by the presence of velvety brown hyperkeratotic lesions on the neck, axillae and groins. There is a well-recognized, but relatively rare association with malignancy. Acanthosis nigricans not associated with malignancy may be classified into two types, both associated with insulin resistance and obesity. Type A is a variant of polycystic ovarian syndrome where the skin changes are marked; additional features include hirsutism, polycystic ovaries, virilization, coarse features and early accelerated growth. The cause of the insulin resistance in this type has not yet been determined. Several factors may be involved: reductions in insulin binding, receptor number and receptor kinase activity, and post receptor defects have each been reported in some patients. Patients with type B acanthosis nigricans tend to be older and are usually female. They have markers of autoimmune disease including hypergammaglobulinaemia, proteinuria, hypocomplementaemic nephritis, leucopenia, arthralgia, alopecia, enlarged salivary glands and positive antinuclear and anti-DNA antibodies. They have reduced insulin binding to monocytes in vitro, owing to the presence of an autoantibody against the insulin receptor. Ataxia telangiectasia may show some overlap with the features of type B acanthosis nigricans.
Leprechaunism is a rare congenital condition with typical facies, lipodystrophy, cliteromegaly, hirsutism and acanthosis nigricans. It is usually fatal. Affected children are severely resistant to exogenous insulin. They produce large amounts of normal insulin endogenously. Several cellular defects have been described that produce the phenotype of leprechaunism. Most patients have defective kinase activity of the insulin receptor, although some show defective insulin receptor formation and others are unable to recycle insulin receptors back to cell membranes after insulin binding. The common features of acanthosis nigricans and virilism are probably an effect of stimulation of IGF receptors by high concentrations of insulin.
Lipodystrophy occurs in local and generalized forms; it is usually familial. There are several associated features but these vary from family to family. Acanthosis nigricans, hepatosplenomegaly, nephritis and hyperlipoproteinaemia have all been reported. Likewise, the cellular defect varies, with some families having reduced insulin binding and some having reduced receptor numbers. Lipodystrophy is also frequently seen as a complication of treatment of acquired immune deficiency syndrome (AIDS), particularly with protease inhibitors. This may be severe enough not only to be disfiguring, but also to cause severe hyperlipidaemia and diabetes mellitus. There is something of a paradox in the fact that type 2 diabetes is associated with increased visceral fat depots but also with lipodystrophy. This is probably explained by the role that adipose tissue has in storing fatty acids as triglycerides. In conditions where this process is impaired, circulating concentrations of NEFA are increased and may affect hepatic insulin sensitivity in much the same way that they do when there is excess visceral adipose tissue accumulation in obesity.
Anti-insulin antibodies
A previously common form of insulin resistance was iatrogenic, owing to the induction of anti-insulin antibodies (also known as insulin antibodies) by the use of exogenous pork or beef insulins for the treatment of diabetes. Treatment with human insulin ab initio results in very few (if any) patients developing such antibodies. Anti-insulin antibodies bind exogenous insulin, reducing its plasma concentration and action. Clinically, the presence of significant anti-insulin antibodies manifests as either a high insulin requirement for the achievement of glycaemic control or with altered insulin kinetics (usually delayed insulin action). The antibodies may be detected by a variety of assays. Treatment is usually by changing to insulin analogues, human or (very rarely) sulfated animal insulins.
Insulin-binding autoantibodies are also seen as a result of autoimmune disease or haematological malignancy and may cause profound insulin resistance, although ketosis rarely occurs as the binding of insulin to IGF receptors is not affected and appears to allow sufficient suppression of lipolysis to prevent excess ketogenesis. These autoantibodies may be an indication for steroid therapy, although high doses of exogenous insulin may be satisfactory.
Cirrhosis
Glucose intolerance occurs in most, and fasting hyperglycaemia in 30% of patients with cirrhosis, unless the latter is due to idiopathic haemochromatosis, when diabetes is common. There are multiple glucoregulatory defects in cirrhosis including insulin resistance, hyperinsulinaemia, impaired insulin clearance, elevated growth hormone concentrations and hyperglucagonaemia. However, in clinical practice, hypoglycaemia resulting from reduced storage, synthesis and mobilization of glucose typically dominates the clinical picture in a patient with advanced hepatic cirrhosis.
ENDOCRINE ASSOCIATIONS WITH DIABETES
Several endocrine conditions occur with increased frequency among diabetic populations. Endocrine conditions that cause secondary diabetes have been discussed above.
Abnormalities of glucagon secretion appear to be a consequence of diabetes. In normal subjects, insulin inhibits glucagon release and glucagon concentrations fall during hyperglycaemia. Hyperglucagonaemia is usual in both types 1 and 2 diabetes, and glucagon concentrations in diabetic patients are relatively insensitive to changes in glucose concentrations. The mechanisms for this are unknown but may relate to de-repression of glucagon release by the insulin deficiency of diabetes. In longstanding type 1 diabetes, the glucagon response to hypoglycaemia may be lost, which may contribute to poor recovery from hypoglycaemia.
Some other endocrine disorders show an association with diabetes, but the link is shared susceptibility rather than causal; these include autoimmune hypoadrenalism, Graves and Hashimoto diseases. The development of thyrotoxicosis owing to Graves disease in a patient with diabetes may underlie subsequent loss of diabetic control and weight loss. The prevalence of primary hypothyroidism is reported to be 4–17% in type 1 diabetes.
Type 1 diabetes is statistically associated with coeliac disease (up to 6% of patients may be affected), and both are related to HLA-DR4. Guidelines recommend screening for coeliac disease in patients with type 1 diabetes. The combined dietetic requirements of the two conditions may be onerous for patients. The diarrhoea of unrecognized coeliac disease may be mistaken for diabetic diarrhoea, and coeliac disease should be considered as a cause of newly developing hypoglycaemia in a patient whose glycaemic control was previously poor.
DIABETES, NUTRITION AND GROWTH
In well-nourished children with well-controlled type 1 diabetes, skeletal growth is normal. Poor glycaemic control is associated with elevated growth hormone concentrations but reduced IGF concentrations and is thus a growth hormone-resistant state. It is thought that the latter is related to the reduced growth velocity seen in uncontrolled diabetes.
As a group, patients who develop diabetes as children tend to be more centrally obese than their non-diabetic siblings. It is not yet clear whether this problem is lessened by better glycaemic control.
It is important to appreciate that children with diabetes need a diet that permits healthy growth as well as maintaining good glycaemic control.
MECHANISMS OF DIABETIC TISSUE DAMAGE
Introduction
Both types 1 and 2 diabetes are associated with various long-term complications, also known as diabetic tissue damage. The acute metabolic complications of diabetes are discussed in Chapter 16. Diabetic tissue damage includes a range of ‘microvascular complications’ (e.g. retinopathy and nephropathy), ‘macrovascular complications’ (ischaemic heart disease, peripheral vascular disease, stroke and renal artery stenosis) and some complications that do not fit entirely into either category (e.g. glove and stocking peripheral neuropathy, mononeuritis multiplex, cranial neuropathies, entrapment neuropathies, proximal motor neuropathies, autonomic neuropathy, various sorts of cataract and diabetic cheiroarthropathy). Diabetic subjects have a reduced life expectancy and macrovascular disease is, in most cases, the major determinant of this.
Few organs or tissues are exempt from potential damage in diabetes; approximately half of those diagnosed with type 2 diabetes have evidence of tissue damage at diagnosis. However, only relatively few cell types are known to be vulnerable to direct damage from chronic hyperglycaemia, for example the mesangial cells of the kidney, vascular endothelial cells, pancreatic β-Cells, Schwann cells and neurons. Many other cells appear to be able to reduce glucose uptake under conditions of extracellular hyperglycaemia and, perhaps for this reason, are relatively resistant to direct hyperglycaemic damage.
The two main clinical subtypes of diabetic tissue damage, macrovascular and microvascular disease, are differentially affected by the cumulative effect of hyperglycaemia. It has been proposed that microvascular tissue damage is the result of hyperglycaemia per se, even if accelerated by other factors. Macrovascular complications are frequently found in epidemiological studies to be associated with insulin-resistant states and hyperinsulinaemia, and their relationship to hyperglycaemia is less clearly established. Data derived from the UK Prospective Diabetes Study (UKPDS) suggest that the risk of microvascular disease increases approximately ten-fold with an increase in HbA1c from 37 to 80 mmol/mol (5.5–9.5%), whereas the risk of macrovascular disease becomes apparent at values of HbA1c below that typically associated with diabetes but increases only by a factor of about two-fold with the same increase in HbA1c.
Pathogenesis
The pathogenetic mechanisms involved are ill understood and, for even the major forms of diabetic tissue damage, it is not easy to determine the role of purely diabetic abnormalities (e.g. hyperglycaemia per se and hypo- or hyperinsulinaemia) as opposed to abnormalities related to diabetes (e.g. hypertension, dysplipidaemia or obesity).
The first cellular mechanism to underlie purely hyperglycaemic tissue damage to be described was increased activation of the polyol pathway. The enzyme aldose reductase, usually involved in the reduction of toxic aldehydes to their respective alcohols, is diverted under conditions of intracellular hyperglycaemia to reducing excess glucose to sorbitol, which is later oxidized to fructose. This process consumes the cofactor NADPH, which is then not available for the regeneration of reduced glutathione, thus rendering cells vulnerable to the effects of oxidative stress. Sorbitol accumulation in the lens may cause cataracts, and has been demonstrated in biopsies from diabetic subjects to occur in the eye, peripheral nerves and renal glomeruli. Unfortunately, trials of aldose reductase inhibitors have conferred only marginal reduction in the progression of neuropathy in people with diabetes. This is either because the pathway is not important, is one of several mechanisms of diabetic tissue damage or is a downstream process whose correction would not be expected fundamentally to alter cellular responses to hyperglycaemia. As a result, these agents are not presently used in routine clinical practice.
The next mechanism to be proposed was mediated by the slow accumulation over time of advanced glycation end products (AGEs), which are irreversibly formed by the non-enzymatic glycation of matrix, cellular and plasma proteins. Glucose and amino acids combine to form unstable Schiff base adducts, which undergo chemical rearrangement over time to form Amadori products and, eventually, AGEs that are chemically stable, irreversibly attached to proteins and able to trap other protein elements by covalent binding and promotion of cross linking. Advanced glycation end products are thought to cause tissue damage by alterations in the structure and function of the extracellular matrix with accumulation of PAS-positive material (e.g. in the basement membrane of blood vessels), by activation of inflammatory cytokines and growth factors via stimulation of AGE receptors (in part by the NFκB pathway) and by alteration of cellular genetic material. These changes may contribute to the endothelial dysfunction, basement membrane thickening and increased vascular permeability observed in the diabetic microvasculature.
Another mechanism postulated to be involved in the evolution of diabetic tissue damage is that intracellular hyperglycaemia, by causing increased diacylglycerol (DAG) concentration, may cause further activation of the NFκB pathway via activation of protein kinase C (PKC). The end result is vasoconstriction and hypercoagulability via increased endothelin-1, TGF-β and plasminogen activator inhibitor 1 (PAI-1) generation and reduced endothelial nitric oxide synthase production.
The fourth major mechanism proposed to result in diabetic tissue damage results from shunting of excessive intracellular glucose via fructose 6-phosphate to glucosamine 6-phosphate, a reaction catalysed by the enzyme glutamine:fructose 6-phosphate amidotransferase (see Fig. 15.2). Glucosamine 6-phosphate undergoes further conversion to UDP N-acetyl glucosamine, which, by binding to serine and threonine residues on transcription factors, leads to increased proinflammatory cytokine activity (TGF-β, PAI-1 and others).
A further mechanism relating to the generation of reactive oxygen species (ROS) and oxidative stress has recently been proposed. Excessive intracellular glucose or NEFAs are thought to stimulate tricarboxylic acid cycle reactions by substrate accumulation. Citrate, formed from NEFA or glucose-derived acetyl-CoA and oxaloacetate, is converted to isocitrate by the enzyme isocitrate dehydrogenase, generating mitochondrial NADH in the process. Excessive generation of NADH leads to ROS formation via increased electron transport along the inner mitochondrial membrane and, perhaps when other means of electron dissipation such as uncoupling proteins are saturated, their donation to oxygen species, generating toxic ROS. β-Cells are thought to be especially vulnerable to the resulting oxidative stress by virtue of a low antioxidant capacity. In hyperglycaemic clamp studies, glutathione infusion has been shown to restore islet cell function (particularly first-phase insulin response), and hyperglycaemia or excessive NEFA-induced endothelial dysfunction may similarly be ameliorated by antioxidant infusion. However, data from various studies do not demonstrate convincing benefits from supplemental vitamin E (an antioxidant) in diabetic or other subjects at high risk of cardiovascular disease.
The precise interrelationship between these proposed mechanisms of diabetic tissue damage, for example whether they may be downstream effects of a common maladaptive cellular response to hyperglycaemia or whether they represent independent pathways, is not yet clear. There is compelling evidence, for example that PKC activation may be stimulated by superoxide ions and AGE formation, thus linking the oxidative stress, advanced glycation end product and PKC pathways. Ruboxistaurin mesylate (LY333531), an inhibitor of PKC, has shown promise in human and animal trials in slowing progression of, and in some cases reversing, a number of diabetic microvascular complications including nephropathy, retinopathy and neuropathy.
Other aspects of diabetic tissue damage
Although the mechanisms discussed above relate to the specific effects of hyperglycaemia, other factors such as infection, genetic susceptibility, hypertension, vascular disease, hyperlipidaemia and other associated conditions such as hyperuricaemia and gout are important and common cofactors for tissue damage in the clinical setting, and these are discussed briefly below.
Tissue damage is encountered in diabetes as a result of increased susceptibility to infection (e.g. renal scarring from repeated episodes of urinary sepsis). Phagocyte (principally neutrophil) dysfunction appears to be the main predisposing factor; this occurs via a number of mechanisms including abnormal adherence, chemotaxis, phagocytosis, respiratory burst and bacterial killing. It is not known precisely what duration of exposure to hyperglycaemia is required to produce these abnormalities in human subjects: the concentration threshold is probably ~11 mmol/L.
High concordance rates between twins for complications of diabetes suggest that inherited factors may influence their development. There is evidence that autoimmune processes contribute to the development of some diabetic complications (e.g. the autonomic neuropathy/iritis syndrome).
There is good evidence that growth hormone deficiency, either coincidental or induced by hypophysectomy, prevents or reverses the onset of microvascular complications. However, the results of trials using pegvisomant, a growth hormone receptor antagonist, have been disappointing.
The role of recurrent hypoglycaemia in diabetic tissue damage, especially neurological damage to CNS and autonomic neurons, is currently being investigated but hypoglycaemia is certainly not a necessary condition for its development.
Although microvascular disease and some other complications may be more characteristic of diabetes, macrovascular disease accounts for most of the excess mortality associated with the condition. Diabetic macrovascular disease is related to, but not identical to, atherosclerosis occurring in non-diabetic patients. In diabetic macrovascular disease, the age of onset is earlier and the prevalence of vascular disease in men and women is approximately equal. Differences in the ranking of the strength of associations of risk markers in diabetic and non-diabetic populations suggest some differences in aetiology: smoking is the main risk factor in non-diabetic populations, but hypertension seems relatively more important in diabetes. Furthermore, diabetic macrovascular disease has some singular clinical features, verging on the pathognomic. For example, there is a strong association with calcification of the vascular media and a predilection for involvement of multiple distal arteries (a pattern that often precludes surgical intervention) rather than fewer proximal arteries. The well-documented higher mortality rate from myocardial infarction in patients with diabetes (compared with similar patients without diabetes) may be related to this widespread involvement of middle-sized and small arteries. Acute (‘stress’) hyperglycaemia may also contribute to increased mortality, but trials of strict glycaemic control in the immediate post-infarct period have produced mixed results, possibly because the magnitude of the hyperglycaemic response may also be related to the severity of the infarct.
The causation of the increased macrovascular disease risk observed in diabetes is complex; most of the conventional risk factors for vascular disease in non-diabetic individuals (e.g. smoking, hypertension, age) are associated with accelerated atherosclerosis in diabetic populations. However, there is evidence that hypertension in diabetes is in some ways distinct from essential hypertension (e.g. the relationship between plasma renin concentration and plasma renin activity is altered and renal and endothelial dysfunction may be more pronounced). The lipid abnormality most commonly linked with mortality in diabetes may not be high LDL-cholesterol, as found in non-diabetic subjects, but rather the combination of low HDL-cholesterol, small, dense LDL and hypertriglyceridaemia, as also seen in the metabolic syndrome.
Studies of blood rheology, the glycation and peroxidation of lipoproteins and endogenous thrombotic and thrombolytic mechanisms show widespread abnormalities in diabetes, which may all be relevant to the development of macrovascular disease.
The risk of macrovascular disease (whether of the ‘normal’ or the ‘diabetic’ pattern is unclear) is increased in subjects with IGT as well as in those with frank diabetes. Most physicians consider that cardiovascular risk factors in patients with IGT should be managed as if they had diabetes.
CONDITIONS ASSOCIATED WITH INADEQUATELY CONTROLLED DIABETES MELLITUS
Various conditions are associated with poorly controlled diabetes, including gout, osteopenia and hepatic steatosis. Acute diabetic emergencies are discussed in Chapter 16.
The association of gout with diabetes has been recognized for >200 years. The reason for the link is not yet clear, but alterations in renal urate clearance may contribute; high uric acid concentrations are associated with other features of the metabolic syndrome and with increased cardiovascular risk. In some patients, hyperuricaemia may be exacerbated by the use of drugs such as thiazides and β-blockers for the treatment of diabetic hypertension.
Generalized osteopenia is also clearly associated with diabetes mellitus. No specific defect in calcium or phosphate metabolism has been identified and the basis of the association is unclear. Of particular importance is local osteolysis, with loss of bone mineral, which in the feet, can be difficult to distinguish from osteomyelitis, especially in the context of suspect Charcot foot (see p. 324). The inactivity occasioned by diabetic foot ulcers may accelerate the osteopenia. The thiazolidinedione drugs have been associated with increased fracture risk in diabetes.
Fatty change in the liver is common in obesity and in some cases may be associated with an increased risk of developing diabetes. It is also found in poorly controlled diabetes; it frequently causes elevation of plasma liver enzyme activity, notably of alanine aminotransferase and, less frequently, of other enzymes. Liver ultrasound scans will confirm fatty liver in cases of uncertainty. Historically, this has often been considered a benign process, but more recent data suggest that many cases of idiopathic cirrhosis may, in fact, have arisen in fatty livers. There appears to be a spectrum of non-alcoholic fatty liver disease from simple steatosis, which represents the benign end of the scale with little propensity to progress, through various grades of inflammation and fibrosis (steatohepatitis), to frank cirrhosis. There are few good data on selection of patients for biopsy and on measures to prevent progression from simple steatosis to more serious degrees of steatohepatitis. However, most authorities advocate measures to effect good glycaemic control, to treat dyslipidaemia (fibrates may have a particular role) and to improve insulin resistance by exercise and weight loss. Several recent studies have demonstrated beneficial effects from the thiazolidinedione group of drugs, probably as a result both of insulin sensitization and also their effects on NEFA metabolism and fat distribution. This topic is discussed in detail in Chapter 14.
Low concentrations of circulating magnesium have been reported during treatment of ketoacidosis. Hypomagnesaemia may be more common in outpatients with diabetes mellitus than in non-diabetic subjects. However, this suggestion has not been confirmed and there is no evidence that plasma magnesium should be checked routinely in patients with diabetes.
Hyponatraemia may arise in diabetes through several mechanisms. Chlorpropamide and tolbutamide (and perhaps other sulphonylureas) may cause water retention through potentiation of the action of antidiuretic hormone (see Chapter 4). Artefactual hyponatraemia may arise from the hyperlipidaemia (hypertriglyceridaemia) of ketoacidosis or poor glycaemic control. Compensatory hyponatraemia is often seen in poorly controlled diabetes, perhaps as an osmoregulatory response to high glucose concentrations. This effect may be particularly significant in the management of acute diabetic emergencies and is, in effect, a translocational hyponatraemia brought about by the movement of water from the intracellular to the extracellular space as a consequence of the increased plasma osmolality in hyperglycaemic conditions. Plasma sodium concentration should fall by ~1.6 mmol/L for every 5 mmol/L that plasma glucose exceeds 5 mmol/L. If the measured sodium differs significantly from this ‘corrected’ value, a cause should be sought, and if it lies well outside the reference range, fluid management may have to be adjusted accordingly. To what extent, if at all, osmotic tissue damage contributes to the long-term complications of diabetes is at present unclear.
Diabetic kidney damage most commonly presents as hypertension or (micro)-albuminuria in patients under regular review. Late presentations include chronic kidney disease, nephritic syndrome, nephrogenic diabetes insipidus (sometimes associated with papillary necrosis), renal tubular acidosis (type 4) or toxicity from renally-excreted drugs.
BIOCHEMICAL MEASUREMENTS IN DIABETES MELLITUS
Glucose measurements
Measurements of blood glucose concentrations are fundamental to the diagnosis and management of diabetes mellitus. Plasma contains more glucose (per unit volume) than erythrocytes, so criteria for diagnosis of diabetes reflect these differences between samples (see Table 15.4). Since glucose enters the circulation via the hepatic vein and is cleared peripherally, arterial concentrations are higher than in venous blood samples, with capillary blood having intermediate values.
Over the last decade, home and bedside blood glucose monitoring by patients or their attendants has become widespread, using dry reagent enzymatic reactions or electrochemical methodologies on test strips. Although such techniques represent the only current practical approach to long-term self or nurse monitoring, they are prone to multiple errors if misused (especially by inadequately educated patients or healthcare professionals) and should not be relied upon for clinical decisions in seriously ill patients. They require appropriate calibration and proper technique (e.g. prior washing and drying of hands, correct sample volume and correct test strip for the metre used). Recent advances in testing include electronic transfer of results to databases including the electronic patient record, and alternative site (e.g. forearm) sampling to avoid the pain and repeated trauma associated with fingertip sampling (although forearm glucose concentrations may differ from fingertip concentrations when blood glucose concentrations are rapidly changing, e.g. during exercise or in the postprandial state). Other developments include collection of interstitial fluid by reverse iontophoresis for automated glucose analysis every 10 min, and continuous glucose monitoring systems in which a disposable subcutaneous glucose sensor that can function for several days is monitored via a wired or wireless system. This permits collection of a detailed profile throughout a 24 h period that may yield information that is hard to gather using conventional testing. It is particularly useful overnight, e.g. in patients with suspected nocturnal hypoglycaemia. Glucose concentrations determined by this method lag behind blood glucose by about 10 min, and the method is limited by the development of local skin irritation. The systems are expensive and usually only used for short-term monitoring, although they are sometimes advocated for longer periods of use in patients attempting to achieve tight control of glucose concentrations. The ultimate development of this would be a closed loop system that monitors glucose and calculates the correct amount of insulin to infuse via a pump, but this has not yet gone beyond short experimental studies.
Table 15.8 indicates some factors that may interfere with blood glucose analysis by laboratory or point of care testing methods.
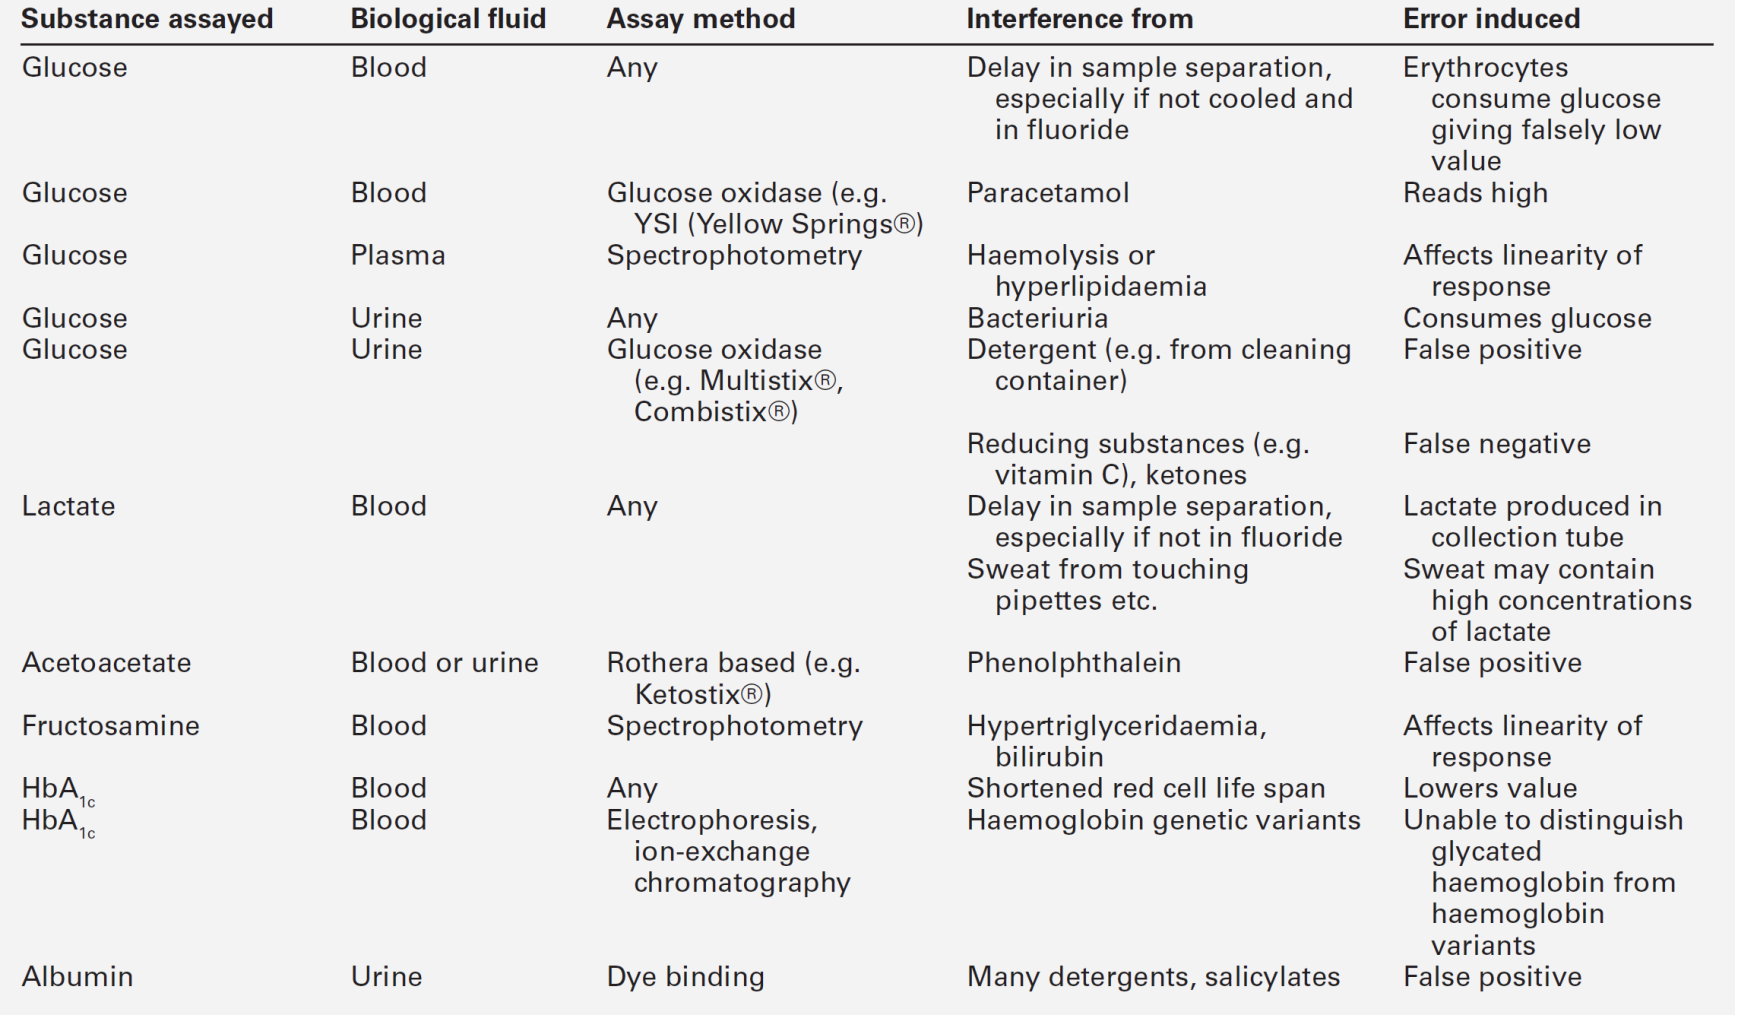
Measurements of urinary glucose concentration are cheap but prone to often correlate poorly with the degree of glycaemic control. Problems include variation in the tubular threshold for glucose (e.g. increased in diabetes, reduced in pregnancy, subject to interindividual variation and altered by a range of drugs and renal tubular disorders) and the fact that the plasma glucose concentration that corresponds to the renal threshold (around 10 mmol/L) is higher than the level that clinical studies (UKPDS and Diabetes Control and Complications Trial, DCCT) have demonstrated to be the target range for blood glucose concentrations. Furthermore, urine glucose concentration is affected by fluid intake and urine concentration and provides information about the entire period since last voiding rather than giving an indication of the current level of glycaemia (unless a second voided specimen is used). The dry reagent stick chemistries used are imprecise at lower levels of glycosuria and may be affected by some drugs. Their use is declining in the developed world; however, they may be more acceptable than blood testing to some patients. They provide an adequate index of glycaemic control in some elderly patients with type 2 diabetes, controlled on diet alone or on small doses of oral hypoglycaemics, although HbA1c (see below) is now the preferred method of monitoring for most of these patients.
Testing for ketones
Urine testing for ketones has an important place in the management of diabetes, particularly for patients with type 1 diabetes, who should generally be instructed in its uses and limitations. Ketone testing is particularly important when metabolic control is threatened by intercurrent illness or stress or when blood glucose concentrations are persistently high (e.g. >15 mmol/L), particularly when accompanied by symptoms compatible with ketoacidosis such as nausea, vomiting or abdominal pain. It must be appreciated that the normally approximately equimolar ratio of the major ketones, β-hydroxybutyrate and acetoacetate, may increase to approximately 6:1 during diabetic ketoacidosis (DKA), reducing during recovery. Furthermore, in recovery from DKA, excretion of urine ketones may continue long after blood acid–base balance is restored to normal. Thus, since all commercially available test sticks use nitroprusside-based reactions, which measure only acetoacetate, tests may become more positive as the patient recovers and remain positive for hours or even days after resolution of the illness. It should also be appreciated that positive results may be found in a significant proportion of normoglycaemic individuals (particularly pregnant women) when testing first-voided urine specimens after an overnight fast. Certain drugs, such as captopril and levodopa, may cause spuriously positive results, while ascorbic acid intake may cause false negative ones.
Enzymatic methods detecting β-hydroxybutyrate in blood using a stick test that can be performed by the patient or at the bedside have a number of theoretical advantages over urine testing. β-Hydroxybutyrate is the most relevant ketone in ketoacidosis, and the use of a metre with the stick permits its quantitative measurement, thus enabling more accurate diagnosis and monitoring of this disorder. The sticks usually also have a longer shelf-life than the urine tests, which is an advantage given that most patients will need to test for ketones only occasionally. Blood ketone measurement is now recommended in some guidelines (e.g. Joint British Diabetes Societies guideline for the management of diabetic ketoacidosis), either by stick testing or using rapid automated laboratory methods, although it is not yet in widespread use.
Oral glucose tolerance test
The oral glucose tolerance test (OGTT) is the reference method for the assessment of glucose tolerance, despite the notoriously poor reproducibility of the test (CV = 50% for 2 h blood glucose). Most diabetic patients are diagnosed on the basis of symptoms, examination and random or fasting plasma glucose concentrations without recourse to an OGTT. However, WHO and UK guidance is that patients with intermediate fasting glucose concentrations (impaired fasting glycaemia) should undergo formal glucose tolerance testing. The test also has a particular place in the diagnosis of gestational diabetes mellitus, where fasting plasma glucose concentrations lack diagnostic sensitivity. Historically, there has been divergence of opinion as to the dose of glucose to be used. Current WHO recommendations are that this should be 75 g of anhydrous glucose (not glucose monohydrate which is 10% water by weight). For three days before the test, the subject should be on an unrestricted weight-maintaining diet, with at least 150 g carbohydrate per day, and should exercise normally. The subject should fast overnight for at least 10 h, and should remain seated and not smoke during the test. Oral glucose tolerance tests are not recommended for subjects with fasting plasma glucose ≥7.1 mmol/L or hospitalized, acutely ill or immobile patients. Interpretation may be difficult in subjects taking β-blockers, diuretics, nicotinic acid or high doses of glucocorticoids.
Tests of recent glycaemic control
Several tests are available that reflect prior glycaemic control: pre-eminent among these is glycated haemoglobin. There are multiple potential glycation sites but the principal one is the β-chain terminal valine residue. Glycation at this site, followed by an Amadori rearrangement to a stable adduct, forms HbA1c. Since the usual lifespan of an erythrocyte is 120 days and the erythrocyte membrane is freely permeable to glucose, glycated haemoglobin concentration reflects the glycaemic control over the preceding 120 days, although with substantial weighting towards a shorter time (see below). Many different methodologies, including cation-exchange chromatography, electrophoresis, isoelectric focusing, affinity chromatography and immunoassay can be used to measure glycated haemoglobin after its separation from non-glycated haemoglobin. All HbA1c assays should be traceable to the reference method developed by the International Federation for Clinical Chemistry and Laboratory Medicine (IFCC).
The interpretation of glycated haemoglobin measurements will be affected by any coincidental condition that reduces the lifespan of erythrocytes, especially haemolytic anaemias. Conversely, iron deficiency anaemia may spuriously increase HbA1c concentrations by increasing erythrocyte lifespan. Other conditions such as raised plasma concentrations of triglycerides and bilirubin, uraemia, and the presence of haemoglobinopathies may cause interference in some assays.
As an approximation, an HbA1c of 50 mmol/mol (6.7%) corresponds with a mean plasma glucose concentration of approximately 9 mmol/L, and each 10 mmol/mol (1%) increase with a 2 mmol/L increase in mean plasma glucose concentrations. Although HbA1c is a measure of long-term glycaemia, it must be appreciated that more recent effects are relatively more weighted so that the 30 days prior to sampling contribute 50% of the sample result, whereas events from 90–120 days prior to the sample being taken contribute a mere 10%. In conditions where glycaemic control and insulin requirements may change from week to week (such as pregnancy) or where the patient has a structurally abnormal haemoglobin, it may be preferable to use an alternative index of glycaemic control.
Fructosamine is the name given to the ketoamine products of protein glycation formed when glucose bound to a variety of proteins by aldimine linkage undergoes an Amadori rearrangement. The major component of fructosamine in plasma is glycated albumin, but other proteins and possibly non-protein components as well contribute to the measured values. Standardization has been difficult, so reference ranges may differ between different laboratories. Fructosamine is relatively simple to measure (using a nitroblue tetrazolium assay); its concentration reflects control over the preceding 10–15 days, but is subject to spurious results in the presence of factors that affect albumin turnover (including diabetic nephropathy). There is an inverse relationship between weight and fructosamine so that fructosamine concentrations are lower than expected for the degree of control in obese patients with diabetes. Whether or not to correct fructosamine for serum albumin concentration (given that the absolute concentration, not the glycated proportion of the protein, is measured) remains uncertain. The clinical utility of fructosamine is further limited by the lack of evidence-based targets, but it has a limited role in patients with disorders such as haemolytic anaemia or haemoglobinopathies in whom HbA1c cannot be used.
Screening for diabetes
It is estimated that 50% of diabetic subjects in the developed world are undiagnosed. Screening has been recommended by NICE in the UK for asymptomatic subjects who are at high risk of developing diabetes (see Fig. 15.6). This involves a two-stage check – the first is a risk assessment using a validated computer-based risk assessment tool (these usually use factors such as sex, age, BMI, waist circumference, family history, history of hypertension and ethnicity to estimate risk, see, e.g. http://www.diabetes.org.uk/Riskscore/) in those who meet the following criteria:
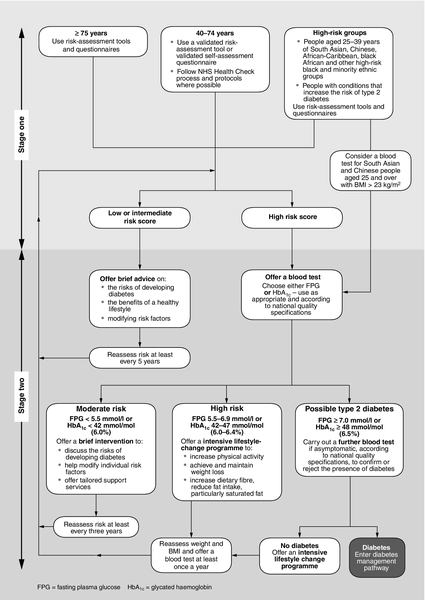
FIGURE 15.6 Flowchart for the identification and management of type 2 diabetes mellitus. (From NICE public health guidance PH 38: Preventing type 2 diabetes: risk identification and interventions for individuals at high risk (2012): http://guidance.nice.org.uk/PH38, with permission from the National Institute for Health and Care Excellence).
• adults aged 40 and above, except pregnant women
• adults aged 25–39 of South Asian, Chinese, African-Caribbean, black African and other high-risk black and minority ethnic groups, except pregnant women
• adults with conditions that increase the risk of type 2 diabetes (cardiovascular disease, hypertension, obesity, stroke, polycystic ovary syndrome, a history of gestational diabetes and mental health problems. In addition, people with learning disabilities and those attending emergency medical admissions units, vascular and renal surgery units and ophthalmology departments may be at high risk).
High-risk individuals should be offered a blood test for either HbA1c or fasting plasma glucose. For individuals with results of these tests below the diagnostic threshold for diabetes, an HbA1c of 42–47 mmol/mol (6–6.5%), or a fasting glucose of 5.5–6.9 mmol/L indicates high risk. These individuals should be offered advice on intensive lifestyle intervention and re-testing at least once a year.
Similar recommendations have been made by the American Diabetes Association and other organizations.
Tests for insulin resistance
In subjects who require large amounts of insulin to maintain euglycaemia, e.g. >150 units or >1.5 units/kg body weight/24 h, insulin resistance is likely to be present (although it is important to ensure that the patient is compliant with therapy). Many such subjects will be morbidly obese and this is usually an adequate explanation. Measurements of fasting insulin, C-peptide and glucose will show inappropriately high concentrations. Haemolysis reduces insulin concentrations, so care should be taken to avoid this, and blood samples should be kept cool (4 °C) until the plasma can be separated. Normal fasting insulin concentrations are up to 140 pmol/L (20 mU/L), depending on the assay used. If doubt remains as to whether the subject is insulin-resistant, it may be necessary to check insulin and glucose concentrations after observed insulin administration or a hyperinsulinaemic clamp may be undertaken (see below).
If insulin-binding antibodies are suspected, for example in a subject who has received non-human insulins, free insulin can be assayed by immunoassay. If the free insulin concentration is much lower than total insulin concentration, insulin-binding antibodies are likely. Subjects who have little glycaemic response to high concentrations of endogenous insulin, but who are sensitive to exogenous insulin, may have an abnormal immunoreactive insulin (see p. 279 and Table 15.2).
If a subject without insulin-binding antibodies fails to respond to intravenous insulin, an insulin receptor or post-receptor problem should be suspected and a careful family study should be undertaken. Family members should be screened for insulin resistance by measuring fasting plasma glucose and insulin concentrations. The binding of insulin to the patient’s white blood cells or adipose tissue may be measured in order to indicate whether the patient has normal insulin receptor numbers and whether the receptors show normal avidity for insulin.
Glucose transporter function can be investigated by incubating cells of interest (e.g. leukocytes, monocytes, adipocytes) with a non-metabolisable glucose analogue such as 2-deoxyglucose. The cellular content of the glucose analogue after a given time provides a measure of glucose transporter function. Glucose transporter number may be estimated by the use of specific antibodies linked to an imaging system (fluorescence or radioactivity based).
Molecular biological techniques can be used to determine DNA sequences coding for insulin, the insulin receptor and glucose transporter molecules, as appropriate, when the site of the defect has been identified.
Research investigations
Tests commonly used in diabetes research include the hyperinsulinaemic glucose clamp and the intravenous glucose tolerance test (IVGTT), as well as a variety of measures of β-Cell function.
Hyperinsulinaemic clamps
The hyperinsulinaemic clamp is the reference measure of insulin resistance. In the euglycaemic variant of the test, insulin is infused into a peripheral vein to increase the plasma insulin concentration to a target range (e.g. 250 pmol/m2 per min or 35 mU/m2 per min increases the insulin to around 60 mU/L). Without further intervention, the hyperinsulinaemia would induce hypoglycaemia. However, in the clamp procedure, the plasma glucose concentration is measured every 3–5 min and glucose is infused peripherally to maintain glucose concentrations within the desired range. When a steady state has been reached (usually 90–120 min), the rate of exogenous glucose infusion needed to maintain the glucose concentration is an index of the glucose clearance rate and of the subject’s insulin sensitivity. Many variations on the clamp methodology are described, including use of stable isotope tracers, which permit better description of the physiological abnormalities in glucose turnover in response to insulin.
Intravenous glucose tolerance testing
The IVGTT is an alternative test of glucose tolerance in which glucose (typically 20 g/m2 of body surface area) is injected as a bolus. This test has better reproducibility than the OGTT but is even less physiological. An IVGTT is a powerful stimulus to insulin secretion. It has been used in research studies to screen high-risk non-diabetic subjects for early defects of glucose tolerance and insulin response, with some success in predicting those that will subsequently progress to overt diabetes.
Measurement of β-Cell function
These tests are primarily used to determine the relative contribution of insulin deficiency and insulin resistance to glucose intolerance. There is no consensus as to which should be used in type 2 diabetes mellitus. The gold standard for research purposes is the hyperglycaemic clamp, where glucose is clamped at high concentrations and insulin secretion measured. If it is clinically important to document the severity of insulin deficiency, this is best done by measuring plasma C-peptide concentration. The DCCT trial used a basal concentration for C-peptide of <0.2 nmol/L and a concentration of <0.5 nmol/L measured 6 min after giving 1 mg glucagon intravenously to distinguish type 1 from type 2 diabetes. Other tests of β-Cell function used for research purposes include the arginine stimulation test and mathematical models based on measures of insulin or C-peptide during oral or intravenous glucose tolerance tests.
Elevated fasting plasma proinsulin concentrations indicate subjects with abnormal β-Cell function, even if glucose tolerance is normal.
Homoeostasis model assessment
The homeostasis model assessment (HOMA) is a mathematical model that uses fasting glucose and insulin concentrations to derive estimates of both insulin resistance and β-Cell function. It is useful for epidemiological studies where more sophisticated testing is not practical, but interpretation can be difficult especially in the context of treatment with insulin or oral drugs that stimulate insulin secretion.
CONCLUSION
There are two major types of diabetes: type 1 and type 2. Both are characterized by hyperglycaemia, but in type 1, this is a consequence of absolute insulin deficiency as a result of β-Cell destruction, whereas in type 2 the deficiency is relative, with most patients being resistant to the actions of insulin, although their production of insulin tends to decrease with time. Both conditions are associated with short-term and long-term complications. Biochemical investigations are essential for both the diagnosis and management of the conditions.
ACKNOWLEDGEMENT
The authors wish to acknowledge Dr Simon Coppack and Dr Victor Lawrence, who wrote this chapter in the second edition of this book.
Further reading
Kahn SE, Porte Jr D. Beta cell dysfunction in type 2 diabetes: pathogenesis and genetic basis. In: Valle D Beaudet AL, Vogelstein B et al. editors. The online metabolic and molecular bases of inherited disease. New York: McGraw-Hill. 10.1036/ommbid.86.
MacLaren NK, Kukreja A. Type 1 diabetes. In: Valle D, Beaudet AL, Vogelstein B et al. editors. The online metabolic and molecular bases of inherited disease. New York: McGraw-Hill. 10.1036/ommbid.88.
Taylor SI. Insulin action, insulin resistance and type 2 diabetes mellitus. In: Scriver CR, Beaudet AL, Sly WS et al. editors. The metabolic and molecular bases of inherited disease. New York. 10.1036/ommbid.87.
These three chapters provide detailed accounts of the pathogenesis of diabetes mellitus.