1
What the ECG is about
‘ECG’ stands for electrocardiogram, or electrocardiograph. In some countries, the abbreviation used is ‘EKG’. Remember:
• By the time you have finished this book, you should be able to say and mean ‘The ECG is easy to understand’.
THE ELECTRICITY OF THE HEART
The contraction of any muscle is associated with electrical changes called ‘depolarization’, and these changes can be detected by electrodes attached to the surface of the body. Since all muscular contraction will be detected, the electrical changes associated with contraction of the heart muscle will only be clear if the patient is fully relaxed and no skeletal muscles are contracting.
THE WIRING DIAGRAM OF THE HEART
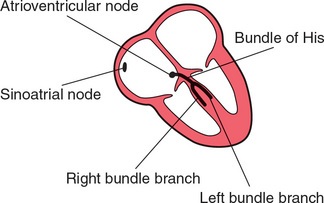
The electrical discharge for each cardiac cycle normally starts in a special area of the right atrium called the ‘sinoatrial (SA) node’ ( Fig. 1.1). Depolarization then spreads through the atrial muscle fibres. There is a delay while depolarization spreads through another special area in the atrium, the ‘atrioventricular node’ (also called the ‘AV node’, or sometimes just ‘the node’). Thereafter, the depolarization wave travels very rapidly down specialized conduction tissue, the ‘bundle of His’, which divides in the septum between the ventricles into right and left bundle branches. The left bundle branch itself divides into two. Within the mass of ventricular muscle, conduction spreads somewhat more slowly, through specialized tissue called ‘Purkinje fibres’.
THE DIFFERENT PARTS OF THE ECG
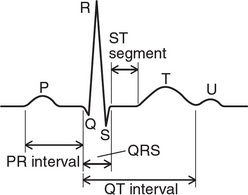
The muscle mass of the atria is small compared with that of the ventricles, and so the electrical change accompanying the contraction of the atria is small. Contraction of the atria is associated with the ECG wave called ‘P’ ( Fig. 1.2). The ventricular mass is large, and so there is a large deflection of the ECG when the ventricles are depolarized: this is called the ‘QRS’ complex. The ‘T’ wave of the ECG is associated with the return of the ventricular mass to its resting electrical state (‘repolarization’).
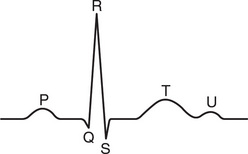
In some ECGs an extra wave can be seen on the end of the T wave, and this is called a U wave. Its origin is uncertain, though it may represent repolarization of the papillary muscles. If a U wave follows a normally shaped T wave, it can be assumed to be normal. If it follows a flattened T wave, it may be pathological (see Ch. 4).
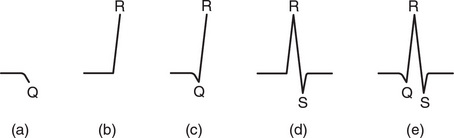
The different parts of the QRS complex are labelled as shown in Figure 1.3. If the first deflection is downward, it is called a Q wave ( Fig. 1.3a). An upward deflection is called an R wave, regardless of whether it is preceded by a Q wave or not ( Figs 1.3b and 1.3c). Any deflection below the baseline following an R wave is called an S wave, regardless of whether there is a preceding Q wave ( Figs 1.3d and 1.3e).
TIMES AND SPEEDS
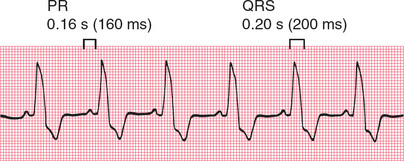
ECG machines record changes in electrical activity by drawing a trace on a moving paper strip. ECG machines run at a standard rate of 25 mm/s and use paper with standard-sized squares. Each large square (5 mm) represents 0.2 second (s), i.e. 200 milliseconds (ms) ( Fig. 1.4). Therefore, there are five large squares per second, and 300 per minute. So an ECG event, such as a QRS complex, occurring once per large square is occurring at a rate of 300/min. The heart rate can be calculated rapidly by remembering the sequence in Table 1.1.
Table 1.1
Relationship between the number of large squares between successive R waves and the heart rate
| R-R interval (large squares) | Heart rate (beats/min) |
| 1 | 300 |
| 2 | 150 |
| 3 | 100 |
| 4 | 75 |
| 5 | 60 |
| 6 | 50 |
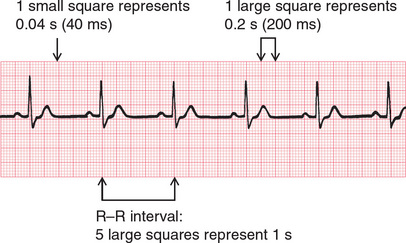
Fig. 1.4 Relationship between the squares on ECG paper and time. Here, there is one QRS complex per second, so the heart rate is 60 beats/min
The PR interval is measured from the beginning of the P wave to the beginning of the QRS complex, and it is the time taken for excitation to spread from the SA node, through the atrial muscle and the AV node, down the bundle of His and into the ventricular muscle. Logically, it should be called the PQ interval, but common usage is ‘PR interval’ ( Fig. 1.5).
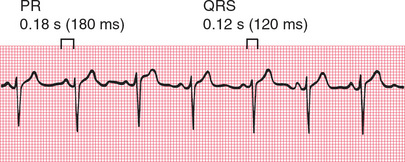
The normal PR interval is 120–220 ms, represented by 3–5 small squares. Most of this time is taken up by delay in the AV node ( Fig. 1.6).
If the PR interval is very short, either the atria have been depolarized from close to the AV node, or there is abnormally fast conduction from the atria to the ventricles.
The duration of the QRS complex shows how long excitation takes to spread through the ventricles. The QRS complex duration is normally 120 ms (represented by three small squares) or less, but any abnormality of conduction takes longer, and causes widened QRS complexes ( Fig. 1.7). Remember that the QRS complex represents depolarization, not contraction, of the ventricles – contraction is proceeding during the ECG’s ST segment.
CALIBRATION
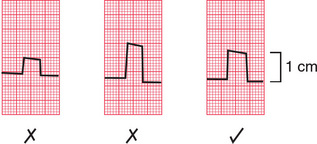
A limited amount of information is given by the height of the P waves, QRS complexes and T waves, provided the machine is properly calibrated. A standard signal of 1 millivolt (mV) should move the stylus vertically 1 cm (two large squares) ( Fig. 1.8), and this ‘calibration’ signal should be included with every record.
THE ECG – ELECTRICAL PICTURES
The word ‘lead’ sometimes causes confusion. Sometimes it is used to mean the pieces of wire that connect the patient to the ECG recorder. Properly, a lead is an electrical picture of the heart.
The ECG is made up of 12 characteristic views of the heart, six obtained from the ‘limb’ leads (I, II, III, VR, VL, VF) and six from the ‘chest’ leads (Vi-V6). It is not necessary to remember how the leads (or views of the heart) are derived by the recorder, but for those who like to know how it works, see Table 1.2. The electrode attached to the right leg is used as an earth, and does not contribute to any lead.
Table 1.2
| Lead | Comparison of electrical activity |
| 1 | LAandRA |
| II | LLandRA |
| III | LL and LA |
| VR | RA and average of (LA + LL) |
| VL | LA and average of (RA + LL) |
| VF | LL and average of (LA + RA) |
| v1 | V1 and average of (LA + RA + LL) |
| v2 | V2 and average of (LA + RA + LL) |
| v3 | V3 and average of (LA + RA + LL) |
| v4 | V4 and average of (LA + RA + LL) |
| v5 | V5 and average of (LA + RA + LL) |
| v6 | V6 and average of (LA + RA + LL) |
THE 12-LEAD ECG
ECG interpretation is easy if you remember the directions from which the various leads look at the heart. The six ‘standard’ leads, which are recorded from the electrodes attached to the limbs, can be thought of as looking at the heart in a vertical plane (i.e. from the sides or the feet) ( Fig. 1.9).
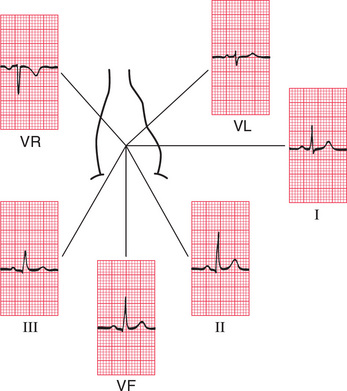
Leads I, II and VL look at the left lateral surface of the heart, leads III and VF at the inferior surface, and lead VR looks at the right atrium.
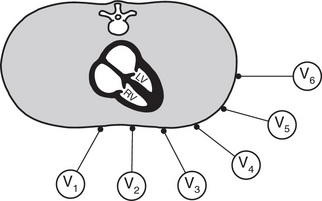
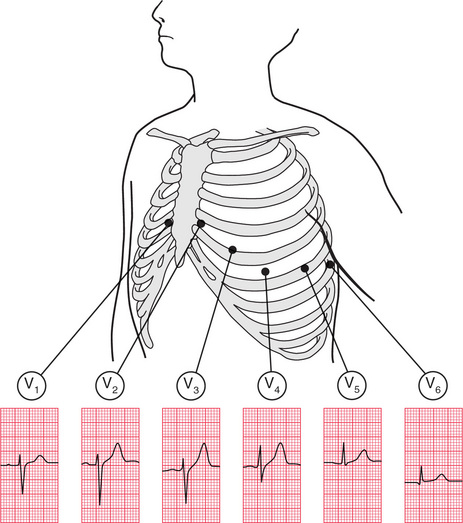
The six V leads (V1-V6) look at the heart in a horizontal plane, from the front and the left side. Thus, leads V1 and V2 look at the right ventricle, V3 and V4 look at the septum between the ventricles and the anterior wall of the left ventricle, and V5 and V6 look at the anterior and lateral walls of the left ventricle ( Fig. 1.10).
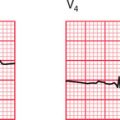
As with the limb leads, the chest leads each show a different ECG pattern ( Fig. 1.11). In each lead the pattern is characteristic, being similar in individuals who have normal hearts.
THE SHAPE OF THE QRS COMPLEX
We now need to consider why the ECG has a characteristic appearance in each lead.
THE QRS COMPLEX IN THE LIMB LEADS
Depolarization spreads through the heart in many directions at once, but the shape of the QRS complex shows the average direction in which the wave of depolarization is spreading through the ventricles ( Fig. 1.12).
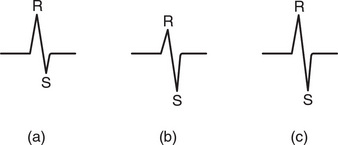
Fig. 1.12 Depolarization and the shape of the QRS complex
Depolarization (a) moving towards the lead, causing a predominantly upward QRS complex; (b) moving away from the lead, causing a predominantly downward QRS complex; and (c) at right angles to the lead, generating equal R and S waves
If the QRS complex is predominantly upward, or positive (i.e. the R wave is greater than the S wave), the depolarization is moving towards that lead ( Fig. 1.12a). If predominantly downward, or negative (the S wave is greater than the R wave), the depolarization is moving away from that lead ( Fig. 1.12b). When the depolarization wave is moving at right angles to the lead, the R and S waves are of equal size ( Fig. 1.12c). Q waves, when present, have a special significance, which we shall discuss later.
THE CARDIAC AXIS
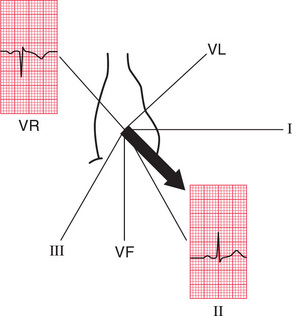
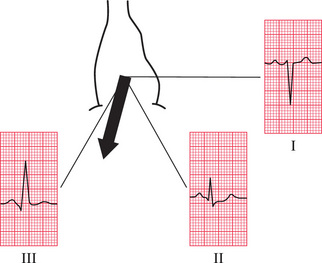
Leads VR and II look at the heart from opposite directions. When seen from the front, the depolarization wave normally spreads through the ventricles from 11 o’clock to 5 o’clock, so the deflections in lead VR are normally mainly downward (negative) and in lead II mainly upward (positive) ( Fig. 1.13).
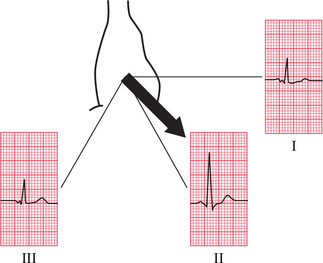
A normal 11 o’clock-5 o’clock axis means that the depolarizing wave is spreading towards leads I, II and III, and is therefore associated with a predominantly upward deflection in all these leads; the deflection will be greater in lead II than in I or III ( Fig. 1.14).
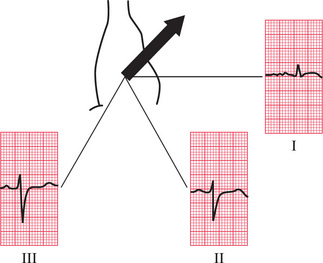
If the right ventricle becomes hypertrophied, it has more effect on the QRS complex than the left ventricle, and the average depolarization wave – the axis – will swing towards the right. The deflection in lead I becomes negative (predominantly downward) because depolarization is spreading away from it, and the deflection in lead III becomes more positive (predominantly upward) because depolarization is spreading towards it ( Fig. 1.15). This is called ‘right axis deviation’. It is associated mainly with pulmonary conditions that put a strain on the right side of the heart, and with congenital heart disorders.
When the left ventricle becomes hypertrophied, it exerts more influence on the QRS complex than the right ventricle. Hence, the axis may swing to the left, and the QRS complex becomes predominantly negative in lead III ( Fig. 1.16). ‘Left axis deviation’ is not significant until the QRS complex deflection is also predominantly negative in lead II. Although left axis deviation can be due to excess influence of an enlarged left ventricle, in fact this axis change is usually due to a conduction defect rather than to increased bulk of the left ventricular muscle (see Ch. 2).
The cardiac axis is sometimes measured in degrees ( Fig. 1.17), though this is not clinically particularly useful. Lead I is taken as looking at the heart from 0°; lead II from + 60°; lead VF from + 90°; and lead III from + 120°. Leads VL and VR look from − 30° and − 150°, respectively.
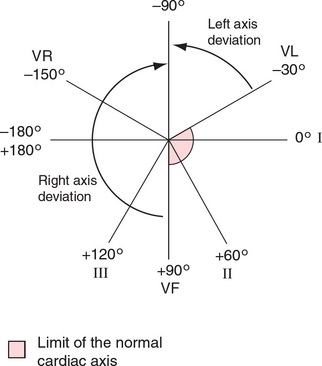
The normal cardiac axis is in the range − 30° to + 90°. If in lead II the S wave is greater than the R wave, the axis must be more than 90° away from lead II. In other words, it must be at a greater angle than − 30°, and closer to the vertical (see Figs 1.16 and 1.17), and left axis deviation is present. Similarly, if the size of the R wave equals that of the S wave in lead I, the axis is at right angles to lead I or at + 90°. This is the limit of normality towards the ‘right’. If the S wave is greater than the R wave in lead I, the axis is at an angle of greater than + 90°, and right axis deviation is present ( Fig. 1.15).
WHY WORRY ABOUT THE CARDIAC AXIS?
Right and left axis deviation in themselves are seldom significant – minor degrees occur in tall, thin individuals and in short, fat individuals, respectively. However, the presence of axis deviation should alert you to look for other signs of right and left ventricular hypertrophy (see Ch. 4). A change in axis to the right may suggest a pulmonary embolus, and a change to the left indicates a conduction defect.
THE QRS COMPLEX IN THE V LEADS
The shape of the QRS complex in the chest (V) leads is determined by two things:
• The septum between the ventricles is depolarized before the walls of the ventricles, and the depolarization wave spreads across the septum from left to right.
• In the normal heart there is more muscle in the wall of the left ventricle than in that of the right ventricle, and so the left ventricle exerts more influence on the ECG pattern than does the right ventricle.
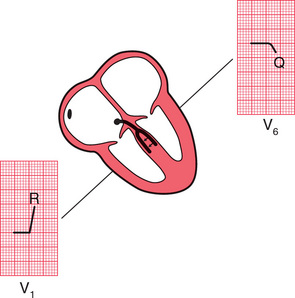
Leads V1 and V2 look at the right ventricle; leads V3 and V4 look at the septum; and leads V5 and V6 at the left ventricle ( Fig. 1.10).
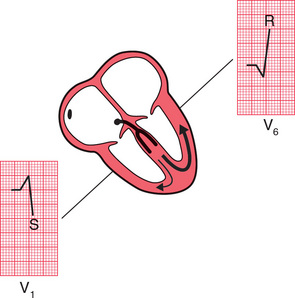
In a right ventricular lead the deflection is first upwards (R wave) as the septum is depolarized. In a left ventricular lead the opposite pattern is seen: there is a small downward deflection (‘septal’ Q wave) ( Fig. 1.18).
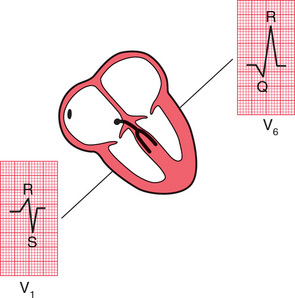
In a left ventricular lead there is an upward deflection (R wave) as the ventricular muscle is depolarized ( Fig. 1.19).
When the whole of the myocardium is depolarized, the ECG trace returns to the baseline ( Fig. 1.20).
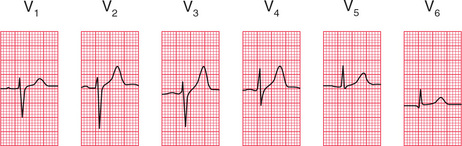
The QRS complex in the chest leads shows a progression from lead V1, where it is predominantly downward, to lead V6, where it is predominantly upward ( Fig. 1.21). The ‘transition point’, where the R and S waves are equal, indicates the position of the interventricular septum.
WHY WORRY ABOUT THE TRANSITION POINT?
If the right ventricle is enlarged, and occupies more of the precordium than is normal, the transition point will move from its normal position of leads V3/V4 to leads V4/V5 or sometimes leads V5/V6. Seen from below, the heart can be thought of as having rotated in a clockwise direction. ‘Clockwise rotation’ in the ECG is characteristic of chronic lung disease.
MAKING A RECORDING – PRACTICAL POINTS
Now that you know what an ECG should look like, and why it looks the way it does, we need to think about the practical side of making a recording. Some, but not all, ECG recorders produce a ‘rhythm strip’, which is a continuous record, usually of lead II. This is particularly useful when the rhythm is not normal. The next series of ECGs were all recorded from a healthy subject whose ‘ideal’ ECG is shown in Figure 1.22.
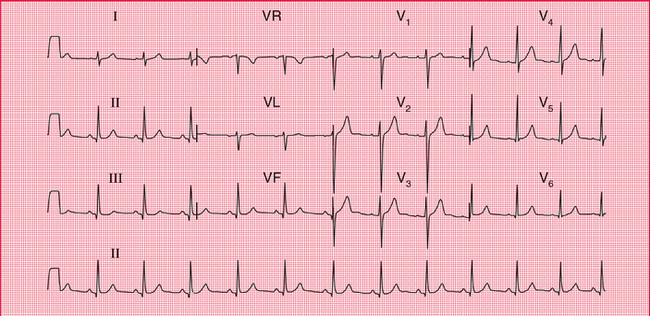
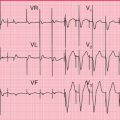
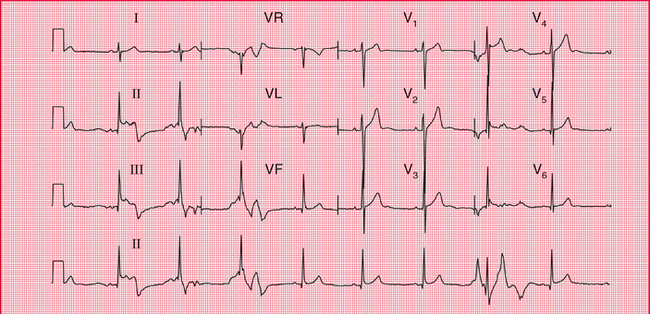
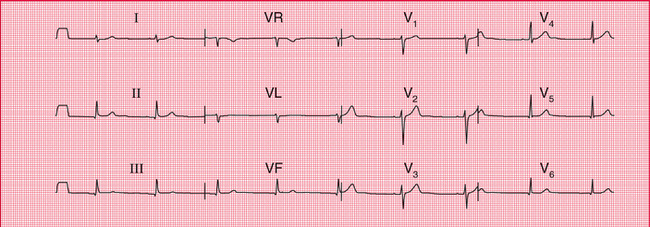
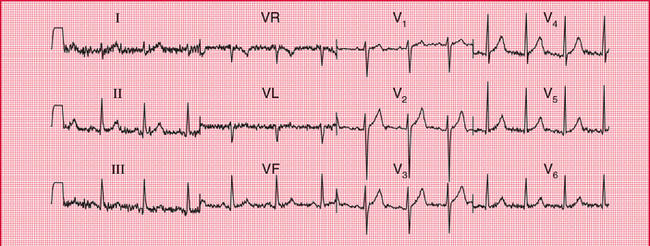
It is really important to make sure that the electrode marked LA is indeed attached to the left arm, RA to the right arm and so on. If the limb electrodes are wrongly attached, the 12-lead ECG will look very odd ( Fig. 1.23). It is possible to interpret the ECG, but it is easier to recognize that there has been a mistake, and to repeat the recording.
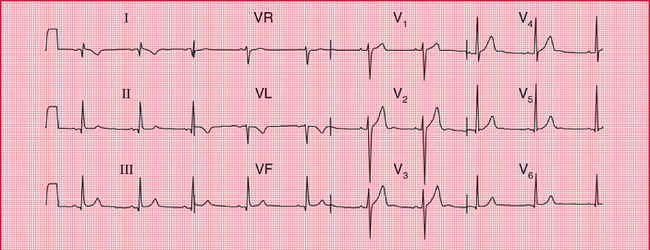
Fig. 1.23 The effect of reversing the electrodes attached to the left and right arms
Note
• Compare with Figure 1.22, correctly recorded from the same patient
Reversal of the leg electrodes does not make much difference to the ECG.
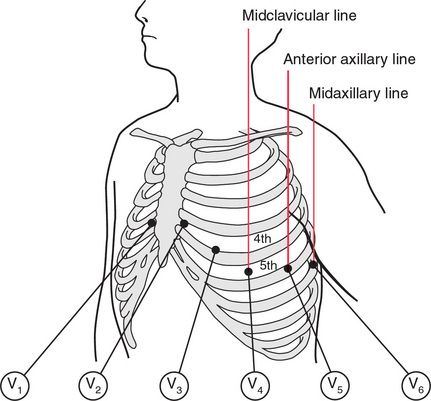
The other electrodes are then placed as shown in Figure 1.24, with V4 in the midclavicular line (the imaginary vertical line starting from the midpoint of the clavicle); V5 in the anterior axillary line (the line starting from the fold of skin that marks the front of the armpit); and V6 in the midaxillary line.
Good electrical contact between the electrodes and the skin is essential. The effects on the ECG of poor skin contact are shown in Figure 1.25. The skin must be clean and dry – in any patient using creams or moisturizers (such as patients with skin disorders) it should be cleaned with alcohol; the alcohol must be wiped off before the electrodes are applied. Abrasion of the skin is essential; in most patients all that is needed is a rub with a paper towel. In exercise testing, when the patient is likely to become sweaty, abrasive pads may be used – for these tests it is worth spending time to ensure good contact, because in many cases the ECG becomes almost unreadable towards the end of the test. Hair is a poor conductor of the electrical signal and prevents the electrodes from sticking to the skin. Shaving may be preferable, but patients may not like this – if the hair can be parted and firm contact made with the electrodes, this is acceptable. After shaving, the skin will need to be cleaned with alcohol or a soapy wipe.
Even with the best of ECG recorders, electrical interference can cause regular oscillation in the ECG trace, at first sight giving the impression of a thickened baseline ( Fig. 1.26). It can be extremely difficult to work out where electrical interference may be coming from, but think about electric lights, and electric motors on beds and mattresses.
ECG recorders are normally calibrated so that 1 mV of signal causes a deflection of 1 cm on the ECG paper, and a calibration signal usually appears at the beginning (and often also at the end) of a record. If the calibration setting is wrong, the ECG complexes will look too large or too small ( Figs 1.27 and 1.28). Large complexes may be confused with left ventricular hypertrophy (see Ch. 4), and small complexes might suggest that there is something like a pericardial effusion reducing the electrical signal from the heart. So, check the calibration.
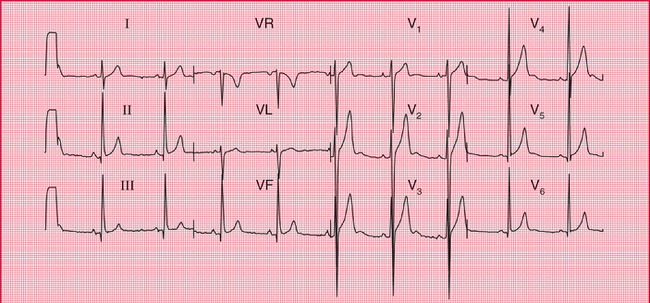
Fig. 1.27 The effect of over-calibration
Note
• The calibration signal (1 mV) at the left-hand end of each line causes a deflection of 2 cm
• All the complexes are large compared with an ECG recorded with the correct calibration (e.g. Fig. 1.22, in which 1 mV causes a deflection of 1 cm)
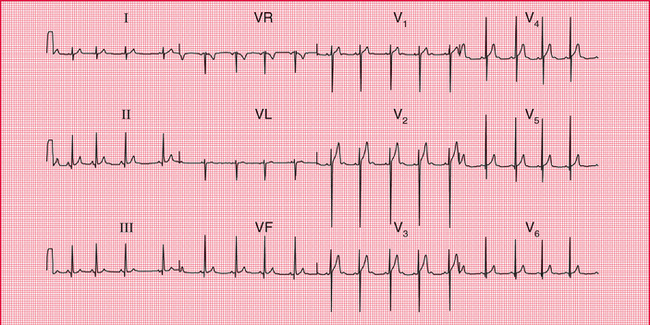
ECG recorders are normally set to run at a paper speed of 25 mm/s, but they can be altered to run at slower speeds (which make the complexes appear spiky and bunched together) or to 50 mm/s ( Figs 1.29 and 1.30). The faster speed is used regularly in some European countries, and makes the ECG look ‘spread out’. In theory this can make the P wave easier to see, but in fact flattening out the P wave tends to hide it, and so this fast speed is seldom useful.
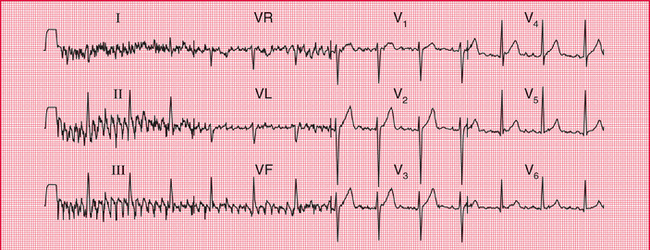
ECG recorders are ‘tuned’ to the electrical frequency generated by heart muscle, but they will also detect the contraction of skeletal muscle. It is therefore essential that a patient is relaxed, warm and lying comfortably – if they are moving or shivering, or have involuntary movements such as those of Parkinson’s disease, the recorder will pick up a lot of muscular activity, which in extreme cases can mask the ECG ( Figs 1.31 and 1.32).
So, the ECG recorder will do most of the work for you – but remember to:
• attach the electrodes to the correct limbs
• ensure good electrical contact
Then just press the button, and the recorder will automatically provide a beautiful 12-lead ECG.
HOW TO REPORT AN ECG
Many ECG recorders automatically provide a report, and in these reports the heart rate and the conducting intervals are usually accurately measured. However, the description of the rhythm and of the QRS and T patterns should be regarded with suspicion. Recorders tend to ‘over-report’, and to describe abnormalities where none exist: it is much better to be confident in 32 your own reporting.
The description should always be given in the same sequence:
Reporting a series of totally normal findings is possibly pedantic, and in real life this is frequently not done. However, you must think about all the findings every time you interpret an ECG.
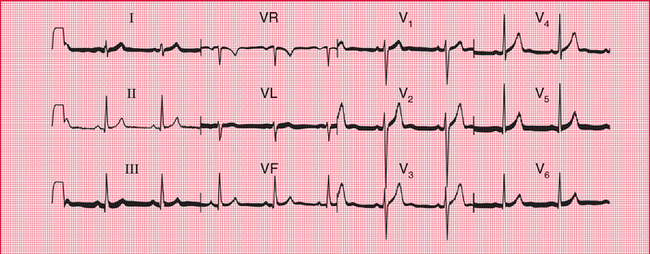
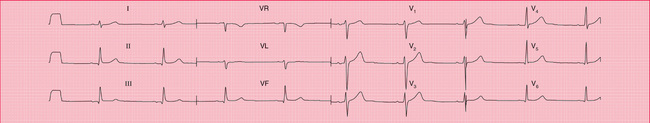
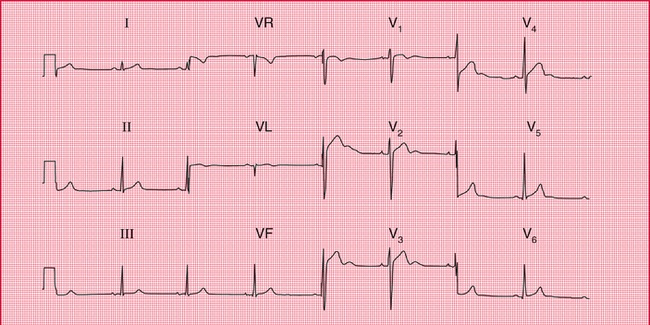
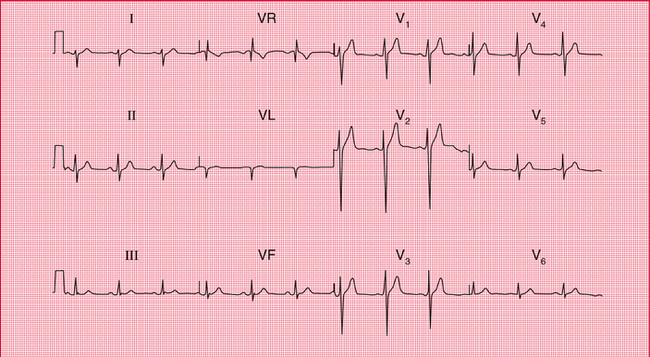
The interpretation of an ECG indicates whether the record is normal or abnormal: if abnormal, the underlying pathology needs to be identified. One of the main problems of ECG reporting is that there is quite a lot of variation in the normal ECG. Figures 1.33 and 1.34 are examples of 12-lead ECGs showing normal variants.
REMINDERS
BASIC PRINCIPLES
• The ECG results from electrical changes associated with activation (depolarization) first of the atria and then of the ventricles.
• Atrial depolarization causes the P wave.
• Ventricular depolarization causes the QRS complex. If the first deflection is downward, it is a Q wave. Any upward deflection is an R wave. A downward deflection after an R wave is an S wave.
• When the depolarization wave spreads towards a lead, the deflection is predominantly upward. When the wave spreads away from a lead, the deflection is predominantly downward.
• The six limb leads (I, II, III, VR, VL and VF) look at the heart from the sides and the feet in a vertical plane.
• The cardiac axis is the average direction of spread of depolarization as seen from the front, and is estimated from leads I, II and III.
• The chest or V leads look at the heart from the front and the left side in a horizontal plane. Lead V1 is positioned over the right ventricle, and lead V6 over the left ventricle.
• The septum is depolarized from the left side to the right.
• In a normal heart the left ventricle exerts more influence on the ECG than the right ventricle.
• Unfortunately, there are a lot of minor variations in ECGs which are consistent with perfectly normal hearts. Recognizing the limits of normality is one of the main difficulties of ECG interpretation.