CHAPTER 1 WHAT IS TYPE 2 DIABETES MELLITUS?
CLASSIFICATION OF DIABETES MELLITUS
The World Health Organization’s classification of diabetes (WHO 1985) has been adopted internationally. The American Diabetes Association re-examined the diagnostic criteria and classification and recommended modifications in 1997, subsequently agreed by WHO (The Expert Committee 1997, Alberti et al 1998). The terms type 1 and type 2 diabetes (Table 1.1) replaced the old categories of insulin-dependent diabetes mellitus (IDDM) and non-insulin-dependent diabetes mellitus (NIDDM). The older classification was based upon treatment (many NIDDM patients are on insulin), but did not indicate the nature of the underlying cause (Wroe 1997).
TABLE 1.1 1997–1998 ADA and WHO classification of diabetes mellitus
| Type 1 |
| (beta-cell destruction, usually leading to absolute insulin deficiency) |
| Autoimmune |
| Idiopathic |
| Type 2 |
| (may range from predominately insulin resistance with relative insulin deficiency to a predominately secretory defect with or without insulin resistance) |
| Other specific types |
| Genetic defects of beta-cell function |
| Genetic defects in insulin action |
| Diseases of the exocrine pancreas |
| Endocrinopathies |
| Drug- or chemical-induced |
| Infections |
| Uncommon forms of immune-mediated diabetes |
| Other genetic syndromes sometimes associated with diabetes |
| Gestational diabetes mellitus (includes gestational impaired glucose tolerance) |
Types 1 and 2 diabetes are compared in Table 1.2.
TABLE 1.2 Comparison of the characteristics of types 1 and 2 diabetes mellitus (Beers 1999)
| Characteristic | Type 1 diabetes | Type 2 diabetes |
|---|---|---|
| Commonest age at onset | Usually <30 years | Most often >30 years, but note recent trends |
| Associated obesity | No | Yes |
| Propensity to develop ketoacidosis (requiring insulin to prevent/control) | Yes | No |
| Presence of classic symptoms of hyperglycaemia at diagnosis | Yes, often severe | May be absent |
| If present, often moderate | ||
| Endogenous insulin secretion | Very low to undetectable | Variable, but low relative to plasma glucose levels |
| Insulin resistance | Not present | Yes, but variable |
| Twin concurrence | <50% | >90% |
| Associated with specific HLA-D antigens | Yes | No |
| Islet cell antibodies at diagnosis | Yes | No |
| Islet pathology | Insulitis, selective loss of most beta cells | Smaller, normal-looking islets |
| Amyloid deposits common | ||
| Associated increased risks for micro-and macrovascular disease | Yes | Yes |
| Hyperglycaemia responds to oral agents | No | Yes, initially in most patients |
© 2006 by Merck & Co., Inc., Whitehouse Station, NJ, USA
CRITERIA AND METHODS FOR THE DIAGNOSIS OF DIABETES MELLITUS

CURRENT CRITERIA AND METHODS
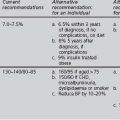
The current recommendations are based on a 1998 WHO consultative document (Alberti et al 1998). The following criteria are for diagnosis only, and are not criteria for initiating treatment or therapeutic goals:
RATIONALE FOR DIAGNOSTIC CRITERIA AND METHODS
The distribution of plasma glucose concentrations is a continuum; so there needs to be a threshold that separates those who are at a substantially increased risk of developing adverse outcomes caused by diabetes from those who are not (The Expert Committee 2003b). The medical, social and economic costs of making a diagnosis in those not at increased risk must be balanced against the costs of failing to diagnose those at increased risk.
The WHO and other bodies have adopted the ADA’s diagnostic criteria (The Expert Committee 1997), but there have been different recommended optimal methods of diagnosis. The WHO prefers the OGTT, supported by evidence that 2 hour post-load plasma glucose levels were more accurate than fasting plasma glucose levels in identifying those at increased risk of death associated with hyperglycaemia (DECODE 1999). The drawback of ADA’s preference for fasting plasma glucose levels is that “normal” results carry the risk of missing some diabetics, especially among the elderly and in some ethnic groups: the earliest defect in the natural history of beta cell dysfunction is the reduction of first-phase insulin release, associated with 2 hour post-load hyperglycaemia.
ORAL GLUCOSE TOLERANCE TEST (OGTT)
Standard protocol
After 3 or more days with a daily carbohydrate intake of at least 150 g, the OGTT should be performed in the morning after an overnight fast of 8–14 hours (during which plain water may be drunk). A venous blood sample is taken then a drink containing the equivalent of 75 g of glucose (e.g. Lucozade 388 ml) is consumed within 5 minutes. The subject should be seated, not smoke and take no unusual exercise during the test period. A second venous blood sample is taken exactly 2 hours after the start of the glucose drink. Both samples should be sent to an accredited laboratory for estimation of plasma glucose. Interpretation of the results of the OGTT test is provided in Table 1.3.
TABLE 1.3 Interpretation of the oral glucose tolerance test (The Expert Committee 2003a, b)
| Based on plasma venous glucose | Fasting (no caloric intake for 8 hours) | 2 hours post 75 g glucose load |
|---|---|---|
| Diabetes mellitus | 7.0 mmol/l or greater | 11.1 mmol/l or greater |
| Impaired glucose tolerance | – | 7.8 to 11.0 mmol/l |
| Impaired fasting glucose | 6.1 to 6.9 mmol/l | – |
| Normal glucose homeostasis | 6.0 mmol/l or less | 7.7 mmol/l or less |
DISEASE PROCESSES OF TYPE 2 DIABETES MELLITUS
DEFECTS RESPONSIBLE FOR TYPE 2 DIABETES
In type 2 diabetes, both of these defects coexist and both can be caused by a plethora of genetic or environmental factors. Most commonly, type 2 diabetes appears to be inherited as a polygenic trait, with environmental factors also involved, often at a very young age.
In insulin resistance, insulin is unable to produce its usual effects at concentrations that are effective in normal individuals. Its onset precedes the development of type 2 diabetes and may arise from a variety of genetic mutations. It is thought that the reduced action of insulin is linked closely with the cardiovascular risk factors, such as obesity, that are part of the insulin resistance syndrome (Reaven 1988).
INTERMEDIATE HYPERGLYCAEMIC CONDITIONS
IMPAIRED GLUCOSE TOLERANCE AND IMPAIRED FASTING GLUCOSE
Impaired glucose tolerance (IGT) refers to a glucose metabolic state that is intermediate between normal glucose homeostasis and diabetes mellitus. IGT only applies to a plasma glucose level in the range of 7.8 to 11.0 mmol/l at 2 hours after a 75 g glucose load. Patients can be labelled as having IGT only from an OGTT. Individuals with IGT are at increased risk of developing macrovascular disease. IGT progresses to type 2 diabetes in 37% at 5 years (Gillies 2007) and 50% at 10 years (Davies 2006). It is logical to regard IGT as a risk factor rather than as a disease entity, particularly as many individuals with IGT are asymptomatic and have normal plasma glucose levels in their daily lives. Some evidence suggests that the most cost-effective interventions to prevent or delay the onset of diabetes should target individuals with IGT, followed by high-risk groups.
If IFG is defined as between 6.1 and 6.9 mmol/l, then it includes a much lower proportion of the population than is categorised as having IGT. One review found that of those who had IFG and/or IGT, 16% had both, 23% had IFG alone, and 60% had IGT alone, with significant age and gender differences between the glucose intolerance categories (Unwin et al 2002). IFG and IGT may be different metabolic states. Although the ADA has recommended a reduced lower limit for IFG to 5.6 mmol/l is, on balance, a better predictor for cardiovascular and metabolic outcomes (The Expert Committee 2003a), other guidance (WHO/IDF, JBS2, NICE/NSF still recommends that the lower limit should remain at 6.1 mmol/l (WHO/IDF 2006).
There has been considerable research into the factors that increase the likelihood of an individual with intermediate hyperglycaemia developing diabetes. It is also interesting to look earlier in the natural history at factors that may cause glucose intolerance. Smoking is thought to increase insulin resistance, but the evidence is inconclusive as to whether smoking is an independent risk factor for the development of diabetes. The CARDIA study found that, in young individuals with normal glucose tolerance, both active and passive smoking were associated (more so in whites) with the development of glucose intolerance (Houston et al 2006).
METABOLIC SYNDROME
Insulin resistance is associated with a collection of abnormal risk factors (obesity, impaired glucose tolerance, hypertension and dyslipidaemia) and is now recognised as a major underlying contributor to increased coronary heart disease (CHD) mortality. Metabolic syndrome is a defined cluster of abnormal cardiovascular risk factors; it doubles cardiovascular disease (CVD) mortality, trebles the onset of CVD events (Carr et al 2004), and predicts the development of not only type 2 diabetes, but also obstructive/sleep airways disease, gall stones, some cancers and chronic kidney disease.
The two major previous definitions of metabolic syndrome were from:
In 2005, the International Diabetes Foundation (IDF) proposed a new definition for metabolic syndrome for clinical use (set out in Table 1.4) that avoids the technical difficulties associated with insulin measurement (International Diabetes Federation 2005).
TABLE 1.4 International Diabetes Federation (IDF) definition of metabolic syndrome (IDF 2005)
| Parameter | Qualifications |
|---|---|
| In all cases: | |
| Central obesity (waist circumference) | |
OGTT: oral glucose tolerance test
Epidemiological data about the metabolic syndrome are not entirely reliable due to the use of different definitions, but the prevalence varies amongst different ethnic groups, ranging from 22 to 39% of the adult population. It is commoner in an Indo-Asian population: a BMI greater than 23 kg/m2 in Indo-Asians (as compared to 25 kg/m2 in white Caucasians), is now thought to indicate increased CVD risk in this population, subject to the occasional confusion of obesity with being overweight (Hanif et al 2002).
Although the presence of metabolic syndrome does “predict” CVD events, there is no evidence that its criteria enhance the estimation of CVD risk in either diabetic or non-diabetic populations beyond existing tools, such as the New Zealand tables. However, the criteria associated with metabolic syndrome, particularly increased waist circumference, are better predictors of the development of type 2 diabetes (Sattar 2006).
PREVALENCE OF TYPE 2 DIABETES
CURRENT PREVALENCE
Estimating the prevalence of type 2 diabetes mellitus risks underestimation, because many type 2 patients are asymptomatic, and these individuals and/or health-care professionals may not always recognise the symptoms of hyperglycaemia. Some of the attempts to estimate the prevalence of diabetes are listed in Table 1.5.
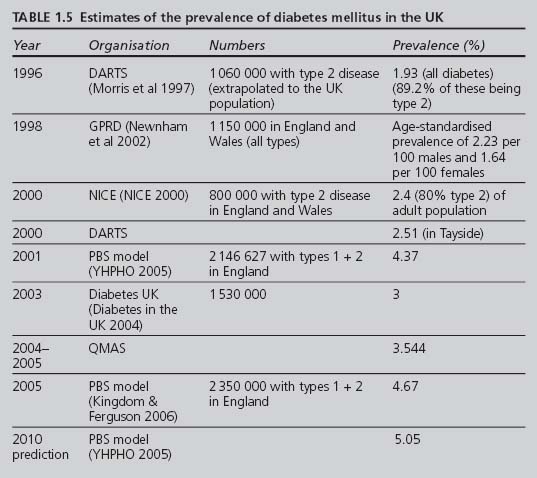
The National Diabetes Audit (NDA) has used the estimates for England produced by the PBS Diabetes Population Prevalence Model for 2001 and predicted for 2010, with adjustments for age, gender, ethnicity, social deprivation and district. The PBS model’s overall estimate for the prevalence of diabetes in 2001 of 4.37% was higher than other estimates (YHPHO 2005). In 2005 the estimated prevalence of all diabetes (diagnosed and undiagnosed) in England was 4.67% or 2 350 000 persons (Kingdom & Ferguson 2006).
One of the quality indicators for the GMS contract is that each practice should keep a diabetic register: indicator DM1 in 2004–2006; now DM19 (see Appendix 3). Data from the monitoring process provided a “raw” national prevalence, based on the number of diabetics identified in every practice, of 3.544% in 2005, lower than the PBS model, indicating that there is still a substantial number of “missing” diabetics (about one-quarter of those with diabetes).
FUTURE PREVALENCE
It is predicted that the prevalence of type 2 diabetes will continue to increase rapidly. It has been estimated that the worldwide prevalence of type 2 diabetes will more than double from 98.9 million in 1994 to 215 million by 2010 (Amos et al 1997).
FACTORS THAT AFFECT THE PREVALENCE OF TYPE 2 DIABETES
Obesity
Obesity, especially truncal, is associated closely with type 2 diabetes. The risk increases as the BMI rises. Obesity is more likely to occur with the wrong diet and lack of physical exercise. Eating less and exercising more are at the core of programmes to delay or prevent the onset of type 2 diabetes. Four cases of type 2 diabetes in very obese (BMI greater than 35 kg/m2) white adolescents were reported by Drake et al in 2002, and widely publicised in the lay press. Forty to 50% of new-onset diabetes in American children is now type 2 (Beers et al 2006). This frightening phenomenon, likely to become more common in the future, increases the priority to resource and to implement wide-ranging effective health education programmes aimed at preventing type 2 diabetes.
Deprivation
Deprivation is associated with a higher prevalence in both sexes aged 35 to 74 years (Newnham et al 2002), although it is unclear whether this is independent of the above factors. The PBS model estimated the prevalence of diabetes to be 35% higher than the mean in the most socio-economically deprived fifth of the English population.
CONSEQUENCES OF TYPE 2 DIABETES MELLITUS
DIABETIC CONTROL, MORTALITY AND COMPLICATIONS
In its 2004 report, Diabetes UK listed some truly frightening statistics (Diabetes in the UK 2004):
Overall, 5-year mortality in type 2 diabetics increases two- to threefold and age-adjusted life expectancy is reduced by 5 to 10 years compared to the general population (Panzram 1987), with cardiovascular disease being the predominant cause of mortality.
The adverse effects of sustained hyperglycaemia and poor management on mortality and morbidity in type 2 diabetes have been studied extensively. The UKPDS has now identified poor glycaemic control among the risk factors for coronary artery disease in type 2 diabetics (Turner et al 1998). The UKPDS also demonstrated that improving glycaemic control significantly reduced the risk of microvascular complications (e.g. retinopathy, nephropathy), with lesser reductions in macrovascular disease (e.g. CHD, major stroke) and no effect on diabetes-related mortality in type 2 diabetics (UKPDS 1998a, Stratton et al 2000).
FINANCIAL CONSEQUENCES OF TYPE 2 DIABETES
In 2002, the Diabetes NSF estimated that the NHS spent £3.5 billion per year on treating diabetes and its complications (Department of Health 2002). Since then the actual costs will have increased, due to economic and health-care inflation and to the rising prevalence of type 2 diabetes. T2ARDIS estimated that diabetes was responsible for 5% of the total NHS expenditure (British Diabetic Association 2000). The prevalence of type 2 diabetes, with its associated morbidity and mortality, continues to increase, as do its costs and the pressures on those responsible for financing health care. Diabetes UK predicted that the proportion of NHS expenditure on diabetes will rise to 10% by 2011 (Diabetes in the UK 2004).
The UKPDS calculated the annual manpower cost of implementing its findings for glycaemic and blood pressure control in patients with type 2 diabetes to be £264 per patient in 1998 (UKPDS 1998a, b).
The Type 2 Diabetes: Accounting for a major Resource Demand in Society in the UK (T2ARDIS) project looked at the financial impact of type 2 diabetes and presented its results to Diabetes UK’s Annual Professional Conference in March 2000 (British Diabetic Association 2000). T2ARDIS calculated that the average annual cost of treating each person with type 2 diabetes incurred direct costs to the country of £2152, comprising:
Published in 2002, the CODE-2 study gathered data on 7000 type 2 diabetics from eight European studies: it estimated the average annual cost per patient to be £1934, of which 55% could be attributed to hospital admissions and 7% to the cost of blood glucose-lowering medication (Jonsson 2002); these estimates are not too dissimilar to T2ARDIS.
SCREENING FOR TYPE 2 DIABETES MELLITUS
GENERAL POINTS AND DEFINITIONS

Diagnostic testing and screening are two distinct processes. In diabetes, although both use the same clinical tests (blood glucose measurements), diagnostic tests are performed when an individual exhibits suggestive clinical features of diabetes, whereas screening aims to identify asymptomatic people who may already have or be at imminent risk of developing diabetes. The initial screening process may be followed by the appropriate diagnostic tests.
HOW STRONG IS THE CASE FOR SCREENING FOR TYPE 2 DIABETES?
Since setting up and implementing any screening programme can be a major undertaking with considerable costs, it is necessary to be able to evaluate the benefits of any proposal against recognised criteria (Davies 1997, The Expert Committee 2003a). The role of the National Screening Committee (NSC) is to provide advice about established and newly proposed screening programmes, with the aim of evaluating these against specified criteria, published in 1998 and divided into four areas: the condition, the test, the treatment and the screening programme (National Screening Committee 1998).
While the NSC crirteria are primarily designed to evaluate the cost-effectiveness of a screening programme, it may be more useful at practice level to evaluate the benefits of screening against established and recognised criteria (The Expert Committee 2003a). These can be summarised as follows:
The UK prevalence of diabetes in 2005 was estimated to be at least 4.67% and is rising. This prevalence is greater with increasing age, particular ethnicity and/or the presence of one or more other risk factors (hypertension, obesity, family history of diabetes) (Lawrence et al 2001).
It is estimated that about a quarter of diabetics are undiagnosed. There is good evidence that most type 2 diabetics have had their disease at least 4 to 7 years prior to clinical diagnosis (Harris et al 1992). Complications are already evident in many patients at diagnosis.
At least one-third of patients with type 2 diabetes have at least one complication present at diagnosis (UKDIABS 2000). However, type 2 diabetics identified by screening have:
This is unlikely if screening the general population solely for diabetes (Goodyer 2006). In addition to a lower yield of new cases, whole-population screening requires considerable resources. One study calculated the workload as 1 hour per week for a year to screen 620 patients during that period (Lawrence et al 2001). However, a screening programme that recruited well elderly Americans found that the presence of certain factors (age, gender, ethnicity, raised BMI, greater waist:hip ratio, hypertension) increased the yield to as much as one new case of diabetes diagnosed for every six individuals screened (Franse et al 2001).
Targeted screening of “high-risk” groups would require less resource and produce a higher yield (thus, be more practical) than screening the whole population. If additional information needed to estimate cardiovascular risk was gathered at screening, then all screened individuals, even the majority who screen negative for diabetes, could benefit from this estimation, particularly if interventions are available to reduce this risk.
In 2001 it was argued that the case for whole-population screening for diabetes could not be made (Wareham & Griffin 2001). In the light of current evidence, the case for a cost-effective screening programme can be made only if either:
PRACTICAL ISSUES IN SCREENING FOR TYPE 2 DIABETES
Who to screen?
It is sensible to create a register of these “high-risk” individuals to facilitate recall.
Which screening method to use?
Fasting plasma glucose test is less sensitive and specific, but may be a sensible compromise as the initial screening test. However, fasting plasma glucose has a reduced specificity because many individuals, particularly Indo-Asians, with a non-diabetic fasting level will have a diabetic level at 2 hours post glucose load. The STAR study suggests that a reasonable cut off for Indo-Asians under the age of 40 years is below 5.9 mmol/l. For Indo-Asians aged 40 to 75 years, an HbA1c below 6.2% is a reasonable cut-off for excluding diabetes (Davies 2006). Urine testing is simple, quick and cheap, but does not fulfil the diagnostic criteria for diabetes and a raised renal threshold may miss a diabetic blood glucose level.
THE LIKELY FUTURE SHAPE OF DIABETES SCREENING PROGRAMMES
The Diabetes Heart Disease and Stroke (DHDS) Project was set up to explore these practical issues. In its 2006 report, the overall “pick-up” rate for newly diagnosed diabetics was 4.3% of those screened (Goodyer 2006), but the rate varied, being higher in those populations where the prevelance of diabetes is greater. Although the project did not evaluate cost-effectiveness, the results do not support this in a screening programme searching solely for new cases of diabetes in a general population; rather, the screening for diabetes in a general population is best incorporated into a general vascular risk assessment.
This point both informs and underlies the Department of Health’s 2006 White Paper (DoH 2006) which proposes health MOTs at various stages of life. At the time of writing, a diabetes screening programme is unlikely to stand alone, but would be incorporated into a population-wide assessment, probably at significant age milestones (i.e. 40, 50 and 60 years), of parameters (that may include waist circumference, blood pressure, fasting lipids and glucose) which will identify a subset with metabolic syndrome that may need more frequent (every 3 years?) fasting blood glucose checks.
PREVENTION OF TYPE 2 DIABETES MELLITUS

WHY PREVENT TYPE 2 DIABETES?
The predicted rise in prevalence makes all the greater the need to consider and to implement effective preventive strategies. Not all people are at equal risk of developing diabetes. Certain factors, such as age, ethnic origin and family history, are unalterable. However, many individuals who develop type 2 diabetes have a less than optimal lifestyle, over which they do have control. Factors associated with both increased cardiovascular risk and greater insulin resistance are already present in British children, particularly of Indo-Asian origin (Whincup et al 2002). A healthier diet and increased exercise reduces insulin resistance and cardiovascular risk.
POSSIBLE INTERVENTIONS TO PREVENT TYPE 2 DIABETES: EVIDENCE BASE
Modifying lifestyle
The Da Qing IGT and Diabetes Study (China), which followed up individuals with IGT over 6 years, showed a reduction by at least one-third of the incidence of new diabetes with either diet or exercise interventions or both (Pan et al 1997).
The Finnish Diabetes Prevention Study Group, followed up overweight individuals with IGT over a mean of 3.2 years, and compared “individualised” counselling aimed at reducing weight, modifying diet and increasing physical activity against controls. The cumulative incidence of new diabetes was reduced by 58% in the intervention group, or one case of diabetes was prevented for every 22 overweight individuals with impaired glucose tolerance “treated” for 1 year (Tuomilehto et al 2001). The benefits were sustained (APR 3.1%; RRR 43%) during a median follow-up of 3 years after the intervention was discontinued (Lindstom 2006).
The Diabetes Prevention Program (DPP) in the USA, followed up “high-risk” subjects over a mean of 2.8 years, and compared three arms: standard lifestyle recommendations plus placebo, standard lifestyle recommendations plus metformin, and an intensive programme of lifestyle modification (16 lessons covering diet, exercise and behaviour modification). The reduction in incidence of new cases of diabetes was 31% in the metformin group (treat 41.7 subjects for 1 year to prevent one new case) and 58% in the intensive programme group (treat 20.7 subjects for 1 year to prevent one new case) (Diabetes Prevention Program Research Group 2002).
Medication
The HOPE and LIFE studies found that inhibition of the renin-angiotensin system may improve glucose tolerance. The LIFE study authors suggested an effect on insulin resistance, but other hypotheses suggest an increased insulin secretory response, either by inducing a raised pancreatic islet blood flow to secure a better early insulin response (Carlsson et al 1998) or as a result of the higher serum potassium levels associated with ACE-inhibitor use augmenting insulin secretion (Santoro et al 1992).
However, a recent systematic review concluded that, despite data that some drugs lowered the incidence of diabetes compared to placebo, no single pharmacological intervention can be definitively recommended for diabetes prevention. Further research is needed, using studies designed with the incidence of diabetes as the primary outcome and of sufficient duration to differentiate between real prevention and the delay or masking of the condition (Padwal et al 2005). Whilst the benefits of lifestyle changes may last beyond the period of intervention, it is unclear whether the benefit of medication is sustained. Although evidence supports the effectiveness of both lifestyle and pharmacological interventions in reducing the risk of IGT progressing to type 2 diabetes (Gillies 2007), selecting the optimal intervention requires careful consideration of benefit vs. harm, patient preference, likely concordance, available resources and other issues that are, as yet, unresolved.
DEVELOPING POLICIES THAT TACKLE PREVENTION: ISSUES THAT NEED TO BE CONSIDERED
Societies and their health services will need to look at implementing a range of measures targeted at individuals to whole populations. Successful health education requires collaboration between disparate agencies with a unity of purpose, from appropriate government policies down to practice level. Health professionals have an important role, but are not the only players here. Government policy is reflected in Chapter 6 of the NSF Diabetes’ Strategy, which refers to national initiatives and best-practice models that tackle diet, physical activity and smoking cessation, particularly in schools and/or deprived areas (DoH 2002).