Chapter 11 Volumetric Assessment
The rationale for the use of three-dimensional echocardiography (3DE) in a clinical setting is growing stronger. The four main areas in which the value of 3DE has been investigated include (1) the analysis of cardiac volumes and left ventricular mass, (2) ischemic heart disease, (3) congenital heart disease, and (4) valvular pathology. Although various versions of 3DE have been in use since the early 1970s, “live” or real-time 3DE (RT3DE) has only been in use since the early 2000s (Figures 11-1 and 11-2; Videos 11-1 and 11-2).1
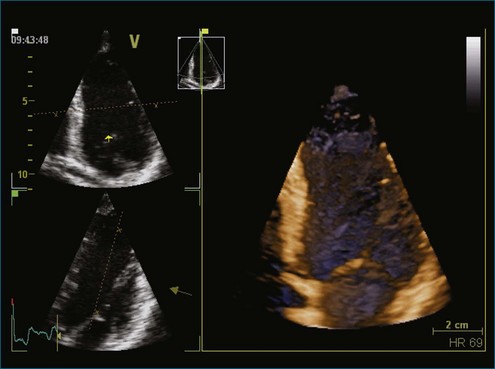
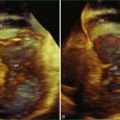
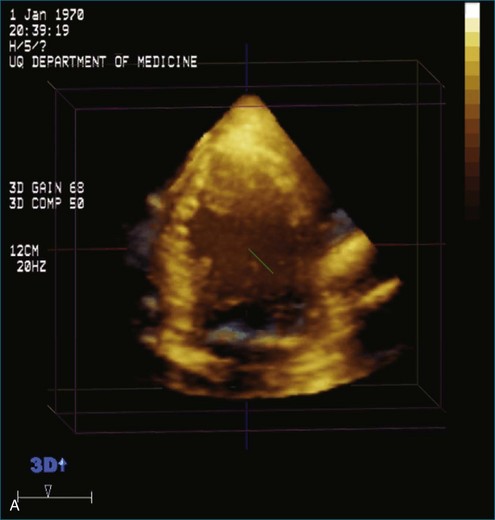
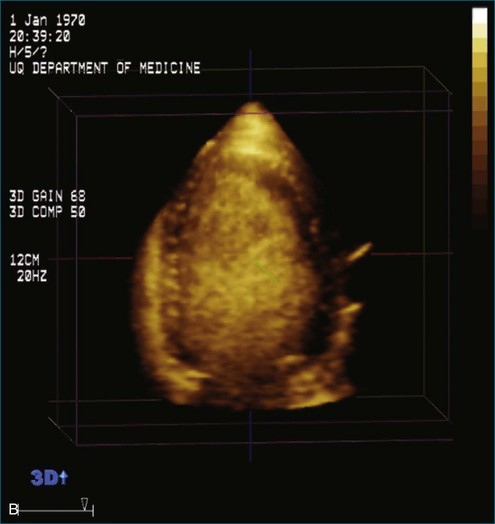
Figure 11-2 Example of a real-time three-dimensional image from the apical view (see Video 11-2).
(Courtesy EchoPAC-PC, GE Vingmed.)
3DE can display, in real time, the views and motions of deeper cardiac structures, which are unavailable by two-dimensional echocardiography (2DE), and therefore is capable of providing superior diagnostic information (Figures 11-3 to 11-5; Videos 11-3 to 11-5). This is particularly advantageous given the complex spatial relations of cardiac structures, especially in the fields of acquired valvular disease, atrial and ventricular septal defects, and left ventricular remodelling.2–4 It can also display exact assessments of left atrial volume.5,6 3DE is particularly well suited for volumetric analysis of the right ventricle since it has such an irregular shape. The ability of 3DE to simulate surgical views helps facilitate vital surgical decisions such as the accurate assessments of the effect of percutaneous balloon valvuloplasty and the function of prosthetic valves and septal occluders. Finally, 3DE may help in making more accurate qualitative diagnosis and in the classification of congenital heart disease.7
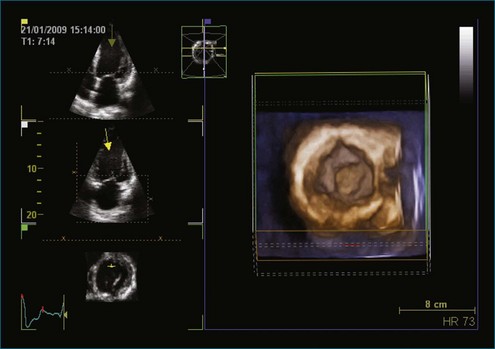
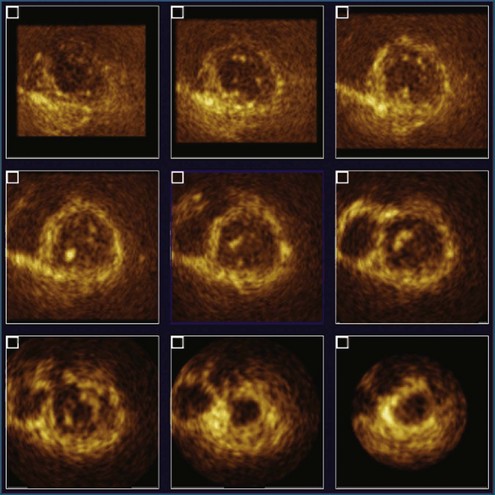
Figure 11-4 Example of nine-slice view of a full-volume three-dimensional image (see Video 11-4).
(Courtesy Philips Healthcare, Andover, MA.)
Qualitative and Quantitative Problems with Clinical Two-Dimensional Echocardiography Today
Quantification of left ventricular volumes and ejection fraction (EF) is an important aspect of cardiac evaluation in all cardiac disorders. Indeed, assessment of left ventricular function is the most common indication for echocardiography. The serial assessment of left ventricular function frequently is used to guide therapy. However, repeated measurements are prone to variation because of poor image quality, geometric issues related to volume and mass calculations, performance measurements from off-axis cuts, and variations in ventricular loading.8
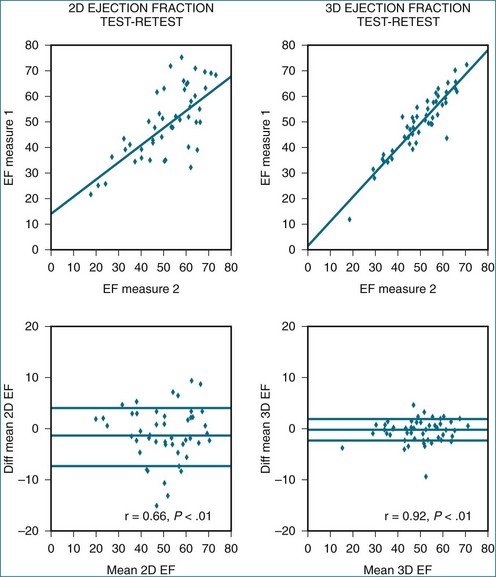
EF is a simple numeric value that reflects left ventricular function; however, it is strongly influenced by loading conditions and, in many cases, does not correlate with the patient’s symptoms. More importantly, it has limited test-retest reliability.9 Subjective visual or “eye-ball” assessment of left ventricular EF (LVEF) often is performed in clinical practice but can be misleading because of irregular heart rhythms, when the left ventricular cavity is very large or very small, or when the heart rate is very low or very fast.10 Motion mode (MM) has been used for many decades to calculate the fractional shortening and EF from the left ventricular diameters at end diastole and end systole; however, these values have large variations because of angle dependency.11 Studies have shown that Simpson’s biplane calculation of EF can vary up to 4.1% between readers.12,13 This variability is caused by the complex geometric assumptions and potential problems with image foreshortening presented by 2DE calculation of EF. Previous work by King et al11 has shown the importance of cut planes on cardiac measurements. In their study, 2DE did not achieve consistent optimal positioning of standard imaging views, resulting in a high percentage (93%) of off-axis images with resultant variations in left ventricular measurements (9%).14 Neither MM nor the Simpson’s biplane technique take into account the regional variation of the whole left ventricular volume, which may occur due to myocardial infarction. Similar findings have been reported for left ventricular mass. The smallest change of mass that can be detected with 95% confidence is 59 g, which compares with an average 20 to 40 g/year change in most antihypertensive therapy trials.15
Consequently, cardiac magnetic resonance imaging (MRI) has been proposed as a more desirable alternative for left ventricular assessment, especially in clinical trials, because of its excellent image quality and high spatial resolution.16 Given this, cardiac MRI has become the gold standard for left ventricular volumes, EF, and left ventricular mass. However, expense, patient intolerance (e.g., claustrophobia, noise), a relative contraindication in patients with cardiac devices, and lack of portability have limited the use of this modality in routine clinical practice.
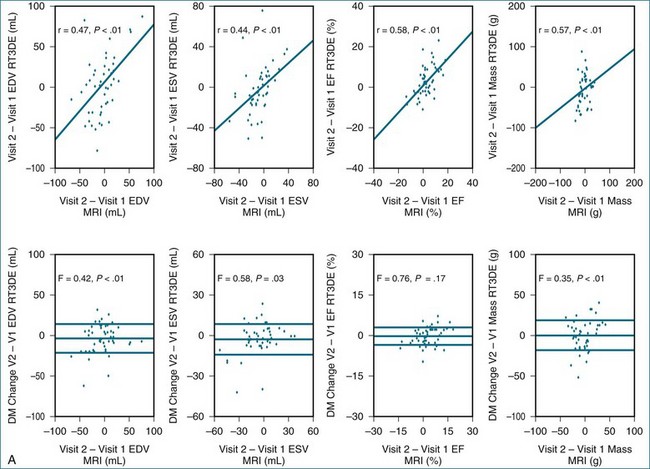
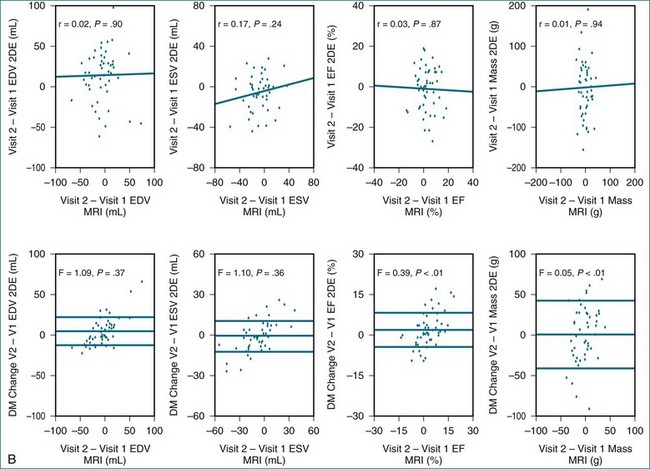
Despite the technical limitations of 2DE, it remains the most widely used noninvasive technique for the measurement of left ventricular size and function. These limitations may be overcome with the use of 3DE, which has less test-retest variation, better reproducibility, and better accuracy compared with 2DE.9,17–21
Assessment of Left Ventricular Volumes and Ejection Fraction
In the early 1990s, volumetric 3DE was developed by Duke University using a sparse matrix array transducer. This technique is based on the concept that the heart would fit into a pyramidal dataset and does not rely on the transducer movement or sequential capturing. Although the output is known as “real-time output,” it actually consists of multiple 2D images displayed simultaneously.22 Other previous 3D transducers used a modified 2D probe that had elements arranged in a single line, in which multiple windows and planes were needed to reconstruct an image. These volumetric and reconstructed volumes were found to have improved accuracy for left ventricular volumes.
These early techniques formed the basis of RT3DE. Current matrix transducers use a dense array, rather than the previous sparse array arrangement, and reportedly have more than 3000 elements.23 RT3DE uses 256 firing elements in the form of a grid instead of a line, which enables acquisition of an online 3D volume of ultrasound data (Figures 11-6 to 11-10; Videos 11-6 to 11-10).
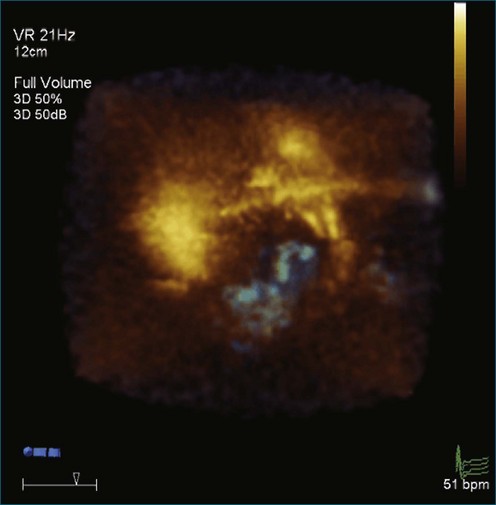
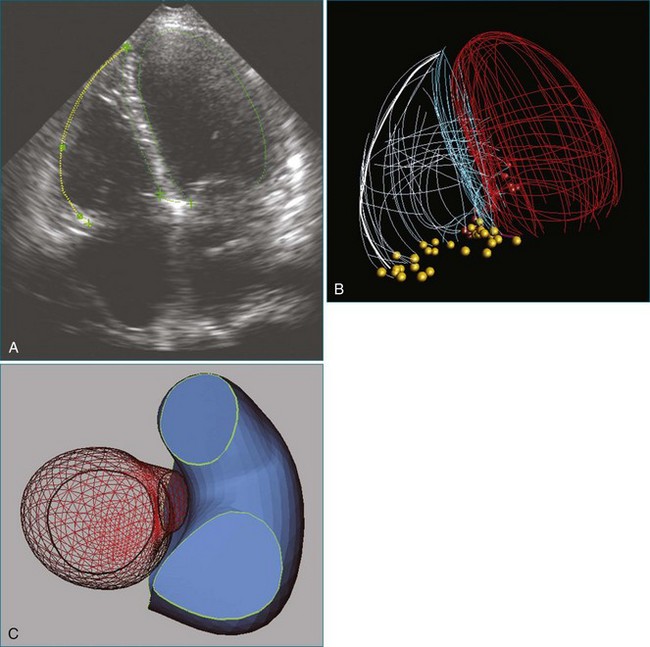
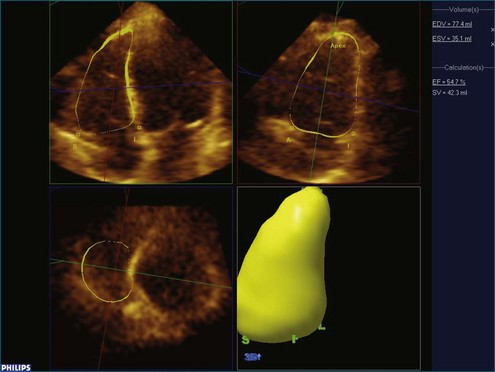
Figure 11-6 Example of normal left ventricular systolic function and wire frame over the cardiac cycle (see Video 11-6).
(Courtesy TomTec, Munich, Germany.)
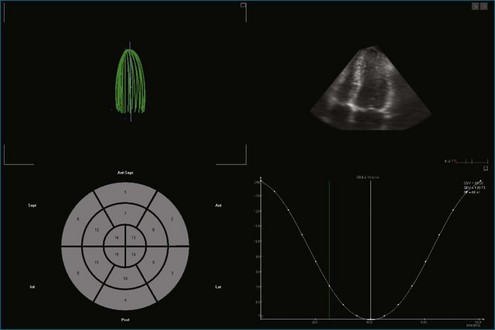
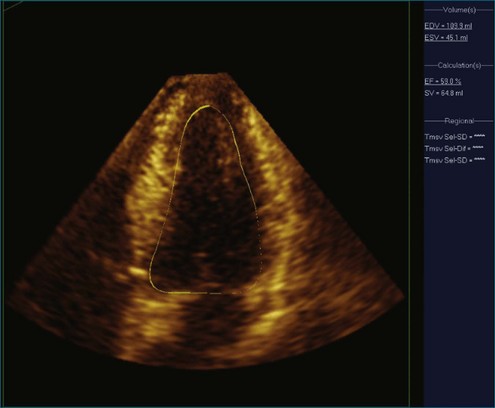
Figure 11-8 Example of poor left ventricular systolic function and the 16-segment model (see Video 11-8).
(Courtesy TomTec, Munich, Germany.)
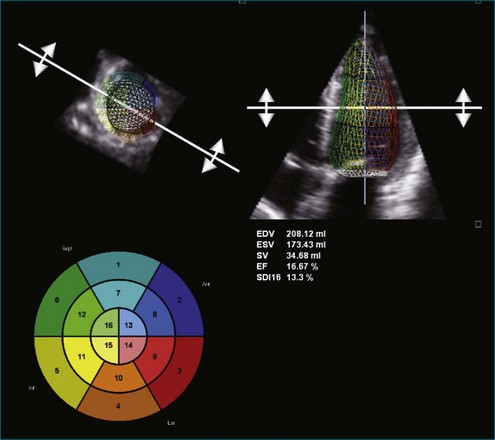
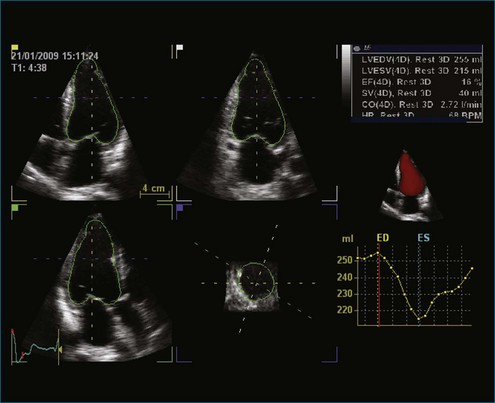
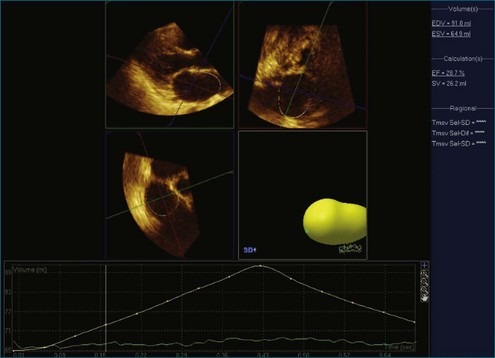
Figure 11-9 Example of poor left ventricular systolic function and a time volume curve (see Video 11-9).
(Courtesy EchoPAC-PC, GE Vingmed.)
Online 3DE allows volumetric quantification using a biplane or triplane technique.12 3DE has the advantage of accurate delineation of the true long-axis length of the ventricle, thus increasing the accuracy of Simpson’s guided biplane measurements (see Figures 11-4 and 11-5; see Videos 11-4 and 11-5). For 2DE, the accuracy of left ventricular volumes by Simpson’s method depends on the apical four-chamber and two-chamber lengths being nearly equal. Since the geometric assumptions of the 2DE calculations depend on the accuracy of ventricular lengths, foreshortening will result in underestimation of the cross-sectional area.
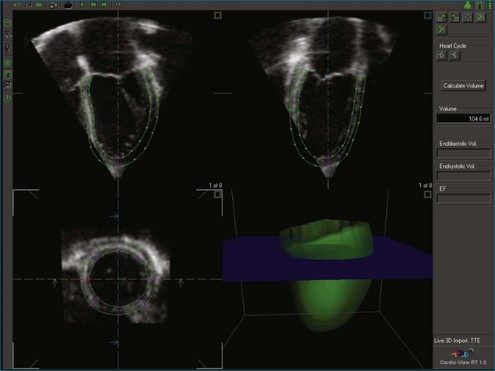
Recent advancements in 3DE technology have allowed for faster assessment in full left ventricular volume measures because of the semiautomated endocardial edge detection. Online measurement of left ventricular volumes is feasible and more accurate than with 2DE.24
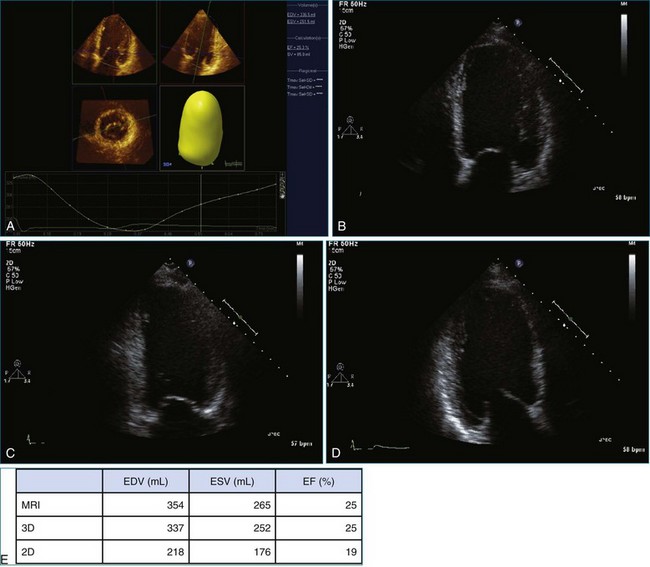
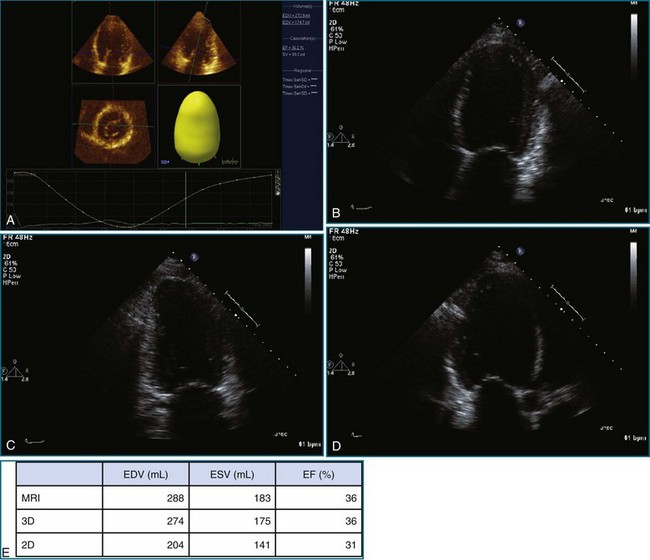
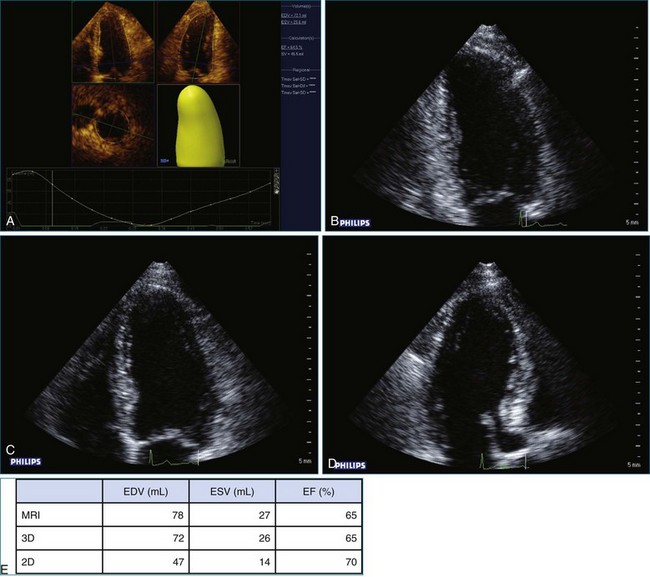
Despite semiautomated measuring techniques, 3DE has been found to underestimate left ventricular volumes compared with MRI measures. The major shortcoming of 3DE relates to the image quality of the currently obtainable images (Figure 11-11; Video 11-11). The lower line density and frame rate increase the difficulties in discriminating the endocardial border and are potential contributors to inaccuracies in the measurement of left ventricular volumes. In addition, even with the volume dataset, the apex can be difficult to visualize. However, more advanced software that allows the 3D volume datasets to be aligned such that the apex is optimally visualized has become available. The difficulty in endocardial border visualization often can be overcome by the use of contrast imaging, namely left ventricular opacification (LVO). Studies have demonstrated increased accuracy using LVO for both 2DE and 3DE calculation of left ventricular volumes and EF (Figure 11-12; Videos 11-12 and 11-13).25
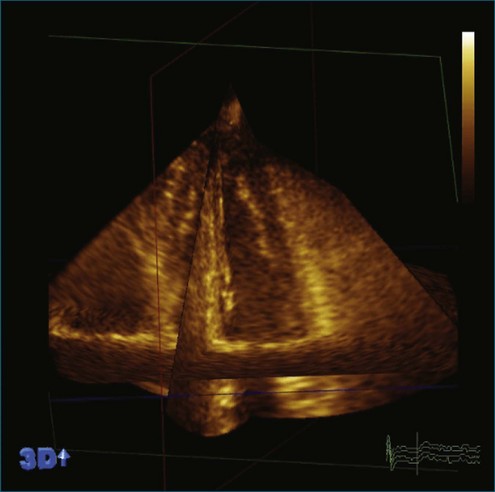
Figure 11-11 Example of a stitching artifact, one of the limitations of acquiring over four cardiac cycles (see Video 11-11).
(Courtesy Philips Healthcare, Andover, MA.)
More recently, there has been an attempt to validate a standardized protocol for measuring left ventricular volumes and EF. The first multicenter study to validate and provide information of the sources of error between MRI and 3DE found the definition of endocardial borders to be the major source of error with 3DE. In 3DE, the trabeculae are blended in with the myocardium rather than being included in the left ventricular cavity, as is the case with MRI. Another critical difference is that MRI uses short-axis slices, whereas 3DE uses long-axis slices; both use separate software for analysis. This was investigated with the use of a phantom, which found very small differences between the techniques for measured volumes (Figures 11-13 to 11-17; Videos 11-14 to 11-25).21
Left Ventricular Mass
Previous trials have based the calculation of left ventricular mass on 2DE; the smallest change of mass that can be detected with 95% confidence is 59 g, which compares with an average 20 to 40 g/year change in most antihypertensive therapy trials. However, it recently has been shown that 2DE measurements overestimate left ventricular mass because of the large number of images that are off axis.26 Again, similar to volumes, much of the variability in echocardiographic measurements relates to the problems posed by the use of geometric assumptions for calculations and the influence of different imaging planes from one scan to the next. Despite this, 2DE is frequently still performed in clinical practice for repeated testing. Using either the 3D guided biplane or the volumetric measurements of left ventricular mass, 3DE has been shown to be more feasible and reliable than 2DE (Figures 11-18 to 11-20; Videos 11-26 and 11-27).27–29
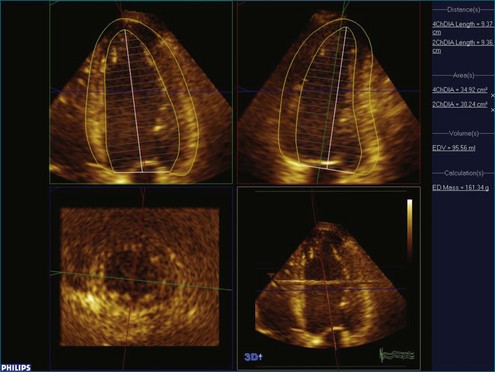
Figure 11-18 Example of three-dimensional biplane left ventricular mass measurement.
(Courtesy Philips Healthcare, Andover, MA.)
Right Ventricular Function
Echocardiography is the most widely used technique for imaging the right ventricle (RV), but assessment can be challenging because of the location of the RV behind the sternum and its crescent shape, wrapped around the left ventricle (LV) (Figure 11-21).30 Endocardial tracing and calculation of volumes may be hindered by trabeculations and the presence of the moderator band within the volume. Geometric shapes are too simplistic to be applied as models for right ventricular volume calculation. Right ventricular size and function may be difficult to assess with pulmonary disease but play an important role in clinical decision making for therapy and prognosis. Previous validation studies of the RV using 3DE have used various techniques such as reconstructed 3DE, sparse array 3DE, and now RT3DE.31–35 All have shown that this technique shows higher reproducibility than 2DE.
Clinical Use of Three-Dimensional Echocardiography Volume and Ejection Fraction Measures
The calculation of left ventricular volume and function continues to be the most commonly requested reason for echocardiography. In addition, the development of new interventions such as stem cell therapy will increase the requirement for more accurate assessment of left ventricular remodeling. The current American College of Cardiology Foundation and American Heart Association guidelines for the management of heart failure recommend the use of left ventricular dimensions and 2DE EF for this purpose.36 A number of studies have shown that 3DE has overcome many of the limitations of 2DE with less test-retest variation, better reproducibility, and better accuracy in left ventricular volume estimations. A recent study by Hare et al37 has shown differences in the classification of patients into EF thresholds using 3DE compared with 2DE, which may affect treatment decisions, especially with regard to device therapy. Moreover, 3DE appears to be superior to 2DE for evaluating left ventricular size in long-term follow-up.
Future Directions of Volume Assessment
The development of real-time acquisition of volumetric images, as opposed to reconstruction of 2DE images from multiple cycles, has made 3DE a realistic clinically applicable tool for the first time. Previous 3DE transducers have had a larger footprint and decreased image quality from lower line density and frame rates. In the past few years, there have been significant developments in 3DE transducer technology. Full volumetric assessment can now be performed in a single heartbeat, thus eliminating stitching artifact (see Figure 11-11; see Video 11-11), which occurs with multiple-beat acquisition. In addition, the actual size and footprint of RT3DE transducers have dramatically decreased such that some are virtually identical in size to those used for 3D imaging. This has resulted in greater acceptance of the 3DE technology as well as improved workflow by eliminating the need to switch transducers to perform 3D imaging.
Summary
3DE is clearly superior to 2DE for the sequential measurement of both left ventricular and right ventricular volumes and function, with accuracy and reproducibility similar to those obtained by MRI. It is an effective long-term imaging tool when sequential measurement of volumes is sought to guide management decisions. A recent study has shown that reduction of error in the estimation of left ventricular volumes with 3DE allows this method to make a greater incremental contribution to the prediction of adverse outcomes compared with 2DE.38 The accurate measurement of left ventricular EF is now a critical part of the guidelines for patients to qualify for life-saving device therapies, such as cardiac resynchronization therapy and implantable cardiac defibrillators.36 It is thus critical, given the real-life implications of these EF cutoffs for decision making, that a reproducible test with limited test-retest variation is utilized to define accurately each patient’s eligibility, thus maximizing the likelihood that a patient will be given the same assessment results irrespective of where he or she is evaluated. Although 3DE is emerging as the echocardiographic method of choice for volume assessment, practice guidelines do not yet recognize this evidence (Figures 11-22 and 11-23; Videos 11-28 and 11-29). The adoption of this technique in the clinical laboratory has been slow and may be limited by inexperience. An interactive teaching course with rehearsal and direct mentoring appears to overcome this limitation and may improve the acceptance of this technique.39
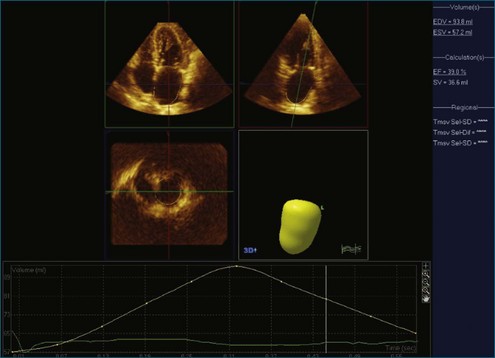
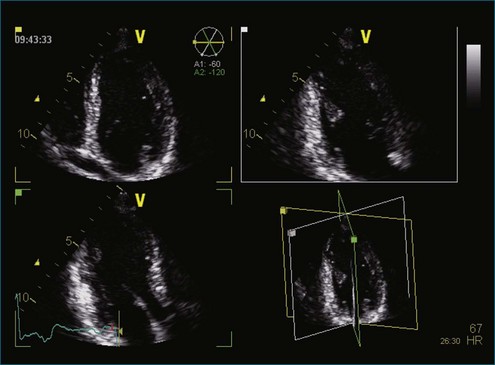
Figure 11-22 Example of left atrial volume measured in the apical view (see Video 11-28).
(Courtesy Philips Healthcare, Andover, MA.)
1 Dekker DL, Piziali RL, Dong E, Jr. A system for ultrasonically imaging the human heart in three dimensions. Comput Biomed Res. 1974;7:544–553.
2 Zamorano J, Cordeiro P, Sugeng L, et al. Real-time three-dimensional echocardiography for rheumatic mitral valve stenosis evaluation: An accurate and novel approach. J Am Coll Cardiol. 2004;43:2091–2096.
3 van den Bosch AE, Ten Harkel DJ, McGhie JS, et al. Characterization of atrial septal defect assessed by real-time 3-dimensional echocardiography. J Am Soc Echocardiogr. 2006;19:815–821.
4 Kapetanakis S, Kearney MT, Siva A, et al. Real-time three-dimensional echocardiography: A novel technique to quantify global left ventricular mechanical dyssynchrony. Circulation. 2005;112:992–1000.
5 Artang R, Migrino RQ, Harmann L, et al. Left atrial volume measurement with automated border detection by 3-dimensional echocardiography: Comparison with magnetic resonance imaging. Cardiovasc Ultrasound. 2009;7:16.
6 Jenkins C, Bricknell K, Marwick TH. Use of real-time three-dimensional echocardiography to measure left atrial volume: Comparison with other echocardiographic techniques. J Am Soc Echocardiogr. 2005;18:991–997.
7 Seliem MA, Fedec A, Cohen MS, et al. Real-time 3-dimensional echocardiographic imaging of congenital heart disease using matrix-array technology: Freehand real-time scanning adds instant morphologic details not well delineated by conventional 2-dimensional imaging. J Am Soc Echocardiogr. 2006;19:121–129.
8 Mondelli JA, Di Luzio S, Nagaraj A, et al. The validation of volumetric real-time 3-dimensional echocardiography for the determination of left ventricular function. J Am Soc Echocardiogr. 2001;14:994–1000.
9 Jenkins C, Bricknell K, Hanekom L, Marwick TH. Reproducibility and accuracy of echocardiographic measurements of left ventricular parameters using real-time three-dimensional echocardiography. J Am Coll Cardiol. 2004;44:878–886.
10 Foster E, Cahalan MK. The search for intelligent quantitation in echocardiography: “Eyeball,” “trackball” and beyond. J Am Coll Cardiol. 1993;22:848–850.
11 King DL, Harrison MR, King DL, Jr., et al. Ultrasound beam orientation during standard two-dimensional imaging: Assessment by three-dimensional echocardiography. J Am Soc Echocardiogr. 1992;5:569–576.
12 Otterstad JE, Froeland G, St John SM, Holme I. Accuracy and reproducibility of biplane two-dimensional echocardiographic measurements of left ventricular dimensions and function. Eur Heart J. 1997;18:507–513.
13 Otterstad JE. Measuring left ventricular volume and ejection fraction with the biplane Simpson’s method. Heart. 2002;88:559–560.
14 Nijland F, Kamp O, Verhorst PM, et al. Early prediction of improvement in ejection fraction after acute myocardial infarction using low dose dobutamine echocardiography. Heart. 2002;88:592–596.
15 Gottdiener JS, Livengood SV, Meyer PS, Chase GA. Should echocardiography be performed to assess effects of antihypertensive therapy? Test-retest reliability of echocardiography for measurement of left ventricular mass and function. J Am Coll Cardiol. 1995;25:424–430.
16 Bottini PB, Carr AA, Prisant LM, et al. Magnetic resonance imaging compared to echocardiography to assess left ventricular mass in the hypertensive patient. Am J Hypertens. 1995;8:221–228.
17 Jacobs LD, Salgo IS, Goonewardena S, et al. Rapid online quantification of left ventricular volume from real-time three-dimensional echocardiographic data. Eur Heart J. 2006;27:460–468.
18 Gopal AS, Shen Z, Sapin PM, et al. Assessment of cardiac function by three-dimensional echocardiography compared with conventional noninvasive methods. Circulation. 1995;92:842–853.
19 Sugeng L, Mor-Avi V, Weinert L, et al. Quantitative assessment of left ventricular size and function: Side-by-side comparison of real-time three-dimensional echocardiography and computed tomography with magnetic resonance reference. Circulation. 2006;114:654–661.
20 Jaochim NH, Sugeng L, Corsi C, et al. Volumetric analysis of regional left ventricular function with real-time three-dimensional echocardiography: Validation by magnetic resonance and clinical utility testing. Heart. 2007;93:572–578.
21 Mor-Avi V, Jenkins C, Kuhl HP, et al. Real-time 3-dimensional echocardiographic quantification of left ventricular volumes: Multicenter study for validation with magnetic resonance imaging and investigation of sources of error. JACC Cardiovasc Imag. 2008;1:413–423.
22 von Ramm OT, Smith SW. Real time volumetric ultrasound imaging system. J Digit Imag. 1990;3:261–266.
23 Houck RC, Cooke JE, Gill EA. Live 3D echocardiography: A replacement for traditional 2D echocardiography? AJR Am J Roentgenol. 2006;187:1092–1106.
24 Jenkins C, Chan J, Hanekom L, Marwick TH. Accuracy and feasibility of online 3-dimensional echocardiography for measurement of left ventricular parameters. J Am Soc Echocardiogr. 2006;19:1119–1128.
25 Jenkins C, Moir S, Chan J, et al. Left ventricular volume measurement with echocardiography: A comparison of left ventricular opacification, three-dimensional echocardiography, or both with magnetic resonance imaging. Eur Heart J. 2009;30:98–106.
26 Abramov D, Helmke S, Rumbarger L, et al. Overestimation of left ventricular mass and misclassification of ventricular geometry in heart failure patients by two-dimensional echocardiography in comparison with three-dimensional echocardiography. Echocardiography. 2010;27:223–229.
27 Mor-Avi V, Sugeng L, Weinert L, et al. Fast measurement of left ventricular mass with real-time three-dimensional echocardiography: Comparison with magnetic resonance imaging. Circulation. 2004;110:1814–1818.
28 Kuhl HP, Hanrath P, Franke A. M-mode echocardiography overestimates left ventricular mass in patients with normal left ventricular shape: A comparative study using three-dimensional echocardiography. Eur J Echocardiogr. 2003;4:312–319.
29 Rodevand O, Bjornerheim R, Kolbjornsen O, et al. Left ventricular mass assessed by three-dimensional echocardiography using rotational acquisition. Clin Cardiol. 1997;20:957–962.
30 Ho SY, Nihoyannopoulos P. Anatomy, echocardiography, and normal right ventricular dimensions. Heart. 2006;92(Suppl 1):i2–i13.
31 Pini R, Giannazzo G, Di Bari M, et al. Transthoracic three-dimensional echocardiographic reconstruction of left and right ventricles: In vitro validation and comparison with magnetic resonance imaging. Am Heart J. 1997;133:221–229.
32 Heusch A, Koch JA, Krogmann ON, et al. Volumetric analysis of the right and left ventricle in a porcine heart model: Comparison of three-dimensional echocardiography, magnetic resonance imaging and angiocardiography. Eur J Ultrasound. 1999;9:245–255.
33 Shiota T, Jones M, Chikada M, et al. Real-time three-dimensional echocardiography for determining right ventricular stroke volume in an animal model of chronic right ventricular volume overload. Circulation. 1998;97:1897–1900.
34 Schindera ST, Mehwald PS, Sahn DJ, Kececioglu D. Accuracy of real-time three-dimensional echocardiography for quantifying right ventricular volume: Static and pulsatile flow studies in an anatomic in vitro model. J Ultrasound Med. 2002;21:1069–1075.
35 Jenkins C, Chan J, Bricknell K, et al. Reproducibility of right ventricular volumes and ejection fraction using real-time three-dimensional echocardiography: Comparison with cardiac MRI. Chest. 2007;131:1844–1851.
36 Cheitlin MD, Armstrong WF, Aurigemma GP, et al. ACC/AHA/ASE 2003 guideline update for the clinical application of echocardiography: Summary article. A report of the American College of Cardiology/American Heart Association Task Force on Practice Guidelines (ACC/AHA/ASE Committee to Update the 1997 Guidelines for the Clinical Application of Echocardiography). J Am Soc Echocardiogr. 2003;16:1091–1110.
37 Hare JL, Jenkins C, Nakatani S, et al. Feasibility and clinical decision-making with 3D echocardiography in routine practice. Heart. 2008;94:440–445.
38 Jenkins C, Stanton T, Marwick TH. What is the best predictor of outcome: Ejection fraction or global strain? Eur Heart J. 2010;31:1062.
39 Jenkins C, Monaghan M, Shirali G, et al. An intensive interactive course for 3D echocardiography: Is “crop till you drop” an effective learning strategy? Eur J Echocardiogr. 2008;9:373–380.