Chapter 6 Very High-frequency Digital Ultrasound Biomicroscopy
Artemis digital ultrasound biomicroscopy
Method
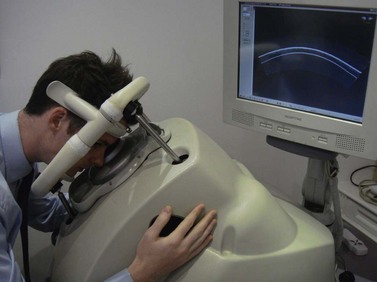
Artemis digital ultrasound is carried out using an ultrasonic standoff medium, and so provides the advantages of immersion scanning (i.e., the tear-film is not incorporated into the corneal or epithelial thickness measurement and there is no physical contact of the transducer with the cornea). The patient sits and positions the chin and forehead into a headrest while placing the eye in a soft rimmed eye-cup (Figure 6.1). Warm sterile normal saline (33 °C) is filled into the darkened scanning chamber. The patient fixates on a narrowly focused coaxial aiming beam with the infrared camera, the corneal vertex and the centre of rotation of the scanning system. The technician adjusts the center of rotation of the system until it is coaxial with the corneal vertex. In this manner, the position of each scan plane is maintained about a single point on the cornea and corneal mapping is therefore centered on the corneal vertex. A speculum is not required as patients find it comfortable to open the eye without blinking in the warm saline bath and voluntary elevation of the upper lid produces exposure of the central 10 mm of cornea in virtually all patients. Performing a three-dimensional scan set with the Artemis 1 takes approximately 2 to 3 minutes per eye.
Signal processing
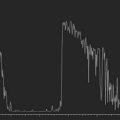
Digital signal processing (deconvolution and determination of the signal envelope by analytic signal magnitude detection) converts the data to I-scans,1 and the peaks on the I-scan represent the precise location of the corneal tissue interfaces along each scan line (Figure 6.2). The time-based distances between I-scan peaks are converted to microns using the speed of sound constant for cornea of 1640 ms−1.2,3 The resolution of the system is 21 µm meaning that distinct echo-peaks can be seen on the I-scan for a corneal layer thicker than 21 µm. An interactive semiautomatic expert system is used to locate the interface peaks on the I-scan,4 which are then double checked manually and changes can be made by the observer in places where the incorrect peak has been identified. A linear polar–radial interpolation function is used to interpolate between scan meridians to produce a Cartesian matrix over a 10 mm diameter in 0.1 mm steps. The interpolation function also includes autocorrelation of back surface curvatures to center and align the meridional scans. A four scan set is our standard scanning protocol as it provides sufficiently high density of information in the central cornea with lower density of information in the periphery where it is less needed.
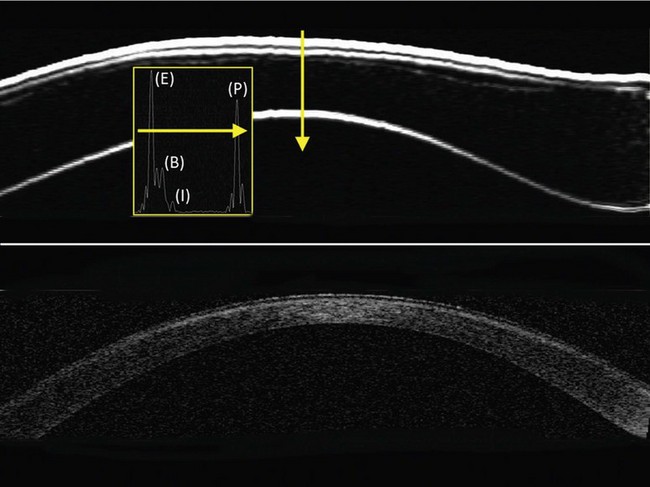
Interfaces between tissues are detected at the location of the maximum change in acoustic impedance (the product of the density and the speed of sound). It was first demonstrated in 1993 that acoustic interfaces being detected in the cornea were located spatially at the epithelial surface and at the interface between epithelial cells and the anterior surface of Bowman’s layer.5 The posterior boundary of the stroma with VHF digital ultrasound is located at the interface between the endothelium and the aqueous as this is the location of the maximum change in acoustic impedance. Therefore, stromal thickness with VHF digital ultrasound is measured from the front surface of Bowman’s layer to the back surface of the endothelium.
Corneal applications
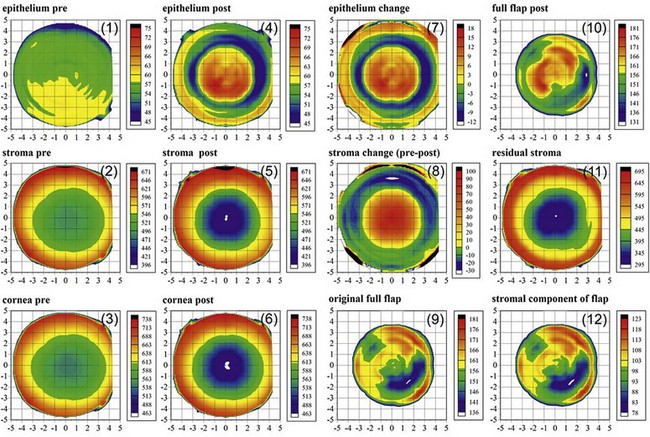
The Artemis has the ability to measure individual corneal layers including the epithelium, stroma and flap thickness. A “C12” display is the standard display of layered corneal pachymetry maps before and after a laser-assisted in situ keratomileusis (LASIK) procedure (Figure 6.3). This display includes maps of the epithelial, stromal and corneal thickness before and after LASIK, as well as the change for the epithelium and stroma (which represents the ablated stromal tissue). The display also includes maps for the postop flap thickness, residual stromal bed thickness, stromal component of the flap, and original flap thickness which is derived by adding the preoperative epithelial thickness to the stromal component of the flap to represent the flap thickness at the time of creation.6–8 Thickness measurements using the Artemis have a high repeatability for the epithelium (0.58 µm), stroma (1.78 µm), cornea (1.68 µm), flap (1.68 µm) and residual stromal bed (2.27 µm).9
Corneal epithelium
Normal corneal epithelium
The average epithelial thickness map revealed that the epithelium was not a layer of homogeneous thickness as had previously been thought, but followed a very distinct pattern; on average the epithelium was 5.7 µm thicker inferiorly than superiorly, and 1.2 µm thicker temporally than nasally (Figure 6.4 (1)).10 The mean central epithelial thickness was 53.4 ± 4.6 µm (range: 43.5–63.6 µm). This indicated that there was little variation in central epithelial thickness in the population. The thinnest epithelial point within the central 5 mm of the cornea was displaced 0.33 mm (±1.08) temporally and 0.90 mm (±0.96) superiorly with reference to the corneal vertex.
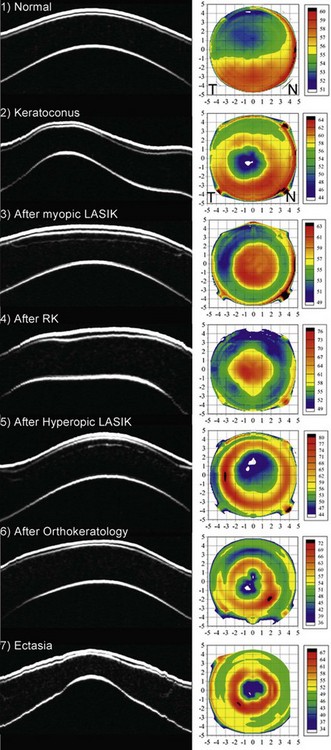
The finding that the epithelium was thinner superiorly was a surprising result; however, we have recently suggested that eyelid mechanics and blinking might be responsible for the non-uniform epithelial thickness profile seen in normal corneas.5 We postulated that the eyelid might effectively be polishing the surface epithelium during blinking, with greater forces applied on the superior cornea than on the inferior cornea. This could explain why the epithelium was found to be thinner superiorly.
Keratoconic epithelium
In keratoconus, the epithelium is known to thin in the area overlying the cone11–13 and in advanced keratoconus, there may be excessive epithelial thinning leading to a breakdown in the epithelium. The average epithelial thickness profile in keratoconus revealed that the epithelium was significantly more irregular in thickness compared to the normal population (Figure 6.4 (2)).14 The epithelium was thinnest at the apex of the cone and this thin epithelial zone was surrounded by an annulus of thickened epithelium, which we refer to as an epithelial doughnut pattern. The location of the thinnest epithelium within the central 5 mm of the cornea was displaced 0.48 mm (±0.66 mm) temporally and 0.32 mm (±0.67 mm) inferiorly with reference to the corneal vertex. The mean epithelial thickness for all eyes was 45.7 ± 5.9 µm (range: 33.1–56.3 µm) at the corneal vertex, 38.2 ± 5.8 µm at the thinnest point (range: 29.6–52.4 µm), and 66.8 ± 7.2 µm (range: 54.1–94.4 µm) at the thickest location. The epithelial thickness was outside the range observed in the normal population in both the thinnest and thickest regions, demonstrating the extent of the change in epithelial thickness in keratoconus.14 The degree of epithelial compensation was found to be correlated with the severity of the keratoconus.
We have recently proposed that epithelial thickness profile maps may be used as a new adjunctive diagnostic tool, with the aim to provide higher specificity and sensitivity to diagnose early cases of keratoconus when topography is equivocal.15 In keratoconus, the cone is often represented by a high, eccentric apex on both anterior and posterior elevation best-fit sphere (BFS).16,17 Our hypothesis is that front and back corneal surfaces are yoked, meaning that any back surface ectatic change will therefore be accompanied by a front stromal surface ectatic change (Figure 6.5). The epithelial doughnut pattern that we have observed in keratoconus will act to minimize the extent of the cone on anterior elevation BFS. Therefore, epithelial changes could potentially fully compensate the stromal surface irregularity for small amounts of stromal front surface ectasia and render a completely normal anterior elevation BFS, while the ectasia would still be apparent on the posterior surface elevation BFS. However, not all posterior elevation BFS changes will be due to keratoconus, which is why there is a need for a diagnostic tool to confirm or exclude a diagnosis of keratoconus in eyes with an eccentric posterior elevation BFS.
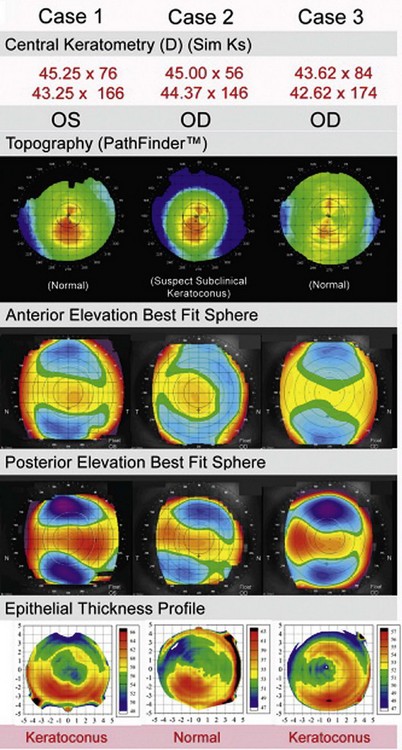
From our data, out of 1532 consecutive myopic eyes screened for refractive surgery, 136 eyes were considered keratoconus suspect and had their epithelial thickness profile mapped with Artemis. Only 22 eyes out of 136 eyes (16%) were found to have an epithelial doughnut pattern, which confirmed them as keratoconic.18 One hundred and fourteen eyes (84%) showed normal epithelial thickness profile and were deemed suitable for corneal refractive surgery. One year and 2 year post-LASIK follow-up data on these eyes demonstrated stability and refractive outcomes similar to matched control eyes.18,19
Epithelial thickness changes after refractive surgery
The importance of epithelial changes in corneal refractive surgery has probably been underestimated. Significant changes in epithelial thickness profiles after both PRK20,21 and LASIK22–24 have been demonstrated and implicated in regression as well as in the inaccuracy of topographically guided excimer laser ablation.25 A lenticular epithelial thickness change has been shown after myopic laser ablation; central epithelial thickening partially compensates for the ablated stromal tissue (Figure 6.4 (3)).26 A similar change is seen after radial keratotomy (Figure 6.4 (4)) although the epithelium responds to changes in curvature alone after radial keratotomy (RK) without tissue removal.27 In our recent study, these epithelial thickness changes were present in eyes up to 26 years after the radial keratotomy procedure, which indicates that epithelial changes are a permanent response to corneal curvature changes. Compensatory epithelial thickness changes are also seen after hyperopic laser ablation, characterized by central epithelial thinning and paracentral epithelial thickening overlying the location of maximum ablation (Figure 6.4 (5)).28
The curvature of Bowman’s layer in the center of the normal cornea is on average greater than that of the epithelial surface.29 As the refractive index of epithelium and stroma are sufficiently different (1.401 vs. 1.377),30 the epithelial–stromal interface constitutes an important refractive interface within the cornea, with a mean power contribution estimated at approximately −3.60D.29 Therefore, unpredicted changes in the epithelial lenticule after surgery as described will result in unplanned refractive shifts. This is one of the reasons why current ablation depths and profiles (“nomograms”) differ from theoretical ablation profiles – they incorporate the average change of epithelial power for a given level of stromal surface flattening (level of myopia treated).
Knowledge of the epithelial thickness also has other applications. It is currently assumed that hyperopic LASIK should be limited according to postoperative curvature as too much steepening can result in epitheliopathy or apical syndrome; it is generally accepted that the postoperative curvature should not exceed 49.00 to 50.00D.31 However, the results from our study suggest that epithelial thickness might be a better indicator; there can be cases where the curvature is steep but the epithelium is still thick enough to allow further steepening, and there can be cases where the curvature is flat but the epithelium is thin enough that further steepening would put the eye at risk of developing apical syndrome.28
Epithelial profile after orthokeratology
After wearing orthokeratology contact lenses overnight, the epithelium becomes thinner centrally surrounded by an annulus of epithelial thickening (Figure 6.4 (6)).32 This epithelial change has a lenticular concave shape, which contributes the majority of the achieved refractive effect. This change is forced on the epithelium by the shape of the contact lens template, but once the lens is removed the epithelium will return to its original shape according to the natural template provided by eyelid forces due to blinking and closure. This explains the temporary nature of orthokeratology.
Epithelial profile after ectasia
In ectasia, epithelial changes observed are similar to those seen in keratoconus with an epithelial donut pattern of epithelial thinning over the ectatic cone surrounded by an annulus of thicker epithelium (Figure 6.4 (7)).33
Epithelial profile in irregular astigmatism
The epithelium effectively acts as a low pass filter for both local and global changes in stromal surface curvature so that the epithelium becomes thinner over relative peaks in the stroma and becomes thicker over relative troughs in the stroma. This is summarized by the Law of Epithelial Compensation for irregular astigmatism, which we first described in 1994:34 “irregular astigmatism results in irregular epithelium.” According to this Law of Epithelial Compensation, if a patient presents with stable irregular astigmatism, by definition the epithelium has reached its maximum compensatory function.
Surface topography has been the mainstay of diagnostic testing in complicated LASIK. Recently, the introduction of aberrometry has greatly enhanced our diagnostic capabilities in being able to understand in a quantitative way how irregular astigmatism and other shape irregularities produce visual complaints. However, neither the understanding of the optical defect or the surface shape of the cornea will necessarily provide a diagnosis for the cause of the problem.25 This is due to the fact that internal corneal refractive interfaces (such as epithelial–stromal interface) are not being measured independently. The anatomical cause of a surface abnormality may only be understood at an internal corneal level (e.g., irregularities in the flap versus the stromal bed). With burgeoning surgical rates of PRK and LASIK worldwide, it is becoming increasingly evident that there is a distinct need for a method of determining the layered anatomy of the changes induced. Without an accurate anatomical diagnosis, topography or wavefront guided treatments may lead to a suboptimal treatment plan.35
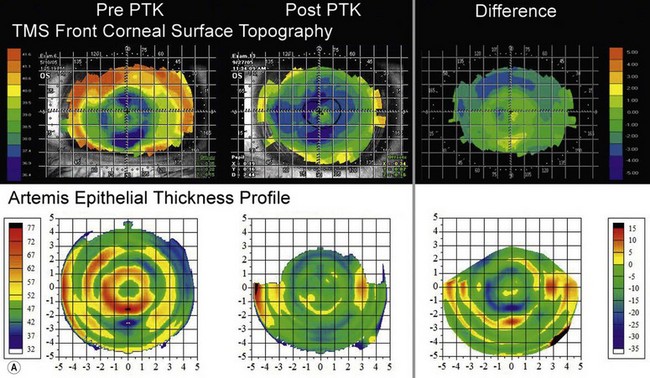
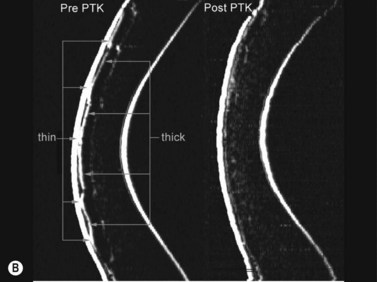
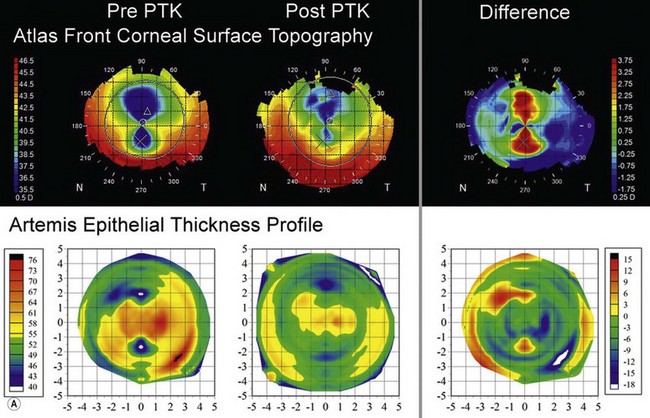
The first example shows an eye after multiple refractive procedures including ALK, AK, LASIK and LASIK enhancement, which resulted in an irregularly irregular epithelial thickness profile characterized by concentric rings of thin and thick epithelium (Figure 6.6a, b).35 In this case, topography and wavefront analysis did not provide information on the etiology of the surface irregularities. Therefore, a transepithelial phototherapeutic keratectomy (PTK) procedure was performed using the epithelium as a mask to focus the laser ablation on the areas of raised stroma in order to regularize the stromal surface, which succeeded in regularizing the stromal surface (Figure 6.6a, b).
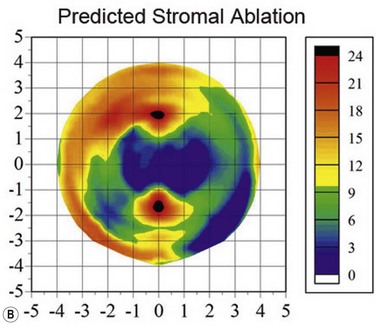
The second example shows an eye with manifest refraction of +6.50 −8.00 × 110 (CDVA 20/50), 17 years after radial keratotomy including trapezoidal incisions inferiorly and superiorly (for presbyopia). There was an irregularly irregular asymmetric bow-tie pattern decentred superiorly on topography (Figure 6.7a). However, the epithelial thickness profile (Figure 6.7a) was also very irregular with two small zones of thin epithelium (40 µm) coincident with the trapezoidal incisions and thicker epithelium (up to 75 µm) centrally. The epithelium was masking a significant proportion of the stromal irregularity from front corneal surface topography, meaning that this proportion of the stromal irregularity would not be taken into account by a topography guided ablation algorithm. Therefore, an Artemis assisted transepithelial PTK procedure was performed to target the component of the stromal irregularity compensated for by the epithelium. Nine months postoperatively, the astigmatism had been halved (manifest refraction +4.50 −4.50 × 101) and the CDVA had improved to 20/20; the significant astigmatic change can be explained by the fact that the stromal ablation was concentrated superiorly and inferiorly, exactly like a hyperopic astigmatic ablation (Figure 6.7b). Postoperatively, both the topography and epithelial thickness profile were much more regular in thickness (Figure 6.7a).
Corneal stroma
Normal cornea
Stromal thickness profile measured across the central 10 mm diameter of the cornea for the same population of 110 normal eyes described previously.36 As expected, the average stromal thickness map showed that the corneal stroma was thinner in the central cornea and became increasingly thicker towards the peripheral cornea in all directions. The thinnest central region was slightly displaced inferiorly and temporally with reference to the corneal vertex. The absolute stromal thickness progression from the thinnest point to the periphery showed very little variation within the study population and was independent of central stromal thickness. This finding might be useful for keratoconus screening as any deviation from the normal stromal thickness progression might indicate an abnormality. For example, in early keratoconus, central stromal thinning will result in an increased difference between the thinnest point and the periphery.
Stromal thickness change after refractive surgery
Ablation depth is usually studied either by calculating the difference between pre- and postoperative pachymetry,37–39 or by intraoperative handheld ultrasound subtraction pachymetry,40–42 or online optical coherence pachymetry.42,43 However, there are a number of potential sources of error with each of these methods of measuring ablation depth. All methods that use postoperative corneal thickness measurements will be compromised by the variable epithelial changes that are known to occur after excimer laser ablations, while intraoperative stromal thickness measurements are likely to be unreliable due to variability in tissue hydration.44–46 Also, each method relies on obtaining measurements in the same location at different time points. Online optical coherence pachymetry may also be affected by refractive index changes, as evidenced by the difference in correlation between optical coherence tomography (OCT) and ultrasound for preoperative and post-LASIK pachymetry; OCT preoperative corneal thickness measurements were equivalent to ultrasound, whereas OCT post-LASIK corneal thickness measurements were lower than ultrasound.47 Similarly, corneal pachymetry by optical slit-scanning pachymetry using the Orbscan II has been shown to be artifactually lower in the few months post LASIK; again, probably due to hydration changes causing refractive index changes.48–50 Therefore, online optical coherence pachymetry measurements could be affected as the cornea is thinned by excimer laser ablation, resulting in postablation measurements underestimating the actual stromal thickness.
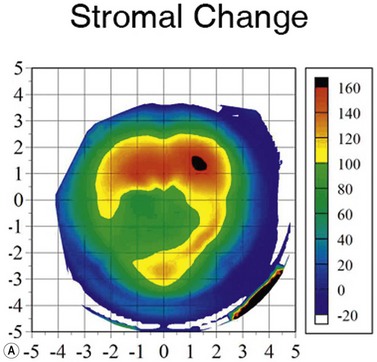
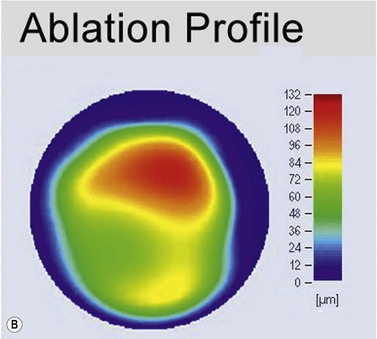
Using the Artemis, the stromal thickness can be measured directly in vivo with high repeatability, meaning that variable epithelial changes can be excluded.51,52 Also, Artemis scans are centered on the corneal vertex, so the same fixed location can be found more confidently before and after surgery, improving the potential error of finding the same measurement location compared with using a single-point handheld ultrasound pachymeter. Errors caused by intraoperative hydration and refractive index changes are also avoided. The accuracy of Artemis stromal change measurements can be appreciated by the close match seen between the stromal change and the irregular topography guided ablation profile that had been used (Figure 6.8).53
One of the most interesting findings from Artemis layered pachymetry analysis after myopic LASIK is that the stroma actually becomes thicker in the periphery where there was no ablation (Figure 6.3, map 8).54 This phenomenon was first described by us in 2000,54 and a theoretical explanation was published shortly after;55 the LASIK flap and ablation sever anterior lamellae, which reduces the strain acting on the anterior peripheral lamellae allowing them to separate causing thickening.
Flap
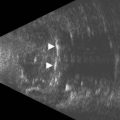
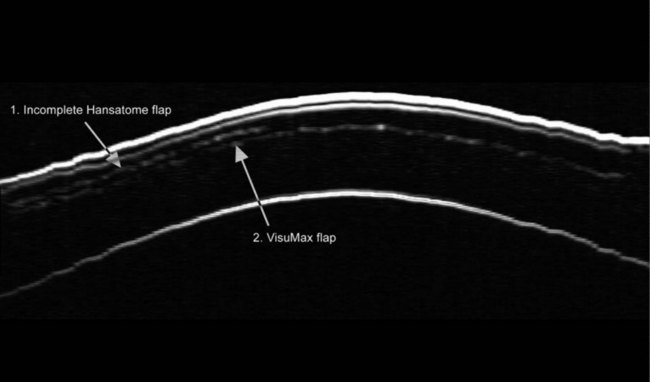
As described earlier, the Artemis can be used to image the flap and measure the flap thickness (Figure 6.2). In addition, the flap thickness can be mapped so that the flap thickness profile (and its regularity) across the whole eye can be appreciated (Figure 6.3, map 10). Imaging of the flap interface has numerous applications including evaluating microfolds (often observed in eyes where the cornea appears clear at the slit-lamp or where microfolds were only faintly visible56), epithelial ingrowth, and the diagnosis of cryptic buttonholes.57 Imaging of the flap interface also enables the potential for a flap recut to be assessed based on an accurate measurement of the thickness of the existing flap, rather than based on an assumed flap thickness according to the intended flap thickness from the primary procedure. For example, Figure 6.9 shows a case where an incomplete flap occurred using the zero compression Hansatome, and a second flap was created with the VisuMax femtosecond laser system with the depth programmed to be 20 µm thicker than the original flap to allow at least two standard deviations7 and minimize the risk of dissecting the original flap interface.
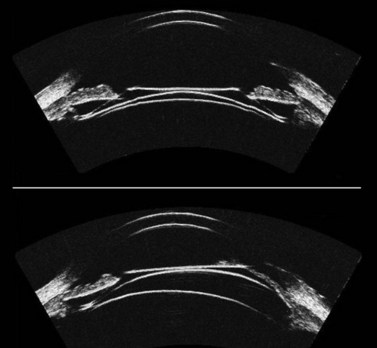
Comparison of OCT with Artemis for imaging of the flap
OCT appears to be a promising technology because of the convenience of obtaining measurements without fluid immersion; however, there appear to be a few weaknesses compared with VHF digital ultrasound. Figure 6.2 shows an Artemis B-scan and an OCT B-scan for the same eye 12 months after LASIK. The reported repeatability for flap thickness measurements of 1.7 µm with VHF digital ultrasound is significantly better than the repeatability of 8.5 µm reported for the Visante OCT.58 The most likely reason for such a large discrepancy between VHF digital ultrasound and OCT is the method of locating the flap interface from the B-scan image. Analysis of VHF digital ultrasound scans is performed based on the peaks of the I-scan trace (the raw data that makes up the image) rather than visually from the B-scan image itself, meaning that each interface can be located with less than 1 µm precision (Figure 6.2).9,54 On the other hand, the current method of identifying the flap interface using the Visante OCT is by visually placing the measurement tool on the image of the B-scan, however, the precision of the flap tool is poor since each mouse click moves the tool approximately 12 µm, although this has been improved recently with the addition of a zoom function. The repeatability of the Visante OCT might be improved if the flap interface was identified from the raw data, as has been done using a prototype version and a computer automated algorithm.59 Recently, instruments using 800 nm spectral domain OCT have been introduced which may improve the repeatability of OCT flap thickness measurements. However, at this time the scan diameter is limited to 6 mm.
Another disadvantage with OCT is the difficulty of detecting the flap interface centrally because of the signal clipping (saturation) generated by the corneal reflex and the perpendicularity of the stromal lamellae, but the central measurement is often the most important clinically. Also, the ability for OCT to detect a flap interface diminishes over time such that it is only visible in about 42% of eyes after 6 months.58 On the other hand, the flap interface can still be imaged many years postoperatively with VHF digital ultrasound.9
Residual stromal bed
Accurate and repeatable measurements of the residual stromal thickness are important for the safe practice of LASIK retreatments as we have described previously.51,60,61 A direct measurement of the residual stromal thickness is paramount before deciding whether to proceed with a retreatment. Also, due to the possibility of a non-uniform flap,6 or after a hyperopic ablation where the maximum ablation was peripheral rather than central, the ability to map the residual stromal bed across the whole cornea provides the advantage of finding the minimum thickness of the residual stromal bed, which may not be guaranteed using intraoperative single-point handheld ultrasound pachymetry.
Stromal component of the flap
Since the Artemis is capable of detecting both Bowman’s interface and the flap interface, the thickness of the stromal component of the flap can be isolated and mapped (Figure 6.3, map 12), which can be thought of as the flap thickness without the epithelium.
Reinstein flap thickness (original flap thickness – Figure 6.3, map 9)
The main application of the measurement of the stromal component of the flap is to be able to get an accurate measurement of the flap thickness profile at the time of the creation of the flap. The most common methods for measuring flap thickness are using intraoperative subtraction handheld ultrasound pachymetry or postoperative measurement by optical coherence tomography. However, both of these methods have numerous sources of error. For handheld ultrasound pachymetry, instrument precision has been reported to be approximately 6 µm,62 while errors are also caused by changes in stromal bed hydration during surgery and lack of coincidence of the probe location for corneal and residual bed measurements. With optical coherence tomography, flap thickness can be measured either by manual placement of the measuring tool on the OCT B-scan image,58, 63 with a reported repeatability of 8.7 µm or by using a proprietary automated computer algorithm,59 with a reported repeatability of 6.5 µm. Neither method takes into account postoperative epithelial changes, and, in particular, the epithelial thickening occurring after myopic ablations. This will result in an overestimation of the flap thickness centrally and introduce error due to the variable nature of epithelial response proportional to the level of myopia treated. A number of studies have reported an apparently uniform flap thickness for femtosecond laser systems;63–65 however, because the measurements were obtained using OCT postoperatively, the measured flap thickness would include central epithelial hyperplasia. Therefore, the true flap thickness profile in these studies would not be uniform; the flap would actually have been thinner centrally than peripherally.
We can circumvent the potential errors by using the VHF digital ultrasound measurement of the stromal component of the flap. Epithelial thickness changes can be accounted for by adding the thickness of the stromal component of the flap (Figure 6.3, map 12) measured after surgery to the preoperative epithelial thickness (Figure 6.3, map 1). This then represents the thickness of the flap at the time of creation assuming that the stromal component of the flap has remained stable. The postoperative measurement is obtained at least 3 months after surgery to ensure that postoperative edema has resolved. There may be thickness changes in the stromal component of the flap as the lamellae have been severed at both ends, but this has not yet been described, and any changes would certainly be less than the significant epithelial changes that are being avoided by this method. Finally, the flap thickness repeatability of 1.68 µm with the Artemis makes this the most reliable flap thickness measurement available.9 This method has been described as the Reinstein flap thickness.6–8
True flap thickness morphology
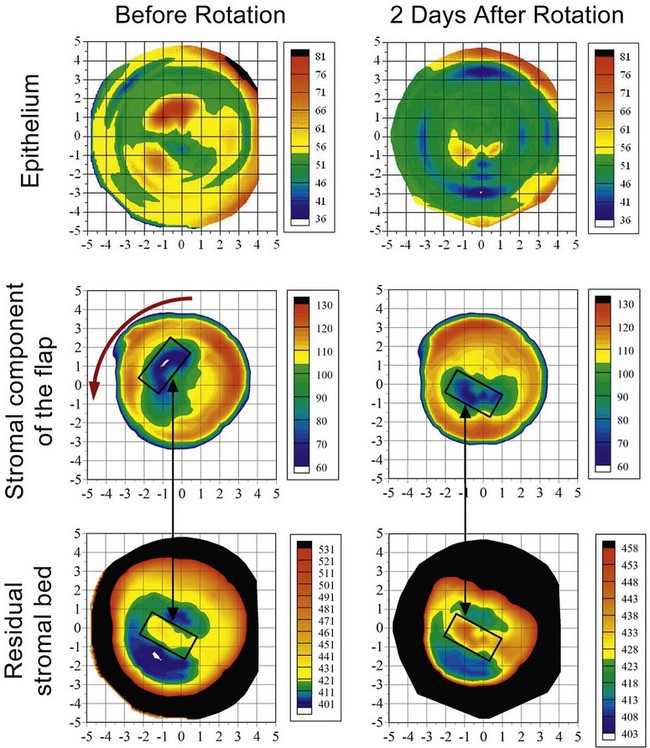
We have previously published a case patient in whom a symmetrically round free cap occurred during LASIK, and flap repositioning was performed without laser ablation.66 Two subsequent free cap rotations were performed unsuccessfully based on Hovanesian and Maloney’s free cap rotation theory,67 which uses mathematical calculations to determine the angle of misalignment based on the refractive angle of induced astigmatism from the topography.
An Artemis VHF digital ultrasound found the thickness profiles of the stromal component of the free cap and the residual stromal bed to be irregular and mismatched; the thickest region of the stromal component of the flap was overlying the ridge on the residual stromal bed (Figure 6.10). The flap misalignment also caused the epithelium to be highly irregular (Figure 6.10), which explains why the theoretical calculations based on front surface topography did not work. The required rotation was calculated by digitally generating a “lock and key” superimposition of the free cap and stromal bed thickness profiles. The procedure succeeded in realigning the free cap demonstrated by the regularization of the epithelial thickness profile (Figure 6.10) and topography.
Anterior segment applications
Aside from corneal applications, the Artemis VHF digital ultrasound arc-scanner has numerous applications in anterior segment imaging.68–73 The whole anterior segment can be imaged in a single scan and the anterior chamber, angle, iris, sclera, posterior chamber, sulcus, ciliary body, zonules, and crystalline lens can be assessed, as well as any foreign body.
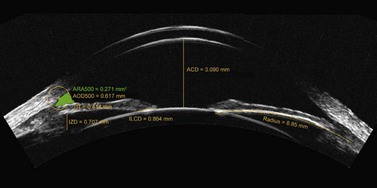
The major application is to directly measure anterior chamber dimensions to use for phakic IOL sizing, in particular the angle-to-angle diameter (angle diameter) and sulcus-to-sulcus (sulcus diameter). The Artemis 1 VHF digital ultrasound arc-scanner has previously been shown to obtain accurate, repeatable and reproducible measurements on a test object with lateral dimensions of the size commonly found in the anterior segment with accuracy of 0.00 mm, repeatability of 0.04 mm, and reproducibility of 0.01 mm.74
Anterior chamber phakic IOL sizing
Lens sizes for anterior chamber phakic IOLs have commonly been estimated by adding 0.50–1.00 mm to the horizontal white-to-white corneal diameter obtained externally.70 However, many of the postoperative complications associated with anterior chamber IOLs are due to poor lens sizing; an oversized lens can cause pupil ovalization75 and iritis,75,76 while an undersized lens can become mobile and result in endothelial cell loss75,77 and secondary glaucoma.75 Given the high rate of sizing related complications observed when using the recommended white-to-white based lens sizing formula, the validity of the assumed correlation has been put into question. There have now been a number of studies reporting a statistically significant correlation does exist between white-to-white and angle-to-angle diameter (angle diameter), however, the correlation is not clinically significant.78–81 Using the Artemis, we found that an error of >0.5 mm would be expected in 6.5% of cases if white-to-white were used to predict the angle diameter. This was improved to 3.3% by using a multivariate regression which included central corneal pachymetry and keratometry as statistically significant variables.79
Recently, a number of instruments capable of measuring the horizontal angle diameter have been developed including slit-scanning, Scheimpflug imaging, optical coherence tomography and analog ultrasound biomicroscopy (UBM). Goldsmith et al reported that using an OCT direct measurement of angle diameter would reduce the percentage of eyes where an error of more than 0.50 mm would be expected from 22% to 0.02%.78
Posterior chamber phakic IOL sizing
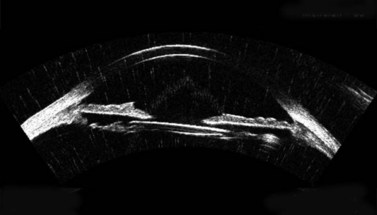
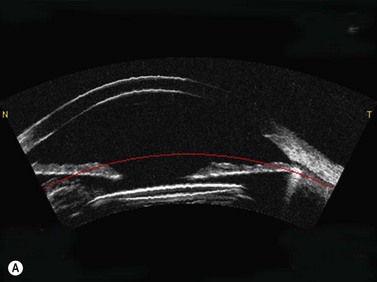
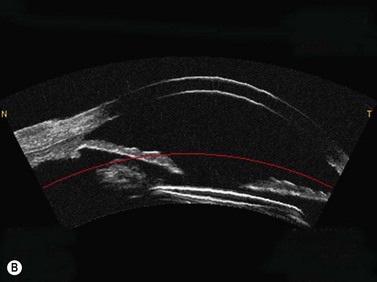
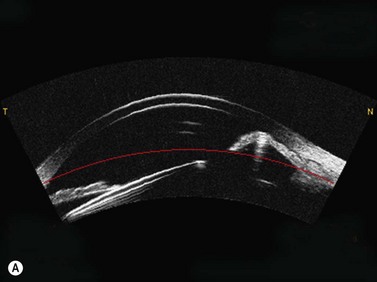
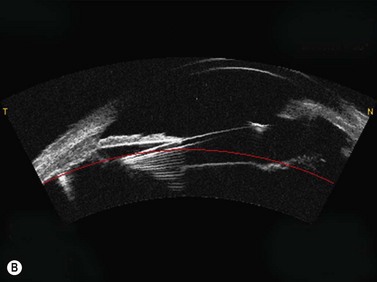
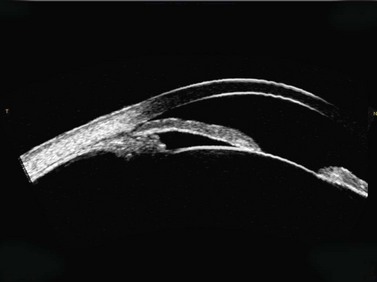
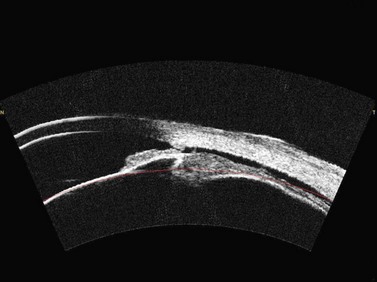
Similar to anterior chamber phakic IOLs, lens sizes for posterior chamber phakic IOLs have commonly been estimated by adding 0.50–1.00 mm to the horizontal white-to-white corneal diameter obtained externally,82,83 and have recently been approved by the FDA using this criteria.83 As with anterior chamber phakic IOLs, the common themes regarding postoperative complications of posterior chamber phakic IOL surgery is that of lens sizing; an oversized lens can cause angle closure leading to malignant glaucoma84,85 or the lens can chafe the iris leading to pigment dispersion;86–88 an undersized lens can cause cataract88–91 or damage to the zonules with dislocation of the phakic IOL (Figure 6.11).88,92
Correlations between white-to-white and sulcus diameter have proven to be even worse than between white-to-white and angle diameter as the majority of studies have found no statistically significant correlation.79,93–97 Using the Artemis, we did find a statistically significant correlation, but as with angle diameter, the correlation was not clinically significant.79 In our study, the results predicted that an error of >0.5 mm would be expected in 37.7% of cases and >1.0 mm in 7.7% of cases.
As mentioned earlier, optical instruments capable of directly measuring the angle diameter have improved lens sizing for anterior chamber phakic IOLs; however, optical instruments are not capable of directly measuring the sulcus diameter because the optical path is blocked by the pigment epithelium of the iris. It has been suggested that angle diameter might be used to estimate sulcus diameter more accurately.78,97
However, our study found that while there was a statistically significant correlation between angle diameter and sulcus diameter, it was still not clinically significant. The potential error of the predicted sulcus diameter was reduced to >0.5 mm in 27.3% of cases and >1.0 mm in 2.8% of cases when a multivariate regression analysis was used that included angle diameter and anterior chamber depth as statistically significant variables.79 However, this is still an unacceptable degree of potential error and demonstrates that angle diameter cannot be used to reliably predict sulcus diameter. A similarly weak correlation between angle diameter and sulcus diameter was also reported in a study by Pinero et al using the Artemis 2; an error in the predicted sulcus diameter of >0.5 mm would be expected in 25% of cases.72
The study by Pinero et al also included correlations of sulcus diameter with iris pigment end to iris pigment end measured with both the Artemis 2 and Visante OCT, as this has also been suggested as a potential predictor for sulcus diameter. There was a stronger correlation between iris pigment end to iris pigment end with sulcus diameter than was found for angle diameter and sulcus diameter, however, an error of >0.5 mm would still be expected in 15% of cases.72
The conclusions from the published studies must be that a direct measurement of angle diameter (for anterior chamber lenses) or sulcus diameter (for posterior chamber lenses) is crucial to minimize the risk of postoperative complications. Some surgeons are now using direct sulcus diameter measurements for lens sizing and have reported better control of vault height.70,98,99
In-situ intraocular lens imaging
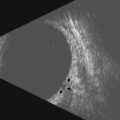
Early IOL implants were fabricated from poly(methyl methacrylate) (PMMA), but this has been replaced by soft materials such as silicone and acrylic. Because these materials differ significantly in speed-of-sound from the fluids and soft tissues of the eye (∼1540 m s−1 versus ∼2700 m s−1 for PMMA, ∼1900 m s−1 for acrylic and ∼1000 m s−1 for silicone),100 ultrasound imaging provides high-amplitude reflections at the fluid-IOL interface (Figure 6.12). Despite their optical transparency, IOLs can also be visualized using OCT or Scheimpflug imaging because of specular reflection from lens surfaces. However, optical methods are limited to viewing the lens surfaces only within the margins of the pupil. Even with dilation, the peripheral lens and haptics are not visualized with these techniques. Ultrasound, however, can readily detect the body of the lens and haptics in the presence of optically opaque structures such as the iris and sclera (Figures 6.13 and 6.14).
Glaucoma
In glaucoma, the angle is assessed by slit-lamp and gonioscopy in combination with a Goldmann contact lens. In the semi-quantitative grading system introduced by Shaffer, angle width is graded from 4 (35–45° = wide open) to grade 0 (fully closed).101 Scanning scheimpflug, and slitlamp systems are effective means for anterior segment imaging, but only provide a limited view of the angle, the site of primary interest for glaucoma. Ultrasound biomicroscopy and anterior segment OCT systems, however, provide cross-sectional images that are effective for visualization of the iridocorneal angle.102
Pavlin et al pioneered clinical UBM examination of the anterior segment103 and glaucoma.104,105 Pavlin and others demonstrated the effectiveness of UBM in characterizing plateau iris syndrome106 and pupillary block,107 which together constitute the most common forms of primary angle closure glaucoma (Chapter 9).108 In 1992, Pavlin described UBM biometric parameters for characterization of the angle and anterior segment in glaucoma.104 These included the angle opening at 250 µm and 500 µm from the scleral spur, scleral thickness at the spur, trabecular-ciliary process distance, and iris thickness at specific positions, among others. Tello et al subsequently reported the reproducibility of these measures109 and Ishikawa, Liebman and Ritch described additional criteria, especially descriptors of angle geometry (Figure 6.15).110 These criteria are of importance in allowing definition of reproducible criteria for classifying glaucoma types and documenting change over time or with treatment. Many criteria developed for assessment of the anterior segment by UBM were applied to anterior segment OCT when this technology became available. Anterior chamber angle parameters measured by OCT and UBM are reported to have similar mean values and reproducibility.111 However, since OCT cannot image the ciliary body or behind the iris plane, it is unable to perform measurements related to the ciliary body, zonules and lens posterior to the iris plane.
OCT systems provide excellent depictions of the anterior chamber and the angle, but are ineffective in visualization of the ciliary body and retroiridal structures due to light absorption and scattering by the iris and sclera. Visualization of the ciliary body is crucial, for instance, in diagnosis of plateau iris syndrome in which the ciliary body is anteriorly positioned and possibly enlarged, compressing the iridocorneal angle and placing the peripheral iris in apposition to the trabecular meshwork (Figure 6.16).108,112 In this case, both UBM and OCT can demonstrate the steep rise in the iris near the insertion point, but the anterior positioning of the ciliary processes can only be visualized with ultrasound. Ciliary body cysts, especially multiple cysts, also can cause narrowing of the angle.113–116 Ultrasound can also be useful for differentiation of malignant glaucoma117 from pupillary block104,118 both of which are characterized by very shallow anterior chambers, but with a formed posterior chamber only present in pupillary block.
Hypotony
Hypotony may generally be ascribed to insufficient production of aqueous by the ciliary epithelium, excessive outflow, or a combination of both. Reduced aqueous production may result from ciliary body dysfunction or detachment, while increased outflow may result from a loss of scleral integrity as a consequence of trauma or surgery. Coleman developed a classification scheme for hypotony based on high-frequency ultrasound.119 Ciliary body detachment was classified as either primary, tractional or dehiscence. In primary hypotony the ciliary body is detached, but no tractional component is evident (Figure 6.17). In tractional hypotony, membrane attachments between the ciliary body, iris and formed vitreous are present. In dehiscence hypotony, the ciliary body is detached following surgery or trauma in which the scleral integrity is interrupted. Visualization of the ciliary body in hypotony can thus impact upon clinical management.120,121 While ultrasound is required for assessment of ciliary body detachment, cyclodialysis clefts can be visualized using either OCT122 or ultrasound.123,124 As is the case with assessment of glaucoma, the chief advantage of the Artemis compared to hand-held UBM systems is its reproducibility and the automatic documentation of scan position in respect to the optical surface image of the eye.
1 Reinstein DZ, Silverman RH, Rondeau MJ, et al. Epithelial and corneal thickness measurements by high-frequency ultrasound digital signal processing. Ophthalmology. 1994;101(1):140-146.
2 Coleman DJ, Woods S, Rondeau MJ, et al. Ophthalmic ultrasonography. Radiol Clin North Am. 1992;30(5):1105-1114.
3 Segall M, Reinstein DZ, Johnson NF. Computer aided analysis and visualization of high-frequency ultrasound scanning of the human cornea. IEEE Computer Graphics Applications. 1999;19(4):74-82.
4 Najafi DJ, Reinstein DZ, Silverman RH, et al. An expert system for corneal layer three dimensional pachymetry. Invest Ophthalmol Vis Sci. 1997;38(4):S920.
5 Reinstein DZ, Silverman RH, Coleman DJ. High-frequency ultrasound measurement of the thickness of the corneal epithelium. Refract Corneal Surg. 1993;9(5):385-387.
6 Reinstein DZ, Sutton HF, Srivannaboon S, et al. Evaluating microkeratome efficacy by 3D corneal lamellar flap thickness accuracy and reproducibility using Artemis VHF digital ultrasound arc-scanning. J Refract Surg. 2006;22(5):431-440.
7 Reinstein DZ, Archer TJ, Gobbe M, et al. Accuracy and reproducibility of Artemis central flap thickness and visual outcomes of LASIK with the Carl Zeiss Meditec VisuMax femtosecond laser and MEL 80 Excimer laser platforms. J Refract Surg. 2010;26(2):107-119.
8 Reinstein DZ, Archer TJ, Gobbe M. Flap thickness profile and reproducibility of the standard vs zero compression hansatome microkeratomes: three-dimensional display with Artemis very high-frequency digital ultrasound. J Refract Surg 2010;15:1–10.
9 Reinstein DZ, Archer TJ, Gobbe M, et al. Repeatability of layered corneal pachymetry with the Artemis very high-frequency digital ultrasound arc-scanner. J Refract Surg. 2010;26(9):646-659.
10 Reinstein DZ, Archer TJ, Gobbe M, et al. Epithelial thickness in the normal cornea: three-dimensional display with Artemis very high-frequency digital ultrasound. J Refract Surg. 2008;24(6):571-581.
11 Scroggs MW, Proia AD. Histopathological variation in keratoconus. Cornea. 1992;11(6):553-559.
12 Haque S, Simpson T, Jones L. Corneal and epithelial thickness in keratoconus: a comparison of ultrasonic pachymetry, Orbscan II, and optical coherence tomography. J Refract Surg. 2006;22(5):486-493.
13 Aktekin M, Sargon MF, Cakar P, et al. Ultrastructure of the cornea epithelium in keratoconus. Okajimas Folia Anat Jpn. 1998;75(1):45-53.
14 Reinstein DZ, Archer TJ, Gobbe M, et al. Epithelial, stromal and corneal thickness in the keratoconic cornea: three-dimensional display with Artemis very high-frequency digital ultrasound. J Refract Surg. 2010;26(4):259-271.
15 Reinstein DZ, Archer TJ, Gobbe M. Corneal epithelial thickness profile in the diagnosis of keratoconus. J Refract Surg. 2009;25(7):604-610.
16 Rao SN, Raviv T, Majmudar PA, et al. Role of Orbscan II in screening keratoconus suspects before refractive corneal surgery. Ophthalmology. 2002;109(9):1642-1646.
17 Lim L, Wei RH, Chan WK, et al. Evaluation of keratoconus in Asians: role of Orbscan II and Tomey TMS-2 corneal topography. Am J Ophthalmol. 2007;143(3):390-400.
18 Reinstein DZ, Archer TJ, Gobbe M. Stability of LASIK in corneas with topographic suspect keratoconus, with keratoconus excluded by epithelial thickness mapping. J Refract Surg. 2009;25(7):569-577.
19 Reinstein DZ, Archer TJ, Gobbe M. Stability of LASIK in corneas with topographic suspect keratoconus confirmed non-keratoconic by epithelial thickness mapping: 2-years follow-up. San Francisco: AAO; 2009.
20 Gauthier CA, Holden BA, Epstein D, et al. Factors affecting epithelial hyperplasia after photorefractive keratectomy. J Cataract Refract Surg. 1997;23(7):1042-1050.
21 Lohmann CP, Reischl U, Marshall J. Regression and epithelial hyperplasia after myopic photorefractive keratectomy in a human cornea. J Cataract Refract Surg. 1999;25(5):712-715.
22 Srivannaboon S, Reinstein DZ, Sutton HFS, et al. Effect of epithelial changes on refractive outcome in LASIK. Invest Ophthalmol Vis Sci. 1999;40(4):S896.
23 Reinstein DZ, Srivannaboon S, Silverman RH, et al. Limits of wavefront customized ablation: Biomechanical and epithelial factors. Invest Ophthalmol Vis Sci. 2002;43:3942. E-Abstract
24 Reinstein DZ, Srivannaboon S, Silverman RH, et al. The accuracy of routine LASIK; isolation of biomechanical and epithelial factors. Invest Ophthalmol Vis Sci. 2000;41(Suppl):S318.
25 Reinstein DZ, Silverman RH, Sutton HF, et al. Very high-frequency ultrasound corneal analysis identifies anatomic correlates of optical complications of lamellar refractive surgery: anatomic diagnosis in lamellar surgery. Ophthalmology. 1999;106(3):474-482.
26 Reinstein DZ, Srivannaboon S, Gobbe M, et al. Epithelial thickness profile changes induced by myopic LASIK as measured by Artemis very high-frequency digital ultrasound. J Refract Surg. 2009;25(5):444-450.
27 Reinstein DZ, Archer TJ, Gobbe M. Epithelial thickness 17 years after radial keratotomy: three-dimensional display with Artemis very high-frequency digital ultrasound. J Refract Surg. 2011;Feb 1:1-7. doi 10.3928/1081597X-20110125-01. [Epub ahead of print]
28 Reinstein DZ, Archer TJ, Gobbe M, et al. Epithelial thickness after hyperopic LASIK: three-dimensional display with Artemis very high-frequency digital ultrasound. J Refract Surg. 2010;26(8):555-564.
29 Patel S, Reinstein DZ, Silverman RH, et al. The shape of Bowman’s layer in the human cornea. J Refract Surg. 1998;14(6):636-640.
30 Patel S, Marshall J, Fitzke FW. Refractive index of the human corneal epithelium and stroma. J Refract Surg. 1995;11(2):100-105.
31 Varley GA, Huang D, Rapuano CJ, et al. LASIK for hyperopia, hyperopic astigmatism, and mixed astigmatism: a report by the American Academy of Ophthalmology. Ophthalmology. 2004;111(8):1604-1617.
32 Reinstein DZ, Gobbe M, Archer TJ, et al. Epithelial, stromal, and corneal pachymetry changes during orthokeratology. Optom Vis Sci. 2009;86(8):E1006-E1014.
33 Reinstein DZ, Gobbe M, Archer TJ, et al. Epithelial thickness profile as a method to evaluate the effectiveness of collagen cross-linking treatment after corneal ectasia. J Refract Surg. 2010:1-8. [Online])
34 Reinstein DZ, Aslanides IM, Silverman RH, et al. Epithelial and corneal 3D ultrasound pachymetric topography post excimer laser surgery. Invest Ophthalmol Vis Sci. 1994;35(4):1739.
35 Reinstein DZ, Archer T. Combined Artemis very high-frequency digital ultrasound-assisted transepithelial phototherapeutic keratectomy and wavefront-guided treatment following multiple corneal refractive procedures. J Cataract Refract Surg. 2006;32(11):1870-1876.
36 Reinstein DZ, Archer TJ, Gobbe M, et al. Stromal thickness in the normal cornea: three-dimensional display with Artemis very high-frequency digital ultrasound. J Refract Surg. 2009;25(9):776-786.
37 Maldonado MJ, Ruiz-Oblitas L, Munuera JM, et al. Optical coherence tomography evaluation of the corneal cap and stromal bed features after laser in situ keratomileusis for high myopia and astigmatism. Ophthalmology. 2000;107(1):81-87. discussion 88
38 Cheng HC, Chen YT, Yeh SI, et al. Errors of residual stromal thickness estimation in LASIK. Ophthalmic Surg Lasers Imaging. 2008;39(2):107-113.
39 Zhao MH, Zou J, Wang WQ, et al. Comparison of central corneal thickness as measured by non-contact specular microscopy and ultrasound pachymetry before and post LASIK. Clin Experiment Ophthalmol. 2007;35(9):818-823.
40 Nagy ZZ, Resch M, Suveges I. Ultrasound evaluation of flap thickness, ablation depth, and corneal edema after laser in situ keratomileusis. J Refract Surg. 2004;20(3):279-281.
41 Durairaj VD, Balentine J, Kouyoumdjian G, et al. The predictability of corneal flap thickness and tissue laser ablation in laser in situ keratomileusis. Ophthalmology. 2000;107(12):2140-2143.
42 Arbelaez MC, Vidal C, Arba Mosquera S. Central ablation depth and postoperative refraction in excimer laser myopic correction measured with ultrasound, Scheimpflug, and optical coherence pachymetry. J Refract Surg. 2009;25(8):699-708.
43 Wirbelauer C, Aurich H, Jaroszewski J, et al. Experimental evaluation of online optical coherence pachymetry for corneal refractive surgery. Graefes Arch Clin Exp Ophthalmol. 2004;242(1):24-30.
44 Dougherty PJ, Wellish KL, Maloney RK. Excimer laser ablation rate and corneal hydration. Am J Ophthalmol. 1994;118(2):169-176.
45 Silverman RH, Patel MS, Gal O, et al. Effect of corneal hydration on ultrasound velocity and backscatter. J Ultrasound Med. 2009;35(5):839-846.
46 Barraquer JI. Queratomileusis y queratofakia. Bogota: Instituto Barraquer de America; 1980. p. 342
47 Li Y, Shekhar R, Huang D. Corneal pachymetry mapping with high-speed optical coherence tomography. Ophthalmology. 2006;113(5):799. e791–792
48 Prisant O, Calderon N, Chastang P, et al. Reliability of pachymetric measurements using orbscan after excimer refractive surgery. Ophthalmology. 2003;110(3):511-515.
49 Iskander NG, Anderson Penno E, Peters NT, et al. Accuracy of Orbscan pachymetry measurements and DHG ultrasound pachymetry in primary laser in situ keratomileusis and LASIK enhancement procedures. J Cataract Refract Surg. 2001;27(5):681-685.
50 Chakrabarti HS, Craig JP, Brahma A, et al. Comparison of corneal thickness measurements using ultrasound and Orbscan slit-scanning topography in normal and post-LASIK eyes. J Cataract Refract Surg. 2001;27(11):1823-1828.
51 Reinstein DZ, Srivannaboon S, Archer TJ, et al. Probability model of the inaccuracy of residual stromal thickness prediction to reduce the risk of ectasia after LASIK part I: quantifying individual risk. J Refract Surg. 2006;22(9):851-860.
52 Reinstein DZ, Archer TJ, Gobbe M. Corneal ablation depth readout of the MEL80 excimer laser compared to Artemis three-dimensional very high-frequency digital ultrasound stromal measurements. J Refract Surg. 2009. [Online]
53 Reinstein DZ, Archer TJ, Gobbe M. Artemis very high-frequency digital ultrasound evaluation of topography guided repair after radial keratotomy. J Cataract Refract Surg. 2011;37(3):599-602.
54 Reinstein DZ, Silverman RH, Raevsky T, et al. Arc-scanning very high-frequency digital ultrasound for 3D pachymetric mapping of the corneal epithelium and stroma in laser in situ keratomileusis. J Refract Surg. 2000;16(4):414-430.
55 Roberts C. The cornea is not a piece of plastic. J Refract Surg. 2000;16(4):407-413.
56 Reinstein DZ, Silverman RH, Archer TJ. VHF digital ultrasound: Artemis 2 scanning in corneal refractive surgery. In: Vinciguerra P, Camesasca FI, editors. Refractive Surface Ablation: Prk, LASEK, Epi-LASIK, Custom, PTK and Retreatment. SLACK; 2006:315-330.
57 Reinstein DZ. Consultation section. J Cataract Refract Surg. 2001;27(9):1350-1352.
58 Carl Zeiss Meditec. Visante OCT User’s Manual, 2006.
59 Li Y, Netto MV, Shekhar R, et al. A longitudinal study of LASIK flap and stromal thickness with high-speed optical coherence tomography. Ophthalmology. 2007;114(6):1124-1132.
60 Reinstein DZ, Srivannaboon S, Archer TJ, et al. Probability model of the inaccuracy of residual stromal thickness prediction to reduce the risk of ectasia after LASIK part II: quantifying population risk. J Refract Surg. 2006;22(9):861-870.
61 Reinstein DZ, Couch DG, Archer T. Direct residual stromal thickness measurement for assessing suitability for LASIK enhancement by Artemis 3D very high-frequency digital ultrasound arc scanning. J Cataract Refract Surg. 2006;32(11):1884-1888.
62 Yaylali V, Kaufman SC, Thompson HW. Corneal thickness measurements with the Orbscan Topography System and ultrasonic pachymetry. J Cataract Refract Surg. 1997;23(9):1345-1350.
63 Stahl JE, Durrie DS, Schwendeman FJ, et al. Anterior segment OCT analysis of thin IntraLase femtosecond flaps. J Refract Surg. 2007;23(6):555-558.
64 Ju WK, Lee JH, Chung TY, et al. Reproducibility of LASIK flap thickness using the Zeiss femtosecond laser measured postoperatively by optical coherence tomography. J Refract Surg. 2010:1-5. [Online])
65 Yu ZQ, Xu Y, Yao PJ, et al. [Analysis of flap thickness by anterior segment optical coherence tomography in different flap preparation styles of excimer laser surgery]. Zhonghua Yan Ke Za Zhi. 2010;46(3):203-208.
66 Reinstein DZ, Rothman RC, Couch DG, et al. Artemis very high-frequency digital ultrasound-guided repositioning of a free cap after laser in situ keratomileusis. J Cataract Refract Surg. 2006;32(11):1877-1882.
67 Hovanesian JA, Maloney RK. Treating astigmatism after a free laser in situ keratomileusis cap by rotating the cap. J Cataract Refract Surg. 2005;31(10):1870-1876.
68 Kim DY, Reinstein DZ, Silverman RH, et al. Very high frequency ultrasound analysis of a new phakic posterior chamber intraocular lens in situ. Am J Ophthalmol. 1998;125(5):725-729.
69 Rondeau MJ, Barcsay G, Silverman RH, et al. Very high frequency ultrasound biometry of the anterior and posterior chamber diameter. J Refract Surg. 2004;20(5):454-464.
70 Lovisolo CF, Reinstein DZ. Phakic intraocular lenses. Surv Ophthalmol. 2005;50(6):549-587.
71 Werner L, Izak AM, Pandey SK, et al. Correlation between different measurements within the eye relative to phakic intraocular lens implantation. J Cataract Refract Surg. 2004;30(9):1982-1988.
72 Pinero DP, Puche AB, Alio JL. Ciliary sulcus diameter and two anterior chamber parameters measured by optical coherence tomography and VHF ultrasound. J Refract Surg. 2009;25(11):1017-1025.
73 Pinero DP, Plaza AB, Alio JL. Anterior segment biometry with 2 imaging technologies: very-high-frequency ultrasound scanning versus optical coherence tomography. J Cataract Refract Surg. 2008;34(1):95-102.
74 Reinstein DZ, Archer TJ, Silverman RH, et al. Accuracy, repeatability, and reproducibility of Artemis very high-frequency digital ultrasound arc-scan lateral dimension measurements. J Cataract Refract Surg. 2006;32(11):1799-1802.
75 Alio JL, de la Hoz F, Perez-Santonja JJ, et al. Phakic anterior chamber lenses for the correction of myopia: a 7-year cumulative analysis of complications in 263 cases. Ophthalmology. 1999;106(3):458-466.
76 Perez-Santonja JJ, Iradier MT, Benitez del Castillo JM, et al. Chronic subclinical inflammation in phakic eyes with intraocular lenses to correct myopia. J Cataract Refract Surg. 1996;22(2):183-187.
77 Javaloy J, Alio JL, Iradier MT, et al. Outcomes of ZB5M angle-supported anterior chamber phakic intraocular lenses at 12 years. J Refract Surg. 2007;23(2):147-158.
78 Goldsmith JA, Li Y, Chalita MR, et al. Anterior chamber width measurement by high-speed optical coherence tomography. Ophthalmology. 2005;112(2):238-244.
79 Reinstein DZ, Archer TJ, Silverman RH, et al. Correlation of anterior chamber angle and ciliary sulcus diameters with white-to-white corneal diameter in high myopes using Artemis VHF digital ultrasound. J Refract Surg. 2009;25(2):185-194.
80 Pinero DP, Plaza Puche AB, Alio JL. Corneal diameter measurements by corneal topography and angle-to-angle measurements by optical coherence tomography: evaluation of equivalence. J Cataract Refract Surg. 2008;34(1):126-131.
81 Wilczynski M, Bartela J, Synder A, et al. Comparison of internal anterior chamber diameter measured with ultrabiomicroscopy with white-to-white distance measured using digital photography in aphakic eyes. Eur J Ophthalmol. 2010;20(1):76-82.
82 Sanders DR, Vukich JA. Incidence of lens opacities and clinically significant cataracts with the implantable contact lens: comparison of two lens designs. J Refract Surg. 2002;18(6):673-682.
83 Sanders DR, Vukich JA, Doney K, et al. US Food and Drug Administration clinical trial of the implantable contact lens for moderate to high myopia. Ophthalmology. 2003;110(2):255-266.
84 Kodjikian L, Gain P, Donate D, et al. Malignant glaucoma induced by a phakic posterior chamber intraocular lens for myopia. J Cataract Refract Surg. 2002;28(12):2217-2221.
85 Reed JE, Thomas JV, Lytle RA, et al. Malignant glaucoma induced by an intraocular lens. Ophthalmic Surg. 1990;21(3):177-180.
86 Brandt JD, Mockovak ME, Chayet A. Pigmentary dispersion syndrome induced by a posterior chamber phakic refractive lens. Am J Ophthalmol. 2001;131(2):260-263.
87 Kohnen T, Kasper T, Terzi E. [Intraocular lenses for the correction of refraction errors. Part II. Phakic posterior chamber lenses and refractive lens exchange with posterior chamber lens implantation]. Ophthalmologe. 2005;102(11):1105-1117. quiz 1118–9
88 Mastropasqua L, Toto L, Nubile M, et al. Long-term complications of bilateral posterior chamber phakic intraocular lens implantation. J Cataract Refract Surg. 2004;30(4):901-904.
89 Brauweiler PH, Wehler T, Busin M. High incidence of cataract formation after implantation of a silicone posterior chamber lens in phakic, highly myopic eyes. Ophthalmology. 1999;106(9):1651-1655.
90 El-Sheikh HF, Tabbara KF. Cataract following posterior chamber phakic intraocular lens. J Refract Surg. 2003;19(1):72-73.
91 Sanchez-Galeana CA, Smith RJ, Sanders DR, et al. Lens opacities after posterior chamber phakic intraocular lens implantation. Ophthalmology. 2003;110(4):781-785.
92 Gimbel HV, Condon GP, Kohnen T, et al. Late in-the-bag intraocular lens dislocation: incidence, prevention, and management. J Cataract Refract Surg. 2005;31(11):2193-2204.
93 Kawamorita T, Uozato H, Kamiya K, et al. Relationship between ciliary sulcus diameter and anterior chamber diameter and corneal diameter. J Cataract Refract Surg. 2010;36(4):617-624.
94 Kim KH, Shin HH, Kim HM, et al. Correlation between ciliary sulcus diameter measured by 35 MHz ultrasound biomicroscopy and other ocular measurements. J Cataract Refract Surg. 2008;34(4):632-637.
95 Fea AM, Annetta F, Cirillo S, et al. Magnetic resonance imaging and Orbscan assessment of the anterior chamber. J Cataract Refract Surg. 2005;31(9):1713-1718.
96 Pop M, Payette Y, Mansour M. Predicting sulcus size using ocular measurements. J Cataract Refract Surg. 2001;27(7):1033-1038.
97 Oh J, Shin HH, Kim JH, et al. Direct measurement of the ciliary sulcus diameter by 35-megahertz ultrasound biomicroscopy. Ophthalmology. 2007;114(9):1685-1688.
98 Choi KH, Chung SE, Chung TY, et al. Ultrasound biomicroscopy for determining visian implantable contact lens length in phakic IOL implantation. J Refract Surg. 2007;23(4):362-367.
99 Reinstein DZ, Lovisolo C, Archer TJ, et al. Clinical evaluation of the effect of adding sulcus diameter to ICL sizing on the predictability of postop vault height. Chicago: AAO; 2010.
100 Lowery MD, Makker H, Lang A. Effect of the speed of sound in Sensar acrylic lenses on pseudophakic axial length measurements. J Cataract Refract Surg. 2002;28(7):1269-1270.
101 Shaffer RN. A new classification of the glaucomas. Trans Am Ophthalmol Soc. 1960;58:219-225.
102 Ursea R, Silverman RH. Anterior-segment imaging for assessment of glaucoma. Exp Rev Ophthalmol. 2010;5(1):59-74.
103 Pavlin CJ, Harasiewicz K, Sherar MD, et al. Clinical use of ultrasound biomicroscopy. Ophthalmology. 1991;98(3):287-295.
104 Pavlin CJ, Harasiewicz K, Foster FS. Ultrasound biomicroscopy of anterior segment structures in normal and glaucomatous eyes [see comments]. Am J Ophthalmol. 1992;113(4):381-389.
105 Pavlin CJ, Foster FS. Ultrasound biomicroscopy in glaucoma. Acta Ophthalmol Suppl. 1992;204:7-9.
106 Pavlin CJ, Ritch R, Foster FS. Ultrasound biomicroscopy in plateau iris syndrome. Am J Ophthalmol. 1992;113(4):390-395.
107 Aslanides IM, Libre PE, Silverman RH, et al. High frequency ultrasound imaging in pupillary block glaucoma. Br J Ophthalmol. 1995;79(11):972-976.
108 Mandell MA, Pavlin CJ, Weisbrod DJ, et al. Anterior chamber depth in plateau iris syndrome and pupillary block as measured by ultrasound biomicroscopy. Am J Ophthalmol. 2003;136(5):900-903.
109 Tello C, Liebmann J, Potash SD, et al. Measurement of ultrasound biomicroscopy images: intraobserver and interobserver reliability. Invest Ophthalmol Vis Sci. 1994;35(9):3549-3552.
110 Ishikawa H, Liebmann JM, Ritch R. Quantitative assessment of the anterior segment using ultrasound biomicroscopy. Curr Opin Ophthalmol. 2000;11(2):133-139.
111 Radhakrishnan S, Goldsmith J, Huang D, et al. Comparison of optical coherence tomography and ultrasound biomicroscopy for detection of narrow anterior chamber angles. Arch Ophthalmol. 2005;123(8):1053-1059.
112 Kumar RS, Baskaran M, Chew PT, et al. Prevalence of plateau iris in primary angle closure suspects an ultrasound biomicroscopy study. Ophthalmology. 2008;115(3):430-434.
113 Tanihara H, Akita J, Honjo M, et al. Angle closure caused by multiple, bilateral iridociliary cysts. Acta Ophthalmol Scand. 1997;75(2):216-217.
114 Kuchenbecker J, Motschmann M, Schmitz K, et al. Laser iridocystotomy for bilateral acute angle-closure glaucoma secondary to iris cysts. Am J Ophthalmol. 2000;129(3):391-393.
115 McWhae JA, Rinke M, Crichton AC, et al. Multiple bilateral iridociliary cysts: ultrasound biomicroscopy and clinical characteristics. Can J Ophthalmol. 2007;42(2):268-271.
116 Katsimpris JM, Petropoulos IK, Sunaric-Megevand G. Ultrasound biomicroscopy evaluation of angle closure in a patient with multiple and bilateral iridociliary cysts. Klin Monbl Augenheilkd. 2007;224(4):324-327.
117 Trope GE, Pavlin CJ, Bau A, et al. Malignant glaucoma. Clinical and ultrasound biomicroscopic features. Ophthalmology. 1994;101(6):1030-1035.
118 Sathish S, MacKinnon JR, Atta HR. Role of ultrasound biomicroscopy in managing pseudophakic pupillary block glaucoma. J Cataract Refract Surg. 2000;26(12):1836-1838.
119 Coleman DJ. Evaluation of ciliary body detachment in hypotony. Retina. 1995;15(4):312-318.
120 Roters S, Engels BF, Szurman P, et al. Typical ultrasound biomicroscopic findings seen in ocular hypotony. Ophthalmologica. 2002;216(2):90-95.
121 Roters S, Szurman P, Engels BF, et al. Ultrasound biomicroscopy in chronic ocular hypotony: its impact on diagnosis and management. Retina. 2002;22(5):581-588.
122 Mateo-Montoya A, Dreifuss S. Anterior segment optical coherence tomography as a diagnostic tool for cyclodialysis clefts. Arch Ophthalmol. 2009;127(1):109-110.
123 Gentile RC, Pavlin CJ, Liebmann JM, et al. Diagnosis of traumatic cyclodialysis by ultrasound biomicroscopy. Ophthalmic Surg Lasers. 1996;27(2):97-105.
124 Hwang JM, Ahn K, Kim C, et al. Ultrasonic biomicroscopic evaluation of cyclodialysis before and after direct cyclopexy. Arch Ophthalmol. 2008;126(9):1222-1225.