6 Ventricular Function
Overview
Left Ventricular Systolic Function
Background
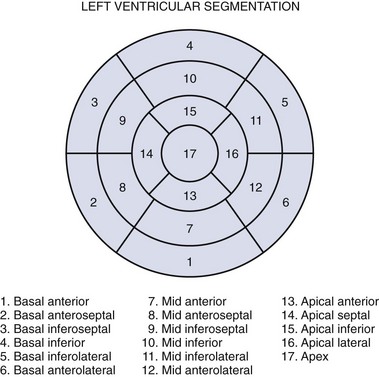
Coronary Anatomy and Left Ventricular Wall Segmentation
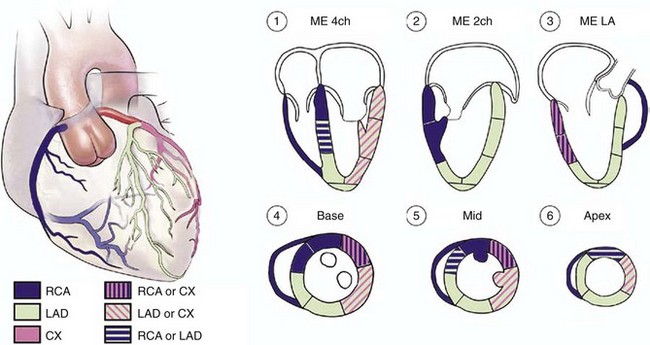
Figure 6-1 Typical distributions of the RCA, the LAD, and the LCX coronary arteries.
Modified with permission from Lang RM, Bierig M, Devereux RB, et al; Chamber Quantification Writing Group; American Society of Echocardiography’s Guidelines and Standards Committee; European Association of Echocardiography. Recommendations for chamber quantification: A report from the American Society of Echocardiography’s Guidelines and Standards Committee and the Chamber Quantification Writing Group, developed in conjunction with the European Association of Echocardiography, a branch of the European Society of Cardiology. J Am Soc Echocardiogr. 2005;18:1440-1463.
Left Ventricular Anatomy: Wall Thickness and Size
Left Ventricular Ejection Fraction
Pathophysiology
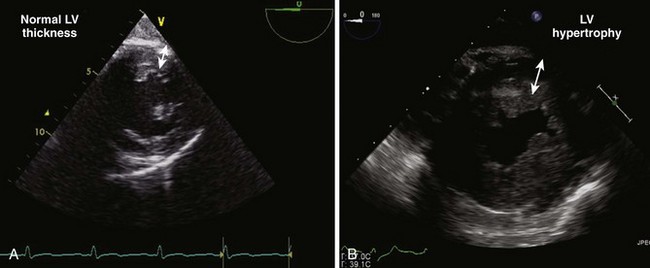
Left Ventricular Hypertrophy
Cardiomyopathies
Overview of Echocardiographic Approach
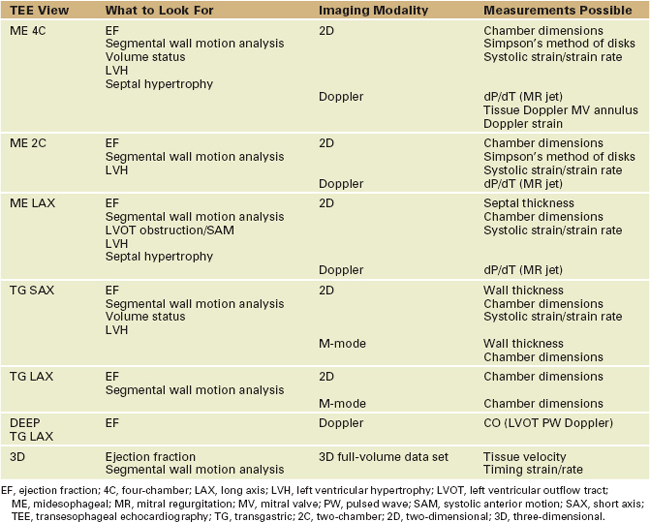
Table 6-1 presents an evaluation of LV systolic function.
Anatomic Imaging
Acquisition
Analysis
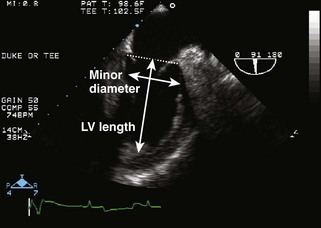
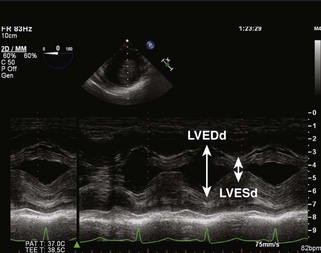
Ejection Fraction Linear Measurement
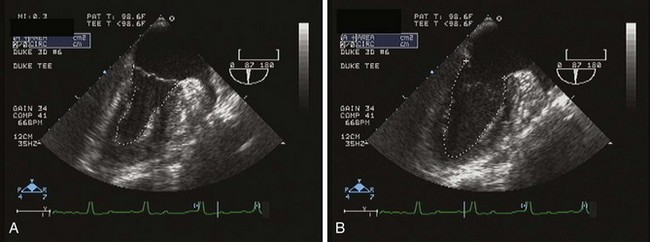
Ejection Fraction Area Measurement
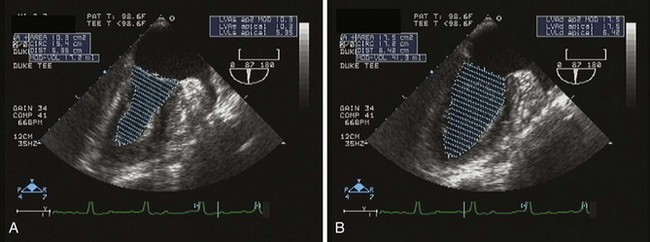
Ejection Fraction Volumetric Measurements
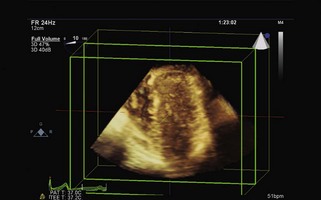
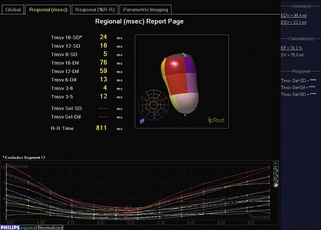
Ejection Fraction Three-Dimensional Measurement
Key Points Pitfalls
Physiologic Data
Acquisition
Analysis
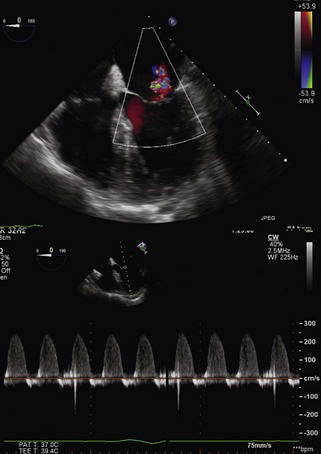
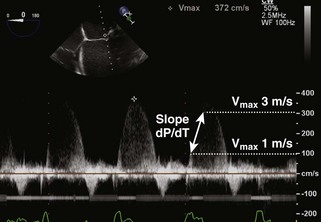
Rate of Rise in Left Ventricle Pressure (dP/dT)
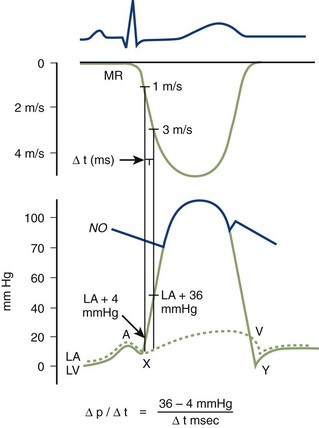
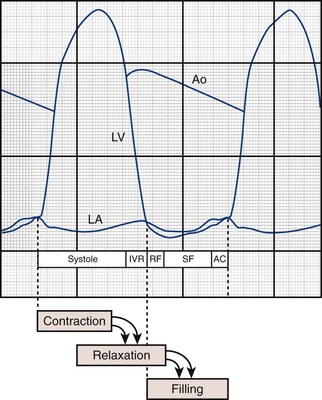
Figure 6-23 Pressure tracing diagram.
From Pai RG, Bansal RC, Shah PM. Doppler-derived rate of left ventricular pressure rise. Its correlation with the postoperative left ventricular function in mitral regurgitation. Circulation. 1990;82:514-520.

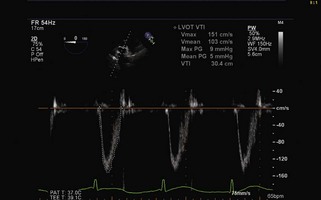
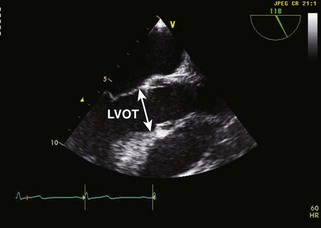
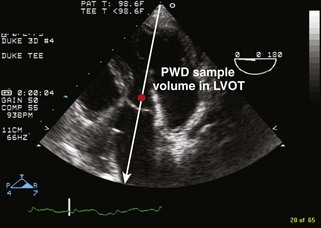
Cardiac Output

Tissue Doppler Imaging of the Mitral Annulus
Strain/Strain Rate and Speckle Tracking
Key Points Pitfalls
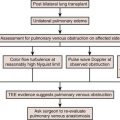
Alternate Approaches—When Transesophageal Echocardiography Is Insufficient
Key Points
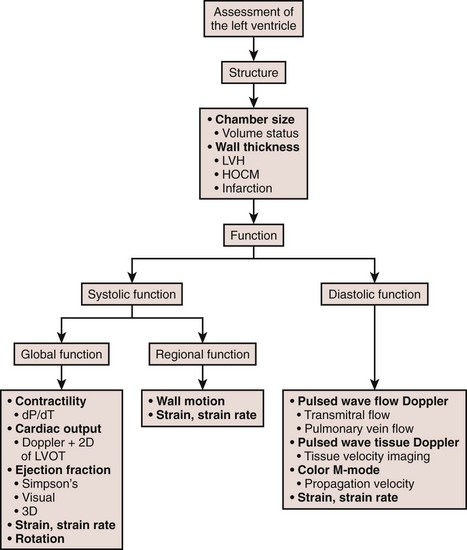
Figure 6-27 presents an LV assessment flow chart.
Right Ventricular Systolic Function
Background
Coronary Anatomy and Right Ventricular Wall Motion
Right Ventricular Anatomy
Pathophysiology
Wall Motion
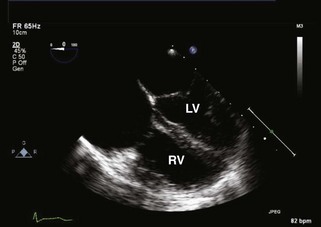
Right Ventricular Dilatation
Right Ventricular Hypertrophy
Interventricular Septum
Overview of Echocardiographic Approach
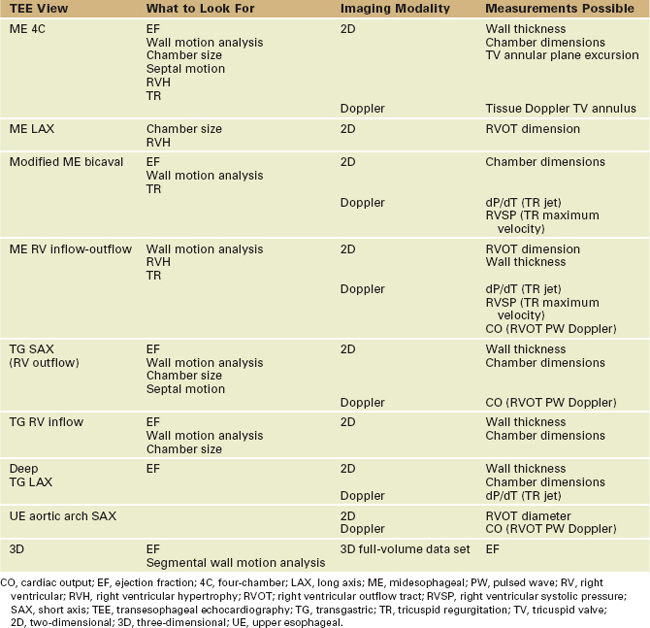
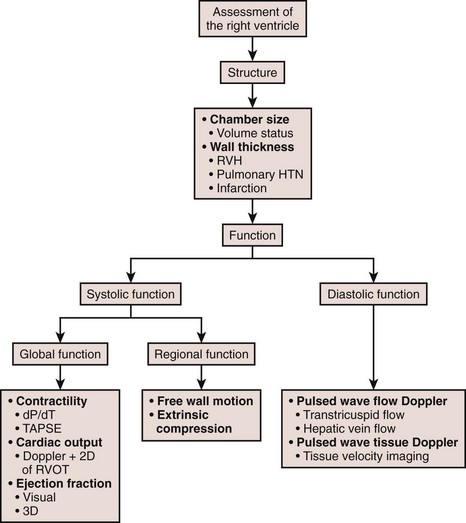
Table 6-2 presents an evaluation of RV systolic function.
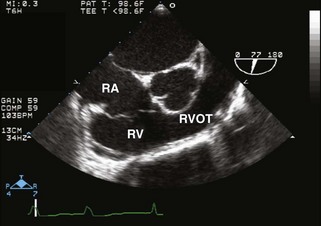
Anatomic Imaging
Analysis
Chamber Dimensions
Ejection Fraction
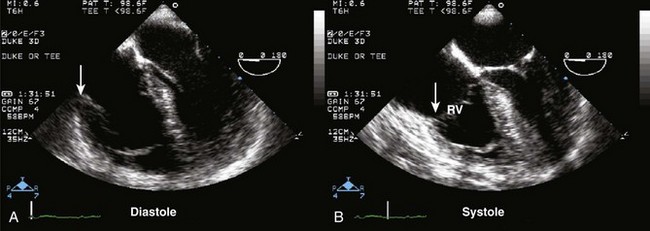
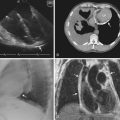
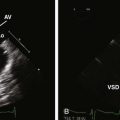
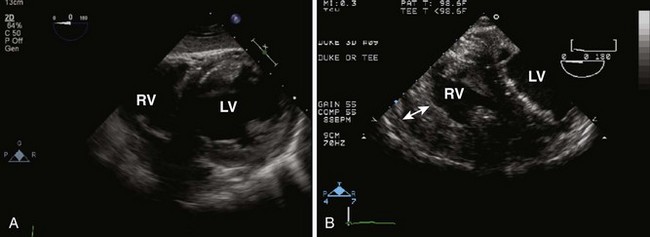
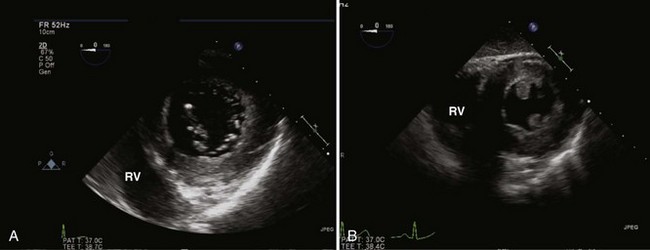
Figure 6-43 ME 4C view of the RV with the tricuspid annulus (arrow) indicated in diastole (A) and systole (B).
Key Points Pitfalls
Physiologic Data
Acquisition
Analysis


Key Points Pitfalls
Alternate Approaches
Key Points
Figure 6-50 is a flow chart for the RV.
Left Ventricular Diastolic Function
Background
Physiology of Diastole
LA, left atrial; LV, left ventricular; RV, right ventricular.
* Other determinants of diastolic function are heart rate, mitral valve area, LA function.
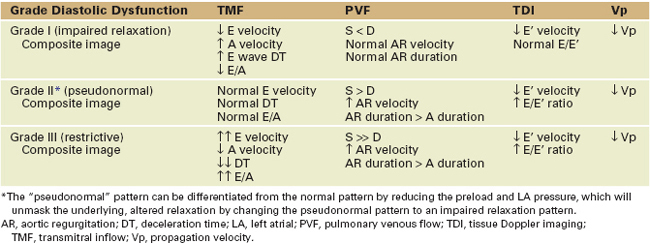
Pathophysiology
The pathophysiology of diastolic dysfunction is primarily described in terms of LV filling patterns (Table 6-4).
| Grade of Diastolic Dysfunction | Underlying Mechanism | Pathophysiology |
|---|---|---|
| Grade I (impaired relaxation) | Impaired LV relaxation |
Elevated LA pressure
Decreased LV compliance
Highly elevated LV filling pressures
LA, left atrial; LV, left ventricular.
Overview of Echocardiographic Approach (Table 6-5)
Anatomic Imaging
| Echocardiographic Method | Measurements | Comments |
|---|---|---|
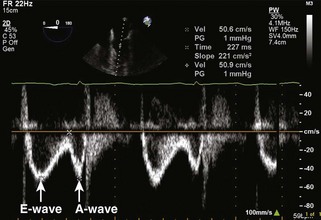
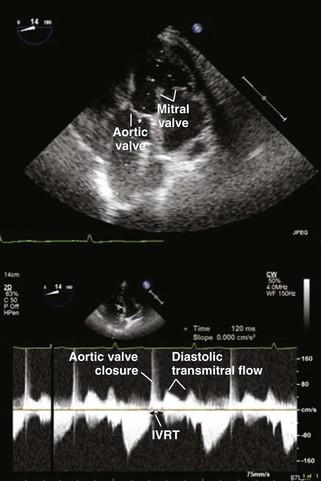
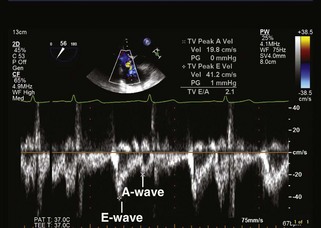
| Transmitral flow (TMF) (Figure 6-52) |
IVRT | Depends on LV relaxation, LA pressure |
| Early filling peak velocity (E wave) | Reflects LV-LA pressure gradient in early diastole | |
| Depends on LV relaxation, LV compliance | ||
| E wave DT | Depends on LV compliance | |
| Late filling deceleration time (A-wave) | Depends on LV compliance, LA function | |
| A-wave duration | Useful in assessment of filling pressures | |
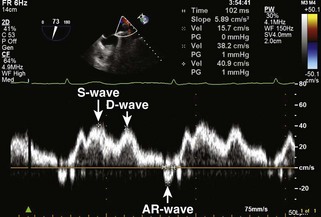
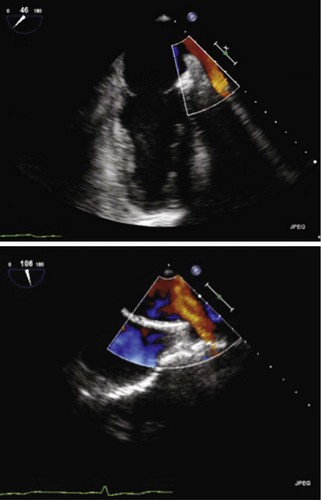
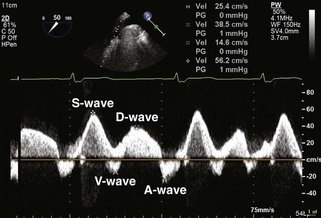
| Pulmonary vein flow (PVF) (Figure 6-53) |
Peak systolic flow velocity (S-wave) | May have two components S1 and S2 |
| Depends on LA relaxation, pulmonary vein flow | ||
| Peak diastolic flow velocity (D-wave) | Depends on LV relaxation, LV compliance | |
| Peak atrial reversal flow velocity (AR wave) | Depends on LA function, LA compliance, LV compliance | |
| AR wave duration (ARdur) | Useful in assessing filling pressures | |
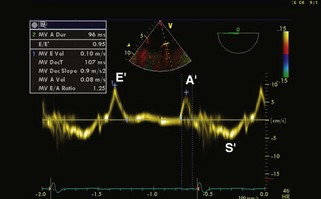
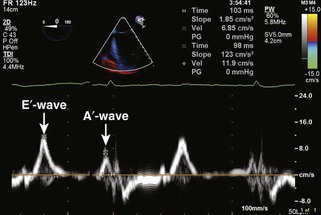
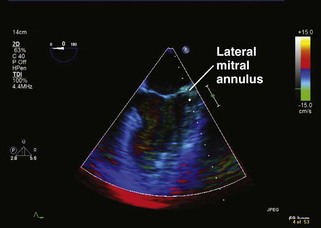
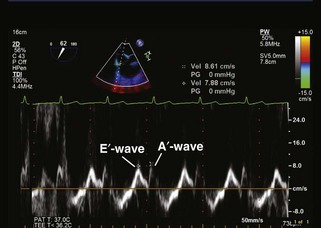
| Tissue Doppler imaging (TDI) (Figure 6-54) |
Early diastolic velocity (E’ wave) | Corresponds to the E-wave of TMF |
| Measures myocardial velocities at lateral or septal mitral annulus | ||
| Late diastolic velocity (A’ wave) | Corresponds to the A-wave of the TMF | |
| Systolic velocity (S’ wave) | Due to mitral annulus descent during LV systole | |
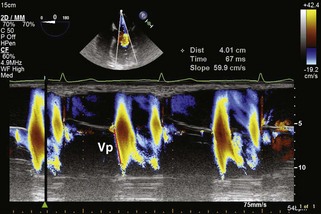
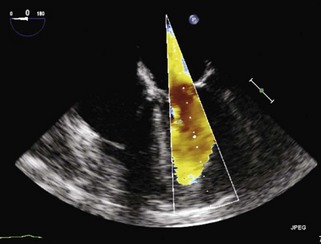
| Propagation velocity (Vp) (Figure 6-55) |
Vp | Measures velocities along a scan line from the mitral annulus to LV apex |
| Correlates well with LV relaxation |
DT, deceleration time; IVRT, isovolumic relaxation time; LA, left atrial; LV, left ventricular.
Physiologic Data
Acquisition
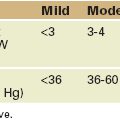
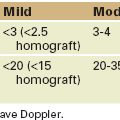
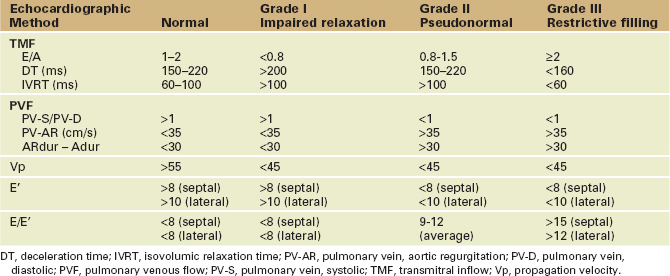
Analysis (Tables 6-6 and 6-7)
Pitfalls
Alternative Approaches
Key Points
Right Ventricular Diastolic Function
Background
Overview of Echocardiographic Approach (Table 6-8)
Anatomic Imaging
TABLE 6-8 EVALUATION OF RIGHT VENTRICULAR DIASTOLIC FUNCTION
| Echocardiographic Method | Measurements | Comments |
|---|---|---|
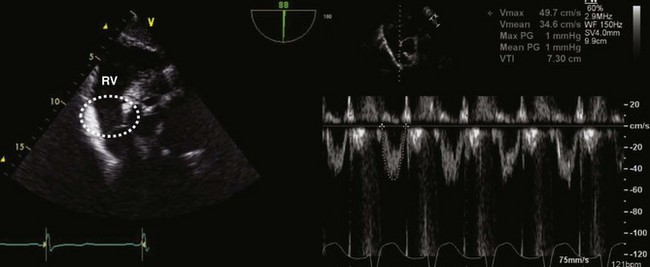
| TTF (Figure 6-61) |
Early filling peak velocity (E-wave) | Flow velocities may vary during spontaneous respiration by 20%. They increase during inspiration and decrease during expiration. Positive-pressure ventilation may have the opposite effect in comparison with spontaneous ventilation |
| E-wave DT | ||
| Late filling peak velocity (A-wave) | ||
| A-wave duration | ||
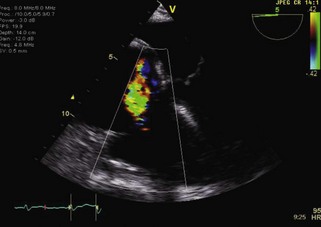
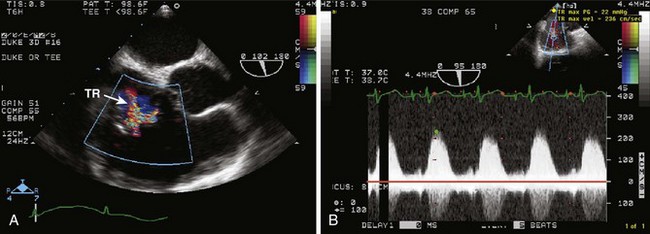
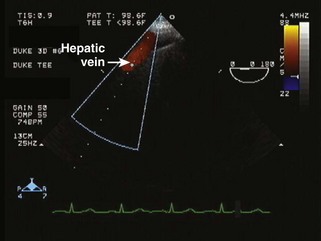
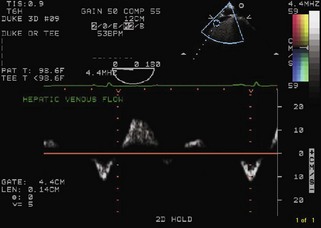
| HVF (Figure 6-62) |
Antegrade systolic flow (S-wave) | Influenced by TV annular motion, RA relaxation, and TR |
| Retrograde end-systolic flow (V-wave) | Influenced by RV and RA compliance | |
| Antegrade diastolic flow (D-wave) | Occurs after TV opening | |
| Retrograde end-diastolic flow (A-wave) | Occurs during atrial contraction | |
| Influenced by RV and RA compliance | ||
| Myocardial velocities TDI (Figure 6-63) |
Early diastolic velocity (E’ wave) | E/E’ correlates with RV filling pressures |
| E/E’ ratio |
DT, deceleration time; HVF, hepatic venous flow; RA, right atrial; RV, right ventricular; TDI, tissue Doppler imaging; TR, tricuspid regurgitation; TTF, transtricuspid flow; TV, tricuspid valve.
Physiologic Data
Acquisition
Analysis
Pitfalls
1 Lang RM, Bierig M, Devereux RB, et alChamber Quantification Writing GroupAmerican Society of Echocardiography’s Guidelines and Standards CommitteeEuropean Association of Echocardiography. Recommendations for chamber quantification: A report from the American Society of Echocardiography’s Guidelines and Standards Committee and the Chamber Quantification Writing Group, developed in conjunction with the European Association of Echocardiography, a branch of the European Society of Cardiology. J Am Soc Echocardiogr. 2005;18:1440-1463.
2 Nagueh SF, Appleton CP, Gillebert TC, et al. Recommendations for the evaluation of left ventricular diastolic function by echocardiography [review]. J Am Soc Echocardiogr. 2009;22:107-133.
3 Rudski LG, Wyman WL, Afilalo J, et al. Guidelines for echocardiographic assessment of the right heart in adults: a report from the American Society of Echocardiography. J Am Soc Echocardiogr. 2010;23:685-713.
4 Shanewise JS, Cheung AT, Aronson S, et al. ASE/SCA guidelines for performing a comprehensive intraoperative multiplane transesophageal echocardiography examination: Recommendations of the American Society of Echocardiography Council for Intraoperative Echocardiography and the Society of Cardiovascular Anesthesiologists Task Force for Certification in Perioperative Transesophageal Echocardiography. Anesth Analg. 1999;89:870-884.