Chapter 7 Ventricular Conduction Disturbances Bundle Branch Blocks and Related Abnormalities
Please go to expertconsult.com for supplemental chapter material.
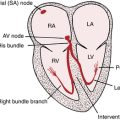
Recall that in the normal process of ventricular activation the electrical stimulus reaches the ventricles from the atria by way of the atrioventricular (AV) node and His-Purkinje system (see Chapters 1 and 4). The first part of the ventricles to be stimulated (depolarized) is the left side of the ventricular septum. Soon after, the depolarization spreads to the main mass of the left and right ventricles by way of the left and right bundle branches. Normally the entire process of ventricular depolarization in adults is completed within about 0.1 sec (100 msec). This is the reason the normal width of the QRS complex (measured by computer) from all 12 leads is less than or equal to 110 msec (about 2.5 small boxes on the ECG graph paper by eye). Any process that interferes with the physiologic, near simultaneous stimulation of the ventricles may prolong the QRS width or change the QRS axis. This chapter primarily focuses on a major topic: the effects that blocks or delays within the bundle branch system have on the QRS complex and ST-T waves.
ECG in Ventricular Conduction Disturbances: General Principles
A unifying principle in predicting what the ECG will show with a bundle branch or fascicular block is the following: The last (and usually dominant) component of the QRS vector will be shifted in the direction of the last part of the ventricles to be depolarized. In other words, the major QRS vector shifts toward the regions of the heart that are most delayed in being stimulated (Box 7-1).
BOX 7-1 QRS Vector Shifts in Bundle Branch and Fascicular Blocks
• Right bundle branch block (RBBB): late QRS forces point toward the right ventricle (positive in V1 and negative in V6).
• Left bundle branch block (LBBB): late QRS forces point toward the left ventricle (negative in V1 and positive in V6).
• Left anterior fascicular block (LAFB): late QRS forces point in a leftward and superior direction (negative in II and positive in I and aVL).
• Left posterior fascicular block (LPFB): late QRS forces point in an inferior and rightward direction (negative in I and positive in II and III).
Right Bundle Branch Block
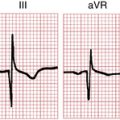
Normally the first part of the ventricles to be depolarized is the interventricular septum (see Fig. 4-6A). The left side of the septum is stimulated first (by a branch of the left bundle). On the normal ECG, this septal depolarization produces a small septal r wave in lead V1 and a small septal q wave in lead V6 (Fig. 7-1A). Clearly, RBBB should not affect the septal phase of ventricular stimulation because the septum is stimulated by a part of the left bundle.
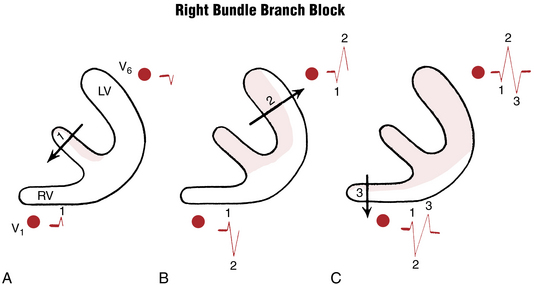
Figure 7-1 Step-by-step sequence of ventricular depolarization in right bundle branch block (see text).
The second phase of ventricular stimulation is the simultaneous depolarization of the left and right ventricles (see Fig. 4-6B). RBBB should not affect this phase either, because the left ventricle is normally electrically predominant, producing deep S waves in the right chest leads and tall R waves in the left chest leads (Fig. 7-1B). The change in the QRS complex produced by RBBB is a result of the delay in the total time needed for stimulation of the right ventricle. This means that after the left ventricle has completely depolarized, the right ventricle continues to depolarize.
This delayed right ventricular depolarization produces a third phase of ventricular stimulation. The electrical voltages in the third phase are directed to the right, reflecting the delayed depolarization and slow spread of the depolarization wave outward through the right ventricle. Therefore, a lead placed over the right side of the chest (e.g., lead V1) records this phase of ventricular stimulation as a positive wide deflection (R′ wave). The rightward spread of the delayed and slow right ventricular depolarization voltages produces a wide negative (S wave) deflection in the left chest leads (e.g., lead V6) (Fig. 7-1C).
To make the initial diagnosis of RBBB, look at leads V1 and V6 in particular. The characteristic appearance of QRS complexes in these leads makes the diagnosis simple. (Fig. 7-1 shows how the delay in ventricular depolarization with RBBB produces the characteristic ECG patterns.)
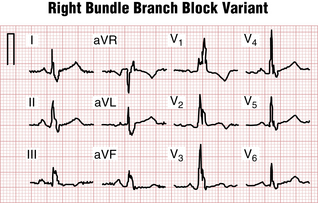
With an RBBB pattern the QRS complex in lead V1 generally shows an rSR′ pattern (Fig. 7-2). Occasionally, however, the S wave never quite makes its way below the baseline. Consequently, the complex in lead V1 has the appearance of a large notched R wave (Fig. 7-3).
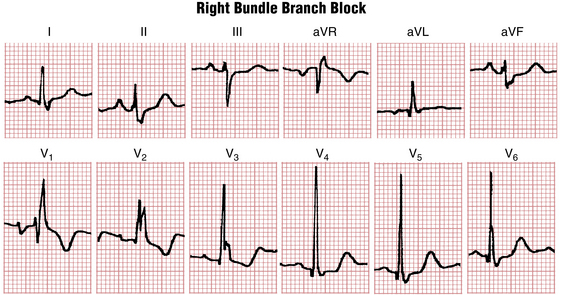
Figures 7-2 and 7-3 are typical examples of RBBB. Do you notice anything abnormal about the ST-T complexes in these tracings? If you look carefully, you can see that the T waves in the right chest leads are inverted. T wave inversions in the right chest leads are a characteristic finding with RBBB. These inversions are referred to as secondary changes because they reflect just the delay in ventricular stimulation. By contrast, primary T wave abnormalities reflect an actual change in repolarization, independent of any QRS change. Examples of primary T wave abnormalities include T wave inversions resulting from ischemia (see Chapters 8 and 9), hypokalemia and certain other electrolyte abnormalities (see Chapter 10), and drugs such as digitalis (see Chapter 10).
Some ECGs show both primary and secondary ST-T changes. In Figure 7-3 the T wave inversions in leads V1 to V3 and leads II, III, and aVF can be explained solely on the basis of the RBBB because the inversions occur in leads with an rSR′-type complex. However, the T wave inversions or ST segment depressions in other leads (V4 and V5) represent a primary change, perhaps resulting from ischemia or a drug effect.
Clinical Significance
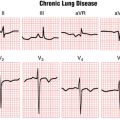
RBBB may be caused by a number of factors. First, some people have this finding without any identifiable underlying heart disorder. Therefore RBBB, itself, is an isolated ECG abnormality in many people; however, RBBB may be associated with organic heart disease. It may occur with virtually any condition that affects the right side of the heart, including atrial septal defect with left-to-right shunting of blood, chronic pulmonary disease with pulmonary artery hypertension, and valvular lesions such as pulmonary stenosis, as well as cardiomyopathies and coronary disease. In some people (particularly older individuals), RBBB is related to chronic degenerative changes in the conduction system. It may occur after cardiac surgery.
By itself, RBBB does not require any specific treatment. RBBB may be permanent or transient. Sometimes it appears only when the heart rate exceeds a certain critical value (rate-related RBBB), a nondiagnostic finding. However, as noted later in patients with acute anterior wall infarction, a new RBBB may indicate an increased risk of complete heart block, particularly when the RBBB is associated with left anterior or posterior fascicular block and a prolonged PR interval. A new RBBB with acute ST segment elevation anterior myocardial infarction (MI) is also a marker of more extensive myocardial damage, often associated with heart failure or even cardiogenic shock (see Chapter 8, Fig. 8-20).
A pattern resembling RBBB (“pseudo-RBBB”) is characteristic of the Brugada pattern, important because it may be associated with increased risk of ventricular tachyarrhythmias (see Chapter 19; Fig. 19-9).
Left Bundle Branch Block
Recall that, normally, the first phase of ventricular stimulation—depolarization of the left side of the septum—is started by a branch of the left bundle. LBBB therefore blocks this normal pattern. When LBBB is present, the septum depolarizes from right to left and not from left to right. Thus, the first major ECG change produced by LBBB is a loss of the normal septal r wave in lead V1 and the normal septal q wave in lead V6 (Fig. 7-4A). Furthermore, the total time for left ventricular depolarization is prolonged with LBBB. As a result, the QRS complex is abnormally wide. Lead V6 shows a wide, entirely positive (R) wave (Fig. 7-4B). The right chest leads (e.g., V1) record a negative QRS (QS) complex because the left ventricle is still electrically predominant with LBBB and therefore produces greater voltages than the right ventricle.
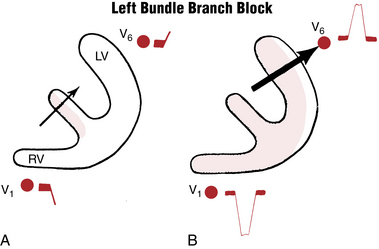
Thus, with LBBB the entire process of ventricular stimulation is oriented toward the left chest leads; that is, the septum depolarizes from right to left, and stimulation of the electrically predominant left ventricle is prolonged. Figure 7-4 illustrates the sequence of ventricular activation in LBBB.∗
With LBBB, the QS wave in lead V1 sometimes shows a small notching at its point, giving the wave a characteristic W shape. Similarly, the broad R wave in lead V6 may show a notching at its peak, giving it a distinctive M shape. (An example of an LBBB pattern is presented in Fig. 7-5.)
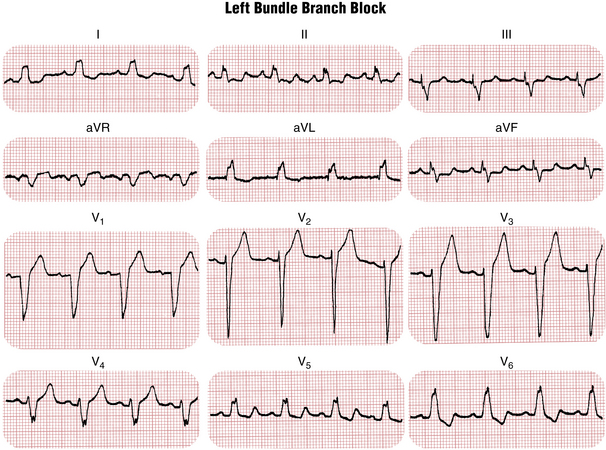
Just as secondary T wave inversions occur with RBBB, they also occur with LBBB. As Figure 7-5 shows, the T waves in the leads with tall R waves (e.g., the left precordial leads) are inverted; this is characteristic of LBBB. However, T wave inversions in the right precordial leads cannot be explained solely on the basis of LBBB. If present, these T wave inversions reflect some primary abnormality such as ischemia (see Fig. 8-21).
You should have no problem differentiating LBBB and RBBB patterns (Fig. 7-6). Occasionally an ECG shows wide QRS complexes that are not typical of an RBBB or LBBB pattern. In such cases the general term intraventricular delay is used (Fig. 7-7).
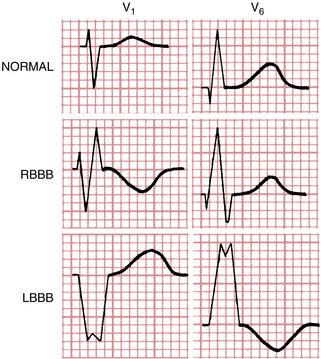
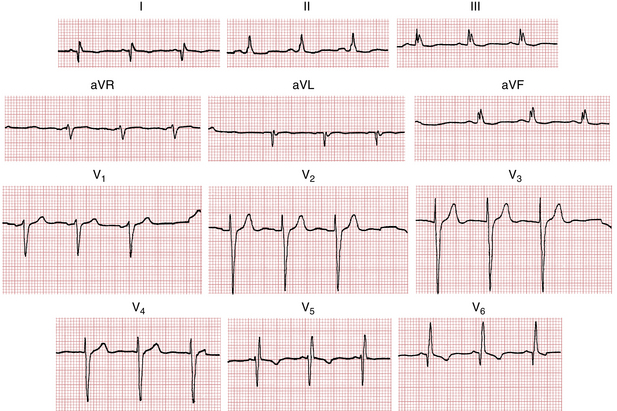
Figure 7-7 With a nonspecific intraventricular conduction delay (ICVD), the QRS complex is abnormally wide (0.12 sec). However, such a pattern is not typical of left or right bundle branch block. In this patient the pattern was caused by an anterolateral wall Q wave myocardial infarction (see Chapter 8).
Clinical Significance
Unlike RBBB, which is occasionally seen without evident cardiac disease, LBBB is usually a sign of organic heart disease. LBBB may develop in patients with long-standing hypertensive heart disease, a valvular lesion (e.g., calcification of the mitral annulus, aortic stenosis, or aortic regurgitation), or different types of cardiomyopathy (see Chapter 11). It is also seen in patients with coronary artery disease and often correlates with impaired left ventricular function. Most patients with LBBB have underlying left ventricular hypertrophy (LVH) (see Chapter 6). Degenerative changes in the conduction system may lead to LBBB, particularly in the elderly, as may cardiac surgery. Often, more than one contributing factor may be identified (e.g., hypertension and coronary artery disease). Rarely, otherwise normal individuals have an LBBB pattern without evidence of organic heart disease by examination or even invasive studies. Echocardiograms usually show septal dyssynchrony due to abnormal ventricular activation patterns; other findings (e.g., valvular abnormalities, LVH, and diffuse wall motion disorders due to cardiomyopathy) are not unusual.
Key Point
LBBB may be the first clue to four previously undiagnosed but clinically important abnormalities:


Finally, LBBB may not only be a marker of major underlying cardiac disease, but the loss of ventricular synchrony (dyssynchrony syndrome) induced by this conduction abnormality may, itself, worsen cardiac function, especially in those with advanced heart disease. The use of biventricular pacemaker therapy to resynchronize ventricular contraction in patients with LBBB and heart failure is described in Chapter 21.
Differential Diagnosis of Bundle Branch Blocks
Wide QRS resembling bundle branch blocks can be seen in several other situations:
1. Pacemaker rhythms: Right ventricular pacing functionally is similar to LBBB because the ventricles are activated from the electrode positioned in the right ventricular apex (close to the RBB where ventricular activation in the LBBB starts; see Figs. 21-3 and 21-5. Biventricular pacing sometimes resembles RBBB because of the left ventricular lead activating the heart from back to front (toward lead V1) producing RV1 similar to RBBB.
2. LVH: Dilatation and especially thickening of the LV wall delays its activation and prolongs QRS duration even without associated conduction abnormalities. QRS pattern in LVH can be very similar to LBBB, including increased QRS voltage and secondary T wave discordance. However, in contrast to LVH, LBBB is characterized by prolonged intrinsicoid deflection (time from the QRS onset to the peak of the R wave in leads V5-V6) to over 60 msec (1.5 small boxes). Often, LVH pattern progresses to incomplete and then to complete LBBB.
3. Ventricular preexcitation (Wolff-Parkinson-White [WPW] syndrome) can create ECG patterns similar to bundle branch blocks. Based on the principles outlined previously, left ventricular preexcitation (formerly called WPW type A) produces a positive R wave in lead V1 (RV is activated last), whereas right ventricular preexcitation (formerly WPW type B) creates deep S waves in lead V1 similar to that seen in LBBB because the right ventricle is activated first. The clue to the presence of preexcitation is a short PR interval and a very slow inscription of the initial part of the QRS (delta wave).
4. Ventricular arrhythmias (especially at slower rates) can look very similar to bundle branch blocks. More on the differential diagnosis of wide QRS rhythms is presented in Chapter 20.
Fascicular Blocks (Hemiblocks)
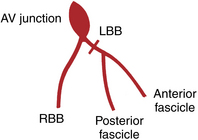
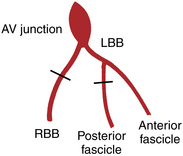
Fascicular blocks, or hemiblocks, are a slightly more complex but important topic. To this point the left bundle branch system has been described as if it were a single pathway. Actually this system has been known for many years to be subdivided into an anterior fascicle and a posterior fascicle (“fascicle” is derived from the Latin fasciculus, meaning “small bundle”). The right bundle branch, by contrast, is a single pathway and consists of just one main fascicle or bundle. This revised concept of the bundle branch system as a trifascicular highway (one right lane and two left lanes) is illustrated in Figure 7-8. More realistically, the trifascicular concept is also an oversimplification: the fascicles themselves are more like a ramifying fan than single pathways.
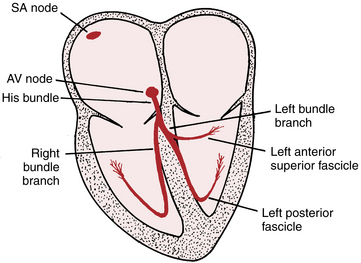
Figure 7-8 Trifascicular conduction system. Notice that the left bundle branch subdivides into left anterior fascicle and left posterior fascicle. This highly schematized diagram is a revision of the original drawing of the conduction system (see Fig. 1-1). In actuality, the fascicles are complex, tree-like branching structures. AV, atrioventricular; SA, sinoatrial.
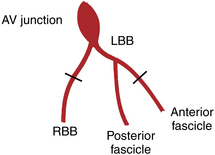
It makes sense to predict that a block can occur at any single point or at multiple points in this trifascicular system. The ECG pattern with RBBB has already been presented (see Figs. 7-2 and 7-3). The pattern of LBBB can occur in one of two ways: by a block in the left main bundle before it divides or by blocks in both subdivisions (anterior and posterior fascicles).
What happens if a block occurs in just the anterior or just the posterior fascicle of the left bundle? A block in either fascicle of the left bundle branch system is called a hemiblock or fascicular block. Recognition of hemiblocks on the ECG is intimately related to the subject of axis deviation (see Chapter 5). Somewhat surprisingly, a hemiblock (unlike a full LBBB or RBBB) does not widen the QRS complex markedly. Experiments and clinical observations have shown that the main effect of cutting these fascicles is a change in the QRS axis, with only minor increases in QRS duration. Specifically, left anterior fascicular block (LAFB) results in marked left axis deviation (about –45° or more negative); left posterior fascicular block (LPFB) produces marked right axis deviation (RAD) (about +120° or more positive).∗
In summary, fascicular blocks are partial blocks in the left bundle branch system, involving either the anterior or posterior subdivisions. The diagnosis of a fascicular block is made primarily from the mean QRS axis in the extremity (frontal plane) leads. This is in contrast to the diagnosis of complete (or incomplete) RBBB or LBBB, which is made primarily from the distinctive wide QRS patterns in the chest (horizontal plane) leads.
Left Anterior Fascicular Block
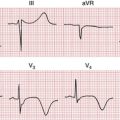
Isolated (pure) LAFB is diagnosed by finding a mean QRS axis of −45° or more and a QRS width of less than 0.12 sec. As rough but useful rule of thumb: A mean QRS axis of −45° or more can be easily recognized because the depth of the S wave in lead III is 1.4 or more times the height of the R wave in lead I or the depth of the S in aVF is equal to or greater than the height of the R wave in lead I (Fig. 7-9). Lead aVL usually shows a qR complex, with rS complexes in leads II, III, and aVF (or QS waves if an inferior MI is also present).
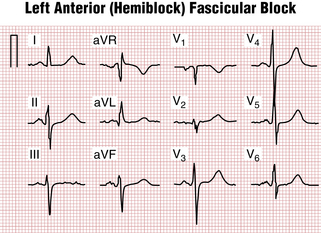
Figure 7-9 Left anterior (hemiblock) fascicular block. Notice the marked left axis deviation without significant widening of the QRS duration. (Left atrial abnormality is also present.) Compare this most common type of fascicular block with left posterior fascicular block (Fig. 9-8B), which produces marked right axis deviation.
In general, the finding of isolated LAFB is a very common, nonspecific abnormality. This finding may be seen with hypertension, aortic valve disease, coronary disease, and aging and sometimes without identifiable cause (Fig. 7-10).
Left Posterior Fascicular Block
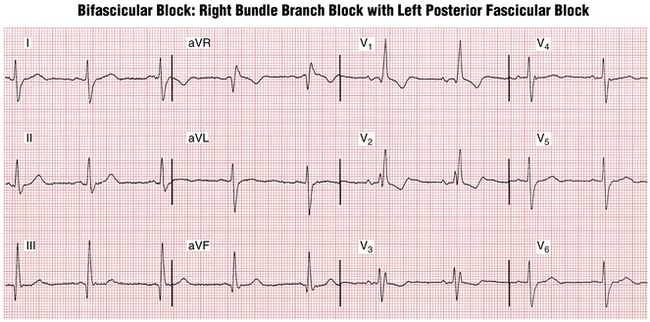
Isolated LPFB is diagnosed by finding a mean QRS axis of +120° or more positive, with a QRS width of less than 0.12 sec. Usually an rS complex is seen in lead I, and a qR complex is seen in leads II, III, and aVF. However, the diagnosis of LPFB can be considered only after other, more common causes of RAD have been excluded (see Chapter 24). These factors include right ventricular hypertrophy (RVH), normal variant, emphysema, lateral wall infarction (see Fig. 8-11), and acute pulmonary embolism (or other causes of acute right ventricular overload).
Although LAFB is relatively common, isolated LPFB is very rare. Most often it occurs with RBBB, as shown in Figure 7-11.
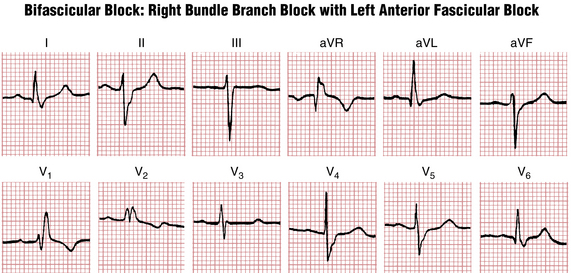
Bifascicular and Trifascicular Blocks
Bifascicular block indicates blockage of any two of the three fascicles. For example, RBBB with LAFB produces an RBBB pattern with marked LAD (see Fig. 7-10); RBBB with LPFB (Fig. 7-10) produces an RBBB pattern with RAD (provided other causes of RAD, especially RVH and lateral MI, are excluded). Similarly, a complete LBBB may indicate blockage of both the anterior and posterior fascicles.
The acute development of new bifascicular block, usually RBBB and LAFB (especially with a prolonged PR interval) during an acute anterior wall MI (see Chapters 8 and 9) may be an important warning signal of impending complete heart block and is considered by some an indication for a temporary pacemaker. However, chronic bifascicular blocks with normal sinus rhythm have a low rate of progression to complete heart block and are not indications by themselves for permanent pacemakers.
Many asymptomatic people have ECGs resembling the one in Figure 7-10 showing RBBB with left axis deviation due to LAFB. Patients with chronic bifascicular block of this kind do not generally require a permanent pacemaker unless they develop second- or third-degree AV block.
Trifascicular block with 1:1 AV conduction is rarely present on an ECG. How can one infer trifascicular block from a 12-lead ECG without sustained or intermittent complete or advanced AV block? The answer is that sometimes patients will display alternating bundle branch block (RBBB and LBBB). Rarely, this type of alternation may occur, on a beat-to-beat basis (be careful not to mistake ventricular bigeminy for this!), or at different times during more prolonged monitoring. Permanent pacemaker implantation (Chapter 21) is indicated for alternating LBBB and RBBB (trifascicular block) because of the high risk of abrupt complete heart block.
Diagnosis of Hypertrophy in the Presence of Bundle Branch Blocks
The ECG diagnosis of hypertrophy (see Chapter 6) in the presence of bundle branch blocks may pose special problems. A few general guidelines are helpful.
The usual voltage criteria for LVH can be used in the presence of RBBB. Unfortunately, RBBB often masks these typical voltage increases. The presence of LAA with RBBB suggests underlying LVH (see Fig. 7-3).
The finding of LBBB, regardless of the QRS voltage, is highly suggestive of underlying LVH. Finding LBBB with prominent QRS voltages and evidence of left atrial abnormality virtually ensures the diagnosis of LVH (see Chapter 6).
Finally, it should be re-emphasized that the echocardiogram is much more accurate than the ECG in the diagnosis of cardiac enlargement (see Chapter 6).
Diagnosis of Myocardial Infarction in the Presence of Bundle Branch Blocks
The ECG diagnosis of MI in the presence of bundle branch blocks is discussed in Chapters 8 and 9.
∗ A variation of this pattern sometimes occurs: Lead V1 may show an rS complex with a very small r wave and a wide S wave. This superficially suggests that the septum is being stimulated normally from left to right. However, lead V6 shows an abnormally wide and notched R wave without an initial q wave.
∗ Some authors use an axis of –30° or more negative for left anterior fascicular block. However, the original description of this pattern used a cutoff of 45° or more negative, the criterion suggested here. Some authors have also suggested using an axis of +90° or more positive for left posterior fascicular block. We believe, however, that this criterion will result in excessive false-positive diagnoses.