[level-membership-for-pediatrics-category]
Chapter 41 Ventilation/Perfusion Inequality
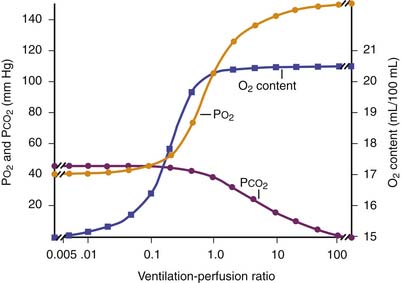
The primary function of the lung is to exchange oxygen and carbon dioxide between inspired air and blood. Efficient gas exchange requires the close matching of regional ventilation and perfusion (VA/Q). However, as the largest organ in the body, the lung is influenced by external and internal factors that affect ventilation/perfusion relationships. In children, VA/Q mismatch and intrapulmonary shunt cause most gas exchange abnormalities (Table 41-1). Lung units that are poorly ventilated in relation to blood flow (low VA/Q) produce blood with low oxygen content (desaturated blood), but units with high VA/Q ratios cannot compensate, because the oxygen content of blood leaving these areas has nearly the same oxygen content as that from normal VA/Q regions as a result of the sigmoid shape of the hemoglobin oxygen dissociation curve (Figure 41-1). Early studies supported the concept that vertical gradients of both ventilation and perfusion produced VA/Q matching. Newer studies that achieved greater spatial resolution demonstrated that perfusion and ventilation are rather heterogeneous and that this heterogeneity serves to match ventilation and perfusion.
Table 41–1 Causes of Hypoxemia
| Intrapulmonary Factors | Extrapulmonary Factors |
|---|---|
| PRIMARY | PRIMARY |
| Ventilation/perfusion mismatch | Decreased minute ventilationDecreased cardiac output |
| Shunt | Decreased Fio2 |
| Alveolar-end capillary diffusion limitation | SECONDARY |
| Decreased P50 | |
| Decreased hemoglobin concentration | |
| Alkalosis |

where O2 is O2 consumption, FIO2 is the fraction of inspired O2, A represents alveolar ventilation, and FAO2 is the fraction of alveolar O2. This equation can be rearranged to read:


where PIO2 is the inspired PO2 and PB is barometric pressure. The concept underlying this equation is that alveolar oxygen level (PAO2) is the difference between what comes in (PIO2) and the amount taken up by the pulmonary capillaries [(O2/A)(PB – 47 mm Hg)]. The ratio O2/A can be estimated from a surrogate for the ratio between O2 and A. By using PCO2 in arterial blood as an estimate of alveolar CO2, CO2/A as an estimator of FACO2, and the respiratory quotient R = CO2/O2, the second term of Equation 3 can be estimated by PACO2/R. The alveolar gas equation can then be derived as follows:


Distribution of Ventilation
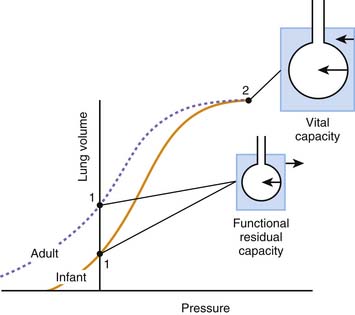
Ventilation of the lung is heterogeneous and is influenced by multiple factors, including gravity, posture, and even experimental technique. Gravity has been considered predominant because of the variation in pleural pressure from the apex to the base of the lung. The lung is a viscoelastic structure encased in the supporting chest wall, with gravity imposing a globular shape on the lung. Pleural pressure is more negative at the apex of the lung compared with the base, increasing approximately 0.25 cm H2O per centimeter of vertical distance toward the lung base. Thus transpulmonary pressure is more marked at the apex, so apical alveoli are large and at the upper end of the normal pressure volume curve. They distend less for a given pressure change, that is, they are less compliant. In the spontaneously breathing upright human, maximal gas distribution occurs at the base and progressively diminishes toward the lung apex.1,2 This gradient also exists when inhalation occurs in the supine or lateral decubitus position, although to a lesser degree. Fast inspirations from functional residual capacity (at supranormal flow rates >1.5 L/s) may reverse this distribution with preferential ventilation of the upper parts of the lung.3
Distribution of Perfusion
The predominant characteristic of the pulmonary circulation is that it is a low-pressure system. The mean pulmonary artery pressure (PPA) is approximately 15 mm Hg, whereas the mean systemic arterial pressure is on the order of 100 mm Hg. This finding implies that external pressures play a greater role in determining blood flow within the lung. According to the classical model of lung perfusion, gravity affects pulmonary blood flow (PBF) in a similar fashion and to a much greater extent. In general, the dependent areas of lung receive more blood flow. The pulmonary artery pressure decreases by 1 cm H2O per centimeter of vertical distance up the lung, so the driving pressure rapidly approaches zero with minimal blood flow to the apices, and indeed PPA may become negative. In the erect human, blood flow progressively increases from apex to base.4
The three-zone model of PBF has been widely used to explain the heterogeneity of perfusion within the lung (Figure 41-2).4 Three variables comprise the components of this model: pulmonary arterial (PPA), alveolar (PA), and pulmonary venous (PV) pressures. The degree of blood flow within the lung depends on the relative magnitudes of these pressures within that zone. Zone 1 (PA > PPA > Pv) has negligible blood flow, as the higher alveolar pressure is believed to compress collapsible capillaries. This region is one of minimal gas exchange and “wasted” ventilation. Zone 1 conditions are rare except in cases of diminished pulmonary blood flow (e.g., hypotension or cardiac failure) or increased PA encountered during positive pressure ventilation. Zone 2 consists of the mid portions of the lungs in which PPA> PA > PV, where flow rate is determined by the difference between pulmonary arterial and alveolar pressure. Venous pressure does not influence the flow rate. Blood flow progressively increases with descent through this zone as Pa increases, whereas PPA remains relatively constant.
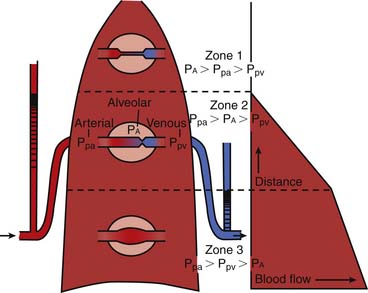
In the lowest zone of the lung described by West et al.,4 zone 3, PPA > PV > PA, therefore the arteriovenous pressure gradient (PPA – PV) determines flow rate. This gradient remains relatively constant as it descends through this zone, although because pleural pressures increase less, blood flow is greater in more dependent areas of zone 3. A zone 4 region in the most dependent areas of lung also has been described. In this region, transudated pulmonary interstitial fluid increases interstitial pressures, thereby reducing blood flow; this effect is exaggerated as lung volume diminishes from total lung capacity to residual volume.
PBF in immature animals differs in several important ways from that in adult animals. Studies in piglets suggest that the pulmonary vascular bed may be fully recruited,5,6 with no contribution of Starling resistors in the pulmonary circulation during exposure to acute or chronic hypoxia. Furthermore, neonatal piglets show a relative hypoxemia and an increased dispersion of PBF (by the multiple inert gas elimination technique [MIGET]). This dispersion is measured as the standard deviation of PBF and is the second moment on a log scale of distribution about the blood flow mean among both high and low VA/Q units compared with mature animals. In general, an increase in the standard deviation of PBF also occurs with lung disease.
Fractal Model of Pulmonary Blood Flow and Ventilation
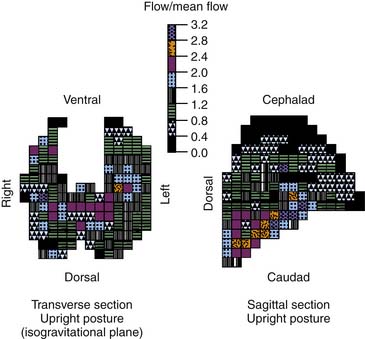
The gravitational model provided a useful and accurate model of PBF. However, as studies employed increasing power of resolution, PBF was shown to have greater heterogeneity than was described by the gravitational model.7–9 Blood flow in isogravitational planes was shown to be nearly as heterogeneous as the entire lung, yet the gravitational model predicted uniform flow in such planes (Figure 41-3). This heterogeneity in PBF was initially considered random, but the regional flow distributions were shown to be correlated with neighboring regions.9 Thus high-flow regions were adjacent to other high-flow regions and low-flow regions bordered other low-flow regions. The distribution of PBF was shown to be independent of the scale of measurement, suggesting a fractal nature of PBF.
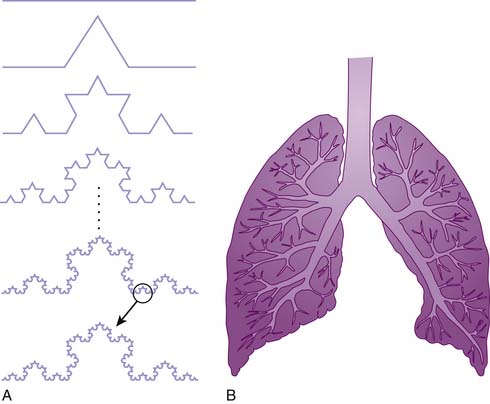
A fractal structure or process can be described as having a characteristic form that remains constant over a magnitude of scales (Figure 41-4).9 This concept of self-similarity has been recognized within the topology of the bronchial and pulmonary vascular trees. The height up the lung was shown to account for only a minority of the total variability in regional perfusion.10 In both dogs and upright baboons, gravity’s contribution to overall perfusion heterogeneity was of secondary importance, although more important in upright primates than in dogs.11 Indirect measurements of perfusion in humans under microgravity conditions showed substantial isogravitational heterogeneity of pulmonary perfusion with a hilar to peripheral gradient.12 The asymmetry of flow at branches within the pulmonary arterial tree accounts for the heterogeneity of flow within isogravitational planes. Thus regions that share a parent or grandparent branch have more similar flows than do branches that are separated by a greater distance. This fractal pattern of PBF extends down to the subacinar level of gas exchange and is stable with growth.13,14
Fractal Model of the Pulmonary Ventilation
The close correlation between regional ventilation and perfusion suggests that ventilation has spatial characteristics similar to regional perfusion. Newer methods of measuring regional ventilation showed a similar pattern with similar heterogeneity to regional perfusion.15–18 The correlation of regional heterogeneities of ventilation to those of perfusion ensures a narrow distribution of VA/Q distributions in normal animals. Fractals possess a large area-to-volume ratio that ensures that all cells are serviced by capillaries, and hence they are well suited to the task of diffusion exchange and substrate delivery no matter what the organism’s size. The high correlation between regional ventilation and perfusion may be explained by the close correlation of the developing bronchial tree and pulmonary arterial tree during organogenesis.19
Under normal circumstances, regional perfusion is tightly matched to ventilation.20 Hence the innate structure of the lung itself appears to underlie the precision of VA/Q matching. Lung basal pulmonary vascular tone is minimal, suggesting that vasoregulation is of minor importance for maintaining close VA/Q matching in the uninjured lungs.21,22 This concept was supported by animal and human experiments employing a variety of agents to alter baseline pulmonary vascular tone that showed little effect on ventilation/perfusion matching.23 Passive matching of perfusion and ventilation by pulmonary structure suggests an optimally engineered system because it requires no active feedback mechanism during normal function, which tends to develop fewer complications (Figure 41-5).24 Furthermore, a fractal system delivers substrate with a minimum of energy expended because the fractal structure minimizes the total hydrodynamic resistance of the system. Additionally, the fractal structure appears to reduce the amount of biologic material to construct the vascular and bronchial trees while still filling the space occupied by the lung.24 Finally, the fractal structure efficient uses the amount of genetic code to construct the vascular and bronchial structure by using a recursive construction mechanism that requires only a handful of proteins. A much greater amount of genetic code would exist if each branch in the bronchial and vascular system required unique genetic code.
VA/Q Abnormalities in Pulmonary Disease
Hypoxemia

Regional alveolar hypoxia causes pulmonary vasoconstriction that restricts blood flow to the area.25,26 (A similar though less robust response is seen with decreased mixed venous partial pressure of oxygen [PVO2].) The response to a local decrease in PO2 can restore the local PO2 only to approximately half its normal level, and its efficiency is best when the alveolar PO2 is in the 70 to 90 mm Hg range.26 The degree of hypoxic pulmonary vasoconstriction (HPV) varies across the lung and may be affected by sepsis, vasodilators, anesthetics, and changes in inspired oxygen. Inspiration of 100% O2 worsens VA/Q mismatch substantially.27 In neonatal piglets, exposure to chronic hypoxia with resultant pulmonary hypertension did not significantly alter VA/Q matching during room air or acute hypoxic gas breathing.5,6
Alterations in inspired or arterial CO2 tensions also have been shown to effect VA/Q ratios. Low concentrations of inspired CO2 (3% to 5%) improve VA/Q matching and perfusion heterogeneity in normal lungs, while hypocapnia produces the opposite effect.28,29 These changes in VA/Q heterogeneity appear to be dependent upon changes in pH. Hypercapnia appears to improve oxygenation in injured lungs as well, but detailed analysis of VA/Q relationships remains to be performed.30
Acute Respiratory Distress Syndrome
Acute respiratory distress syndrome (ARDS) is marked by gas exchange abnormalities that include profound hypoxemia refractory to high concentrations of inspired O2.31 Patients were found to have a bimodal distribution of lung units, one with essentially normal VA/Q and another smaller distribution representing shunt that was proportional to cardiac output.31 In some patients a fraction of units with very low VA/Q ratios also was found. Areas of high VA/Q may be observed and correlated with the level of alveolar pressure due to mechanical ventilation and the mechanical properties of the lung. The increase in shunt demonstrated with inhalation of 100% O2 remained elevated 1 hour after returning to the original FIO2. Inhibition of HPV in shunt units also may occur as a result of an increase in mixed venous PO2.
The large intrapulmonary shunt accounts for the lack of response of hypoxemia in patients with ARDS to increases in inspired oxygen. The shunt results from alveolar flooding, atelectasis, and right-to-left shunt through a patent foramen ovale. The low VA/Q units explain the increase in venous admixture with decreasing inspired fractional concentration of oxygen and may represent transient events that occur when alveoli are in the process of collapsing or reexpanding.32 Units with low VA/Q deteriorate to shunt as a result of absorption atelectasis, especially when exposed to high levels of inspired O2. Diffusion impairment contributes substantially to the gas exchange abnormalities in patients with ARDS.
Pneumonia
Hypoxemia found in patients with pneumonia is multifactorial. Pure shunt was demonstrated in a canine model of pneumococcal lobar pneumonia in the first 48 hours of infection.33 After 2 days, shunt resolved and perfusion was largely concentrated in alveoli with low VA/Q ratios. The most common pattern of VA/Q mismatching in patients with bacterial pneumonia severe enough to require mechanical ventilation was a combination of intrapulmonary shunt and increased perfusion to units with low VA/Q ratios.34 High levels of inspired O2 did not increase in patients with intrapulmonary shunt. Similar findings also were observed in spontaneously breathing patients who had less severe cases of pneumonia.35 MIGET studies suggested no role for other factors such as intrapulmonary oxygen consumption, diffusion abnormalities, or postcapillary shunt due to increased bronchial blood flow.
Asthma
Ventilation/perfusion abnormalities have been found across the spectrum of patients with asthma, from those in clinical remission to those who are acutely ill. Patients with asthma usually show a bimodal distribution of blood flow with normal units and large areas of low VA/Q.36 Patients with asthma experience little intrapulmonary shunt, indicating that collateral ventilation keeps the lung units behind severely obstructed bronchioles open. In these patients, elevated levels of cardiac output augment SvO2, preserving arterial oxygenation.
Interestingly, patients with asthma demonstrate almost no correlation between measurements of airway obstruction and respiratory and inert gas exchange.37 A study of serial changes of VA/Q inequalities and spirometric measurements in patients with acute severe asthma showed that no significant inter-individual correlations existed between maximum airflow rates and VA/Q inequalities.37 This finding suggests that spirometric changes predominantly reflect bronchoconstriction in larger and medium-sized airways, whereas VA/Q abnormalities are mainly related to events, edema, and/or mucus formation occurring in the distal small airways. High inspired oxygen concentrations may prevent HPV and place low VA/Q regions at risk for absorption atelectasis, and high doses of bronchodilators may enhance the perfusion of low VA/Q areas, exacerbating VA/Q mismatch. However, the beneficial effects of bronchodilators on airway resistance generally outweigh the worsening in VA/Q mismatch.
Pulmonary Embolism
By using inert beads to create a pulmonary embolism, Altemeier et al.23 demonstrated the nature of ventilation/perfusion abnormalities in a pulmonary embolism. The embolized beads distributed preferentially to high-flow regions of the pulmonary vasculature. They produced a shift of blood toward regions that previously had been low flow. Before the embolization, the regions with high blood flow were matched with high-ventilation regions. After the embolization, regional ventilation changed little. Consequently, the areas to which blood flow shifted now became low V/Q regions, resulting in hypoxemia.
Primary Pulmonary Hypertension
VA/Q inequalities tend to be moderate even in late stages of pulmonary hypertension.38 Much of the cardiac output is distributed to lung units with almost normal VA/Q ratios, while less than 10% perfused underventilated or unventilated areas. When Q is reduced, hypoxemia often occurs because of low mixed venous PO2. Oxygen, sodium nitroprusside, isoproterenol, and nifedipine worsened VA/Q matching, but PaO2 did not decrease because of increased Q. The resultant increase in SvO2 raised the end capillary PO2.
Therapeutic Considerations
Positive End-Expiratory Pressure
Positive end-expiratory pressure (PEEP) decreases the proportion of shunt units by recruiting the nonfunctional gas exchanging units, thereby improving functional residual capacity and arterial oxygenation. Additionally, by decreasing cardiac output (Q), PEEP produces a parallel fall in intrapulmonary shunt. However, even when Q is preserved, application of PEEP results in decreased shunt due to the redistribution of blood flow from shunt units to normal units because of alveolar recruitment.32 With constant Q, PEEP decreases venous admixture and increases mixed venous PO2. Yet PEEP tends to increase zone 1 and 2 regions within the lung, possibly increasing the vertical gradient of perfusion.
Prone Positioning
The matching of perfusion and ventilation appears to be improved in the prone position.39 MIGET analysis has suggested that the improvement in arterial blood oxygenation often seen in the prone position in normal and injured lungs is to the result of improved VA/Q matching.39 With use of simultaneous aerosolized and injectable fluorescent microspheres, Mure et al.40 showed that more evenly distributed ventilation and an increase in the correlation between ventilation and perfusion occurred in the prone position. Studies in humans have demonstrated similar findings.41
In ARDS and other lung injury models, nonaerated or poorly aerated portions of the lung are found mainly in the dependent areas. Perfusion is largely gravity independent, especially in zone 3 conditions.4 The majority of perfusion goes through dorsal lung regions, whether in the prone or supine position. As previously mentioned, positive pressure, especially PEEP, redistributes perfusion toward the dependent portion of the lungs by creating conditions of zones 2 and 1.4,32 This redistribution may increase the vertical perfusion gradient in the supine position but may reduce it in the prone position.
Nitric Oxide
Nitric oxide (NO) improves gas exchange in persons with acute lung diseases by preferentially increasing blood flow to well-ventilated regions of the lung. NO reaches the well-ventilated units, producing vasodilation and reducing shunt fraction.42 Beneficial effects appear over a wide range of doses. NO does not appear to be beneficial in persons with chronic lung diseases, possibly because the structural damage precludes rapid vascular changes or because shunt usually is not found in such diseases.
References are available online at http://www.expertconsult.com.
1. West J.B. Regional differences in gas exchange in the lung of erect man. J Appl Physiol. 1962;17:893-898.
2. Hughes J.M.B., Grant B.J.B., Greene R.E., et al. Inspiratory flow rate and ventilation distribution in normal subjects and in patients with simple bronchitis. Clin Sci. 1972;43:583-595.
3. Bake B., Wood L., Murphy B., et al. Effect of inspiratory flow rate on regional distribution of inspired gas. J Appl Physiol. 1974;37:8-17.
4. West J.B., Dollery C.T., Naimark A. Distributions of blood flow in isolated lung: relation to vascular and alveolar pressures. J Appl Physiol. 1964;19:713-724.
5. Gibson R.L., Truog W.E., Redding G.J. Hypoxic pulmonary vasoconstriction during and after infusion of group B Streptococcus in neonatal piglets: vascular pressure-flow analysis. Am Rev Respir Dis. 1988;137:774-778.
6. Redding G.J., Gibson R.L., Standaert T.A., et al. Regional pulmonary blood flow in piglets during group B streptococcal bacteremia. Am Rev Respir Dis. 1990;141:1209-1213.
7. Reed J.H., Wood E.H. Effect of body position on vertical distribution of pulmonary blood flow. J Appl Physiol. 1970;28:303-311.
8. Hakim T.S., Dean G.W., Lisbona R. Gravity independent inequality in pulmonary blood flow in humans. J Appl Physiol. 1987;63:1114-1121.
9. Glenny R.W., Robertson H.T. Fractal properties of pulmonary blood flow: characterization of spatial heterogeneity. J Appl Physiol. 1990;69:532-545.
10. Glenny R.W., Lamm W.J., Albert R.K., et al. Gravity is a minor determinant of pulmonary blood flow distribution. J Appl Physiol. 1991;71:620-629.
11. Glenny R.W., Bernard S., Robertson H.T., et al. Gravity is an important but secondary determinant of regional pulmonary blood flow in upright primates. J Appl Physiol. 1999;86:623-632.
12. Prisk G.K., Guy H.J., Elliot A.R., et al. Ventilatory inhomogeneity determined from multiple-breath washouts during sustained microgravity on Spacelab SLS-1. J Appl Physiol. 1994;70:2351-2367.
13. Glenny R.W., Bernanrd S., Robertson H.T. Pulmonary blood flow remains fractal down to the level of gas exchange. J Appl Physiol. 2000;89:742-748.
14. Glenny R.W., Bernard S., Luchtel D.L., et al. The spatial-temporal redistribution of pulmonary blood flow with postnatal growth. J Appl Physiol. 2007;102:1281-1288.
15. Altemeier W.A., McKinney S., Glenny R.W. Fractal nature of regional ventilation distribution. J Appl Physiol. 2000;88:1551-1557.
16. Harris R.S., Schuster D.P. Visualizing lung function with positron emission tomography. J Appl Physiol. 2007;102:448-458.
17. Hopkins S.R., Levin D.L., Emami K., et al. Advances in magnetic resonance imaging of lung physiology. J Appl Physiol. 2007;102:1244-1254.
18. Petersson J., Sanchez-Crespo A., Larsson S.A., et al. Physiological imaging of the lung: single-photon-emission computed tomography (SPECT). J Appl Physiol. 2004;102:468-476.
19. Weibel E.R. Fractal geometry: a design principle for living organisms. Am J Physiol Lung Cell Mol Physiol. 1991;261:L361-L369.
20. Melsom M.N., Kramer-Johansen J., Flatebo T., et al. Distribution of pulmonary ventilation and perfusions measured simultaneously in awake goats. Acta Physiol Scand. 1997;159:199-208.
21. Celermajer D.S., Dollery C., Burch M., et al. Role of the endothelium in the maintenance of low pulmonary vascular tone in normal children. Circulation. 1994;89:2041-2044.
22. Vaughan D.J., Brogan T.V., Kerr M.E., et al. Contributions of nitric oxide synthase isozymes to exhaled nitric oxide and hypoxic pulmonary vasoconstriction in rabbit lungs. Am J Physiol Lung Cell Mol Physiol. 2003;284:L834-L843.
23. Altemeier W.A., Robertson H.T., McKinney S., et al. Pulmonary embolization causes hypoxemia by redistribution regional blood flow without changing ventilation. J Appl Physiol. 1998;85:2337-2343.
24. West G.B., Brown J.H., Enquist B.J. A general model for the origin of allometric scaling laws in biology. Science. 1997;276:122-126.
25. Duke H.N. Site of action of anoxia on the pulmonary blood vessels of the cat. J Physiol (Lond). 125, 1954. 393-382
26. Grant B.J.B., Davies E.E., Jones H.A., et al. Local regulation of pulmonary blood flow and ventilation/perfusion ratios in the coati mundi. J Appl Physiol. 1976;40:216-228.
27. Dantzker D.R., Wagner P.D., West J.B. Instability of lung units with low ratios during O2 breathing. J Appl Physiol. 1975;38:886-895.
28. Swenson E.R., Robertson H.T., Hlastala M.P. Effects of inspired carbon dioxide on ventilation-perfusion matching in normoxia, hypoxia, and hyperoxia. Am J Respir Crit Care Med. 1994;149:1563-1569.
29. Domino K.B., Swenson E.R., Hlastala M.P. Hypocapnia-induced ventilation/perfusion mismatch: a direct CO2 or pH-mediated effect? Am J Respir Crit Care Med. 1995;152(5 Pt 1):1534-1539.
30. Keenan R.J., Todd T.R.J., Wood W., et al. Effects of hypercarbia on arterial and alveolar oxygen tensions in a model of gram negative pneumonia. J Appl Physiol. 1990;68:1820-1825.
31. Dantzker D.R., Bower J.S. Pulmonary vascular tone improves VA/Q matching in obliterative pulmonary hypertension. J Appl Physiol. 1981;51:607-613.
32. Walther S.M., Domino K.B., Glenny R.W., et al. Positive end-expiratory pressure redistributes perfusion to dependent regions in supine but not prone lambs. Crit Care Med. 1999;27:37-45.
33. Wagner P.D., Laravuso R.B., Goldzimmer E., et al. Distribution of ventilation-perfusion in dogs with normal and abnormal lungs. J Appl Physiol. 1975;38:1099-1109.
34. Gea J., Roca J., Torres A., et al. Mechanism of abnormal gas exchange in patients with pneumonia. Anesthesiology. 1991;75:782-789.
35. Lampron N., Lemaire F., Teisseire B., et al. Mechanical ventilation with 100% oxygen does not increase intrapulmonary shunt in patients with severe bacterial pneumonia. Am Rev Respir Dis. 1985;131:409-413.
36. Wagner P.D., Dantzker D.R., Iacovoni V.E., et al. Ventilation-perfusion inequality in asymptomatic asthma. Am Rev Respir Dis. 1978;136:605-612.
37. Roca J., Ramis L., Rodriguez-Roisin R., et al. Serial relationships between ventilation-perfusion inequality and spirometry in acute severe asthma requiring hospitalization. Am Rev Respir Dis. 1988;137:579-584.
38. Dantzker D.R., Bower J.S. Pulmonary vascular tone improves VA/Q matching in obliterative pulmonary hypertension. J Appl Physiol. 1981;51:607-613.
39. Beck K.C., Vetterman J., Rehder K. Gas exchange in dogs in the prone and supine positions. J Appl Physiol. 1992;72:2292-2297.
40. Mure M., Domino K.B., Lindahl S.G.E., et al. Regional ventilation-perfusion distribution is more uniform in the prone position. J Appl Physiol. 2000;88:1076-1083.
41. Musch G., Layfield J.D., Harris R.S., et al. Topographical distribution of pulmonary perfusion and ventilation, assessed by PET in supine and prone humans. J Appl Physiol. 2002;93:1841-1851.
42. Cooper C.J., Landzberg M.J., Anderson T.J., et al. Role of nitric oxide in local regulation of pulmonary vascular resistance in humans. Circulation. 1996;93:266-271.
[/level-membership-for-pediatrics-category][not-level-membership-for-pediatrics-category]
Chapter 41 Ventilation/Perfusion Inequality
The primary function of the lung is to exchange oxygen and carbon dioxide between inspired air and blood. Efficient gas exchange requires the close matching of regional ventilation and perfusion (VA/Q). However, as the largest organ in the body, the lung is influenced by external and internal factors that affect ventilation/perfusion relationships. In children, VA/Q mismatch and intrapulmonary shunt cause most gas exchange abnormalities (Table 41-1). Lung units that are poorly ventilated in relation to blood flow (low VA/Q) produce blood with low oxygen content (desaturated blood), but units with high VA/Q ratios cannot compensate, because the oxygen content of blood leaving these areas has nearly the same oxygen content as that from normal VA/Q regions as a result of the sigmoid shape of the hemoglobin oxygen dissociation curve (Figure 41-1). Early studies supported the concept that vertical gradients of both ventilation and perfusion produced VA/Q matching. Newer studies that achieved greater spatial resolution demonstrated that perfusion and ventilation are rather heterogeneous and that this heterogeneity serves to match ventilation and perfusion.
Table 41–1 Causes of Hypoxemia
| Intrapulmonary Factors | Extrapulmonary Factors |
|---|---|
| PRIMARY | PRIMARY |
| Ventilation/perfusion mismatch | Decreased minute ventilationDecreased cardiac output |
| Shunt | Decreased Fio2 |
| Alveolar-end capillary diffusion limitation | SECONDARY |
| Decreased P50 | |
| Decreased hemoglobin concentration | |
| Alkalosis |
where O2 is O2 consumption, FIO2 is the fraction of inspired O2, A represents alveolar ventilation, and FAO2 is the fraction of alveolar O2. This equation can be rearranged to read:
where PIO2 is the inspired PO2 and PB is barometric pressure. The concept underlying this equation is that alveolar oxygen level (PAO2) is the difference between what comes in (PIO2) and the amount taken up by the pulmonary capillaries [(O2/A)(PB – 47 mm Hg)]. The ratio O2/A can be estimated from a surrogate for the ratio between O2 and A. By using PCO2 in arterial blood as an estimate of alveolar CO2, CO2/A as an estimator of FACO2, and the respiratory quotient R = CO2/O2, the second term of Equation 3 can be estimated by PACO2/R. The alveolar gas equation can then be derived as follows:
Distribution of Ventilation
Ventilation of the lung is heterogeneous and is influenced by multiple factors, including gravity, posture, and even experimental technique. Gravity has been considered predominant because of the variation in pleural pressure from the apex to the base of the lung. The lung is a viscoelastic structure encased in the supporting chest wall, with gravity imposing a globular shape on the lung. Pleural pressure is more negative at the apex of the lung compared with the base, increasing approximately 0.25 cm H2O per centimeter of vertical distance toward the lung base. Thus transpulmonary pressure is more marked at the apex, so apical alveoli are large and at the upper end of the normal pressure volume curve. They distend less for a given pressure change, that is, they are less compliant. In the spontaneously breathing upright human, maximal gas distribution occurs at the base and progressively diminishes toward the lung apex.1,2 This gradient also exists when inhalation occurs in the supine or lateral decubitus position, although to a lesser degree. Fast inspirations from functional residual capacity (at supranormal flow rates >1.5 L/s) may reverse this distribution with preferential ventilation of the upper parts of the lung.3
Distribution of Perfusion
The predominant characteristic of the pulmonary circulation is that it is a low-pressure system. The mean pulmonary artery pressure (PPA) is approximately 15 mm Hg, whereas the mean systemic arterial pressure is on the order of 100 mm Hg. This finding implies that external pressures play a greater role in determining blood flow within the lung. According to the classical model of lung perfusion, gravity affects pulmonary blood flow (PBF) in a similar fashion and to a much greater extent. In general, the dependent areas of lung receive more blood flow. The pulmonary artery pressure decreases by 1 cm H2O per centimeter of vertical distance up the lung, so the driving pressure rapidly approaches zero with minimal blood flow to the apices, and indeed PPA may become negative. In the erect human, blood flow progressively increases from apex to base.4
The three-zone model of PBF has been widely used to explain the heterogeneity of perfusion within the lung (Figure 41-2).4 Three variables comprise the components of this model: pulmonary arterial (PPA), alveolar (PA), and pulmonary venous (PV) pressures. The degree of blood flow within the lung depends on the relative magnitudes of these pressures within that zone. Zone 1 (PA > PPA > Pv) has negligible blood flow, as the higher alveolar pressure is believed to compress collapsible capillaries. This region is one of minimal gas exchange and “wasted” ventilation. Zone 1 conditions are rare except in cases of diminished pulmonary blood flow (e.g., hypotension or cardiac failure) or increased PA encountered during positive pressure ventilation. Zone 2 consists of the mid portions of the lungs in which PPA> PA > PV, where flow rate is determined by the difference between pulmonary arterial and alveolar pressure. Venous pressure does not influence the flow rate. Blood flow progressively increases with descent through this zone as Pa increases, whereas PPA remains relatively constant.
In the lowest zone of the lung described by West et al.,4 zone 3, PPA > PV > PA, therefore the arteriovenous pressure gradient (PPA – PV) determines flow rate. This gradient remains relatively constant as it descends through this zone, although because pleural pressures increase less, blood flow is greater in more dependent areas of zone 3. A zone 4 region in the most dependent areas of lung also has been described. In this region, transudated pulmonary interstitial fluid increases interstitial pressures, thereby reducing blood flow; this effect is exaggerated as lung volume diminishes from total lung capacity to residual volume.
PBF in immature animals differs in several important ways from that in adult animals. Studies in piglets suggest that the pulmonary vascular bed may be fully recruited,5,6 with no contribution of Starling resistors in the pulmonary circulation during exposure to acute or chronic hypoxia. Furthermore, neonatal piglets show a relative hypoxemia and an increased dispersion of PBF (by the multiple inert gas elimination technique [MIGET]). This dispersion is measured as the standard deviation of PBF and is the second moment on a log scale of distribution about the blood flow mean among both high and low VA/Q units compared with mature animals. In general, an increase in the standard deviation of PBF also occurs with lung disease.
Fractal Model of Pulmonary Blood Flow and Ventilation
The gravitational model provided a useful and accurate model of PBF. However, as studies employed increasing power of resolution, PBF was shown to have greater heterogeneity than was described by the gravitational model.7–9 Blood flow in isogravitational planes was shown to be nearly as heterogeneous as the entire lung, yet the gravitational model predicted uniform flow in such planes (Figure 41-3). This heterogeneity in PBF was initially considered random, but the regional flow distributions were shown to be correlated with neighboring regions.9 Thus high-flow regions were adjacent to other high-flow regions and low-flow regions bordered other low-flow regions. The distribution of PBF was shown to be independent of the scale of measurement, suggesting a fractal nature of PBF.
[/not-level-membership-for-pediatrics-category]
