Chapter 5
Ventilation and Ventilatory Control Tests
1. Describe the measurement of tidal volume and minute ventilation.
2. Identify at least two causes of decreased minute ventilation.
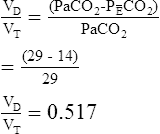
3. Calculate the VD/VT ratio, using the modified Bohr equation.
1. Compare the calculation of VD/VT, using Paco2 and Petco2.
2. List at least two causes for an increased VD/VT ratio.
3. Explain the function of a variable CO2 scrubber in a circuit for measuring ventilatory response to hypoxia.
Tidal volume, rate, and minute ventilation
Description
Tidal volume (VT) is the volume of gas inspired or expired during each respiratory cycle (see Figure 2-1). It is usually measured in liters or milliliters and corrected to BTPS. Conventionally, the volume expired is expressed as VT. The respiratory rate is the number of breaths per minute (sometimes called breathing frequency or respiratory frequency or fb). The total volume of gas expired per minute is ![]() E, or minute ventilation.
E, or minute ventilation. ![]() E includes alveolar and dead space ventilation and is recorded in liters per minute, BTPS.
E includes alveolar and dead space ventilation and is recorded in liters per minute, BTPS.
Technique
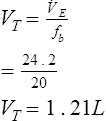
VT can be measured directly by simple spirometry (see Figure 2-1). The patient breathes into a volume-displacement or flow-sensing spirometer (see Chapter 11). Volume change may be measured directly from the excursions of a volume spirometer. VT may also be measured from an integrated flow signal (see Chapter 11). A graphic representation of tidal breathing can be displayed on a computer screen. Because no two breaths are the same, inhaled or exhaled tidal breaths should be measured for at least 1 minute and then divided by the rate to determine an average volume:

![]() = volume expired or inspired per minute (usually the
= volume expired or inspired per minute (usually the ![]() E )
E )
fb = number of breaths for the same interval (i.e., the respiratory rate)
Respiratory frequency (fb) may be determined by counting chest movements, noting the excursions of a volume displacement spirometer (Criteria for Acceptability 5-1), or most commonly by measuring flow changes while the subject breathes through a flow-sensing spirometer. Counting the rate for several minutes and taking an average produces a more accurate value than shorter measurements. Prolonged measurement of VT and rate with a volume-displacement spirometer requires a means of removing CO2. This is called a rebreathing system and uses a chemical CO2 absorber (see Figure 4-1, B). Sodium hydroxide crystals (Sodasorb) or barium hydroxide crystals (Baralyme) are commonly used to scrub CO2 from rebreathing systems. Flow-sensing spirometers usually do not require a chemical absorber.
Significance and Pathophysiology
See Interpretive Strategies 5-1. Average VT for healthy adults at rest ranges between 400 and 700 mL, but there is considerable variation. Decreased VT occurs in many types of pulmonary disorders, particularly those that cause severe restrictive patterns. Pulmonary fibrosis and neuromuscular diseases (e.g., myasthenia gravis) often cause reduced VT. Decreased tidal breathing usually accompanies changes in the mechanical properties of the lungs or chest wall (i.e., compliance and resistance). These changes usually produce an increased respiratory rate (fb) required to maintain an adequate ![]() A. Decreases in both VT and respiratory rate are often associated with respiratory center depression because of drugs or pathologic conditions affecting the brain stem. Low VT and rate usually result in alveolar hypoventilation.
A. Decreases in both VT and respiratory rate are often associated with respiratory center depression because of drugs or pathologic conditions affecting the brain stem. Low VT and rate usually result in alveolar hypoventilation.
Decreased ventilation may result from hypocapnia, metabolic alkalosis, respiratory center depression, or neuromuscular disorders that involve the ventilatory muscles. Hypoventilation is defined as inadequate ventilation to maintain a normal arterial Pco2, with respiratory acidosis as the result. The diagnosis of either hyperventilation or hypoventilation requires blood gas analysis (see Chapter 6).
Respiratory dead space and alveolar ventilation
Description
![]() A is the volume of gas that participates in gas exchange in the lungs. It can be expressed as:
A is the volume of gas that participates in gas exchange in the lungs. It can be expressed as:

![]() D= dead space ventilation per minute
D= dead space ventilation per minute
Technique
Dead Space

FAco2 = fraction of CO2 in alveolar gas
Fco2 = fraction of CO2 in mixed expired gas

P co2 = Pco2 of mixed expired gas sample
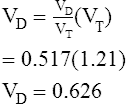
The VD/VT ratio can be calculated if arterial and mixed-expired Pco2 values are known. It can also be estimated noninvasively. End-tidal Pco2 (see the section on capnography in Chapter 6) can be used to estimate Paco2. The main advantage of this method is that it is not necessary to obtain an arterial blood sample. This technique is often used in systems that monitor expired CO2 continuously and in breath-by-breath metabolic measurement devices. VD/VT may be calculated as follows:

Pco2= Pco2 of mixed-expired gas sample
Alveolar Ventilation
![]() A can be calculated in two ways:
A can be calculated in two ways:

Because atmospheric gas contains almost no CO2, ![]() A can be calculated on the basis of CO2 elimination from the lungs. A volume of expired gas may be collected in a bag, balloon, or spirometer and analyzed to determine the volume of CO2 (see Chapter 7). The following equation can then be used:
A can be calculated on the basis of CO2 elimination from the lungs. A volume of expired gas may be collected in a bag, balloon, or spirometer and analyzed to determine the volume of CO2 (see Chapter 7). The following equation can then be used:

![]() co2= volume of CO2 produced in liters per minute (STPD)
co2= volume of CO2 produced in liters per minute (STPD)
FAco2= fractional concentration of CO2 in alveola

End-tidal CO2 may not equal alveolar CO2 in patients with grossly abnormal patterns of ventilation-perfusion (see Chapter 6).

![]() co2= CO2 production in mL/min (STPD)
co2= CO2 production in mL/min (STPD)
Paco2= partial pressure of arterial CO2
0.863= conversion factor (concentration to partial pressure, correcting ![]() co2 to BTPS)
co2 to BTPS)
Significance and Pathophysiology
See Interpretive Strategies 5-2. Measurement of VD yields important information regarding the ventilation-perfusion characteristics of the lungs. Anatomic dead space is larger in men than in women because of differences in body size. It increases along with the VT during exercise, as well as in certain forms of pulmonary disease (e.g., bronchiectasis). It may be decreased in asthma or in diseases characterized by bronchial obstruction or mucus plugging. Because of the difficulty in measuring the anatomic dead space, estimates based on age, sex, functional residual capacity, or body size may be used. For clinical purposes, anatomic dead space in milliliters is sometimes considered equal to the patient’s ideal body weight in pounds or twice their weight in kilograms.
Of greater clinical significance is the measurement of respiratory dead space, which is accomplished reasonably well by applying the Bohr equation. The portion of ventilation wasted on the conducting airways and poorly perfused alveoli is usually expressed as the VD/VT ratio. The normal value for VD/VT in spontaneously breathing adults is about 0.3 (with a range of 0.2–0.4). VD/VT is also commonly expressed as a percentage (e.g., 30%). Expressing dead space in this way eliminates the need to measure the volume of expired gas in the Bohr equation. However, if VT or ![]() E is known, dead space volume can be easily calculated. Physiologic dead space measurements are a good index of ventilation-blood flow ratios because all CO2 in expired gas comes from perfused alveoli (see Chapter 6). If there were no dead space in the lung, arterial and mixed-expired CO2 would be equal. As the difference between arterial and mixed-expired CO2 increases, the volume of “wasted” ventilation rises.
E is known, dead space volume can be easily calculated. Physiologic dead space measurements are a good index of ventilation-blood flow ratios because all CO2 in expired gas comes from perfused alveoli (see Chapter 6). If there were no dead space in the lung, arterial and mixed-expired CO2 would be equal. As the difference between arterial and mixed-expired CO2 increases, the volume of “wasted” ventilation rises.
The ![]() A at rest is approximately 4–5 L/min with wide variations in healthy adults. The adequacy of
A at rest is approximately 4–5 L/min with wide variations in healthy adults. The adequacy of ![]() A can be determined by arterial blood gas studies only. Low
A can be determined by arterial blood gas studies only. Low ![]() A associated with acute respiratory acidosis (Paco2 greater than 45 and pH less than 7.35 in healthy patients) defines hypoventilation. Excessive
A associated with acute respiratory acidosis (Paco2 greater than 45 and pH less than 7.35 in healthy patients) defines hypoventilation. Excessive ![]() A (Paco2 less than 35 and pH greater than 7.45 in healthy patients) defines hyperventilation. Chronic hypoventilation and hyperventilation are associated with abnormal Paco2 values but near-normal pH values (see Chapter 6). Decreased
A (Paco2 less than 35 and pH greater than 7.45 in healthy patients) defines hyperventilation. Chronic hypoventilation and hyperventilation are associated with abnormal Paco2 values but near-normal pH values (see Chapter 6). Decreased ![]() A can result from absolute increases in dead space and decreases in
A can result from absolute increases in dead space and decreases in ![]() E.
E.
Ventilatory response tests for carbon dioxide and oxygen
Description
Technique
The response to increasing levels of CO2 (hypercapnia) can be measured in two ways:
1. Open-circuit technique. The patient breathes increasing concentrations (1%–7%) of CO2 in air or O2 from a demand valve or reservoir until a steady state is reached. Measurements of Petco2, Paco2, P100, and ![]() E may be made at each concentration.
E may be made at each concentration.
2. Closed-circuit or rebreathing technique. The patient rebreathes from a reservoir (usually an anesthesia bag) of 6–7% CO2 in O2. The breathing circuit usually includes ports for pressure monitoring (P100) and for extracting gas samples (Petco2). A pneumotachometer is placed in the rebreathing circuit to record ![]() E. Alternatively, the gas reservoir bag may be placed in a rigid container or box and volume change measured by connecting a spirometer to the container (i.e., “bag-in-box” setup). The patient rebreathes until the concentration of Petco2 exceeds 9% or until 4 minutes have elapsed. The rebreathed gas may be analyzed to ensure that the Fio2 remains above 0.21. The patient’s Spo2 may also be monitored by means of a pulse oximeter. Changes in
E. Alternatively, the gas reservoir bag may be placed in a rigid container or box and volume change measured by connecting a spirometer to the container (i.e., “bag-in-box” setup). The patient rebreathes until the concentration of Petco2 exceeds 9% or until 4 minutes have elapsed. The rebreathed gas may be analyzed to ensure that the Fio2 remains above 0.21. The patient’s Spo2 may also be monitored by means of a pulse oximeter. Changes in ![]() E are monitored and plotted against Petco2 to obtain a response curve. A plot of
E are monitored and plotted against Petco2 to obtain a response curve. A plot of ![]() E versus Petco2 may be used to determine a slope or response curve. The CO2 response curve may be extrapolated backward to determine the Pco2 at which ventilation would be zero. This Pco2 is termed the threshold and is sometimes used as a measure of sensitivity to the ventilatory stimulant.
E versus Petco2 may be used to determine a slope or response curve. The CO2 response curve may be extrapolated backward to determine the Pco2 at which ventilation would be zero. This Pco2 is termed the threshold and is sometimes used as a measure of sensitivity to the ventilatory stimulant.
1. Open-circuit technique. The patient breathes gas mixtures containing O2 concentrations from 20%–12%, to which CO2 is added to maintain alveolar Pco2 (Paco2) at a constant level. When a steady state is reached, Pao2, ![]() E, and P100 can be measured. This procedure, often called a step test, is repeated with decreasing O2 concentrations to produce the response curve. Continuous monitoring of Petco2 is necessary to titrate the addition of CO2 to the system to maintain isocapnia (Figure 5-1). Pulse oximetry may be used to monitor changes in saturation. CO2 response curves are sometimes measured at widely varying Pao2 levels, and the subsequent difference in ventilation or P100 at any particular Pco2 is attributed to the response to hypoxemia.
E, and P100 can be measured. This procedure, often called a step test, is repeated with decreasing O2 concentrations to produce the response curve. Continuous monitoring of Petco2 is necessary to titrate the addition of CO2 to the system to maintain isocapnia (Figure 5-1). Pulse oximetry may be used to monitor changes in saturation. CO2 response curves are sometimes measured at widely varying Pao2 levels, and the subsequent difference in ventilation or P100 at any particular Pco2 is attributed to the response to hypoxemia.
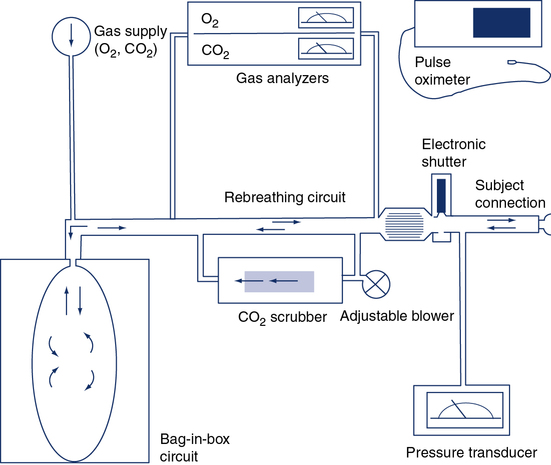
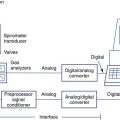
The circuit allows the patient to rebreathe from a bag to which CO2 or O2 can be added. Gas analyzers allow continuous monitoring of gas concentrations in the circuit during testing. Ventilation is measured by integrating flow from the pneumotachometer or by attaching a spirometer to the bag-in-box setup. A pressure transducer and mouth shutter allow the measurement of P100, and a pulse oximeter provides data on the patient’s saturation. A CO2 scrubber with an adjustable blower allows the level of CO2 in the system to be maintained at baseline levels (isocapnia). Increases in ventilation caused by the gradual consumption of O2 in the circuit can be measured by scrubbing just enough of the exhaled CO2 to maintain a near-normal alveolar Pco2. A similar circuit can be used to measure response to CO2 by rebreathing. The bag is filled with 5%–7% CO2 in O2, and the scrubber is removed from the circuit.
2. Closed-circuit technique (progressive hypoxemia). The patient rebreathes from a system similar to that used for the closed-circuit CO2 response, but the system contains a CO2 scrubber. CO2 can be added to the inspired gas to maintain isocapnia, or an adjustable blower may be used to direct a portion of the rebreathed gas through the scrubber to maintain isocapnia (see Figure 5-1). Response to decreasing inspired Po2 is monitored by recording ![]() E or P100, and the Pao2 or saturation is measured either directly by indwelling catheter or by pulse oximetry.
E or P100, and the Pao2 or saturation is measured either directly by indwelling catheter or by pulse oximetry.
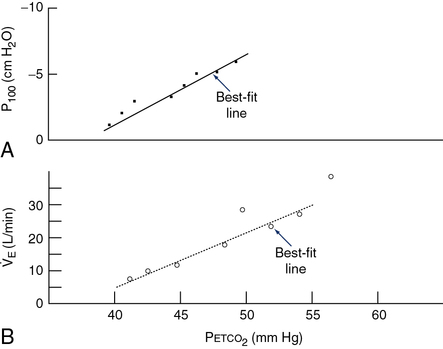
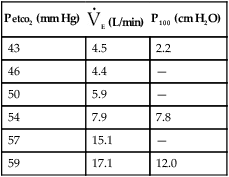
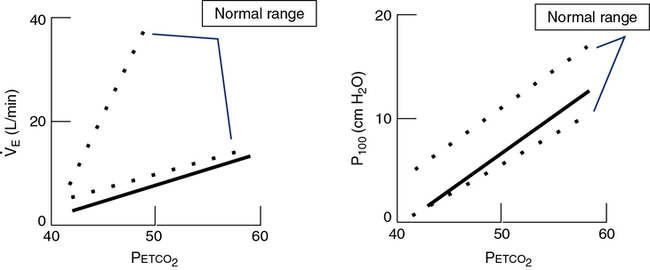
P100 is measured with a system similar to that in Figure 5-1. A port at the mouth records pressure changes versus time, by means of a computer or high-speed recorder. A large-bore stopcock or electronic shutter mechanism is included in the inspiratory line so that inspiratory flow can be randomly occluded. The stopcock or shutter can be closed so that inspiration occurs against a complete occlusion near functional residual capacity. The entire apparatus is usually hidden so that the patient is unaware of the impending airway occlusion. A pressure-time curve is recorded. P100 is usually measured at varying Petco2 values or levels of desaturation to assess the effect of changing stimuli to ventilation. P100 and ![]() E are usually graphed against Petco2 (Figure 5-2) or versus O2 saturation (for O2 response tests). See Criteria for Acceptability 5-2 for ventilatory response measurements.
E are usually graphed against Petco2 (Figure 5-2) or versus O2 saturation (for O2 response tests). See Criteria for Acceptability 5-2 for ventilatory response measurements.
Significance and Pathophysiology
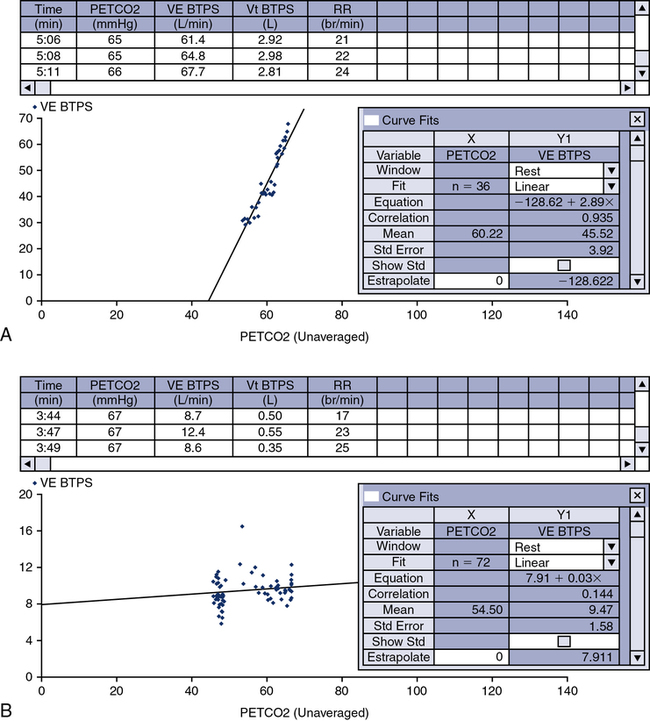
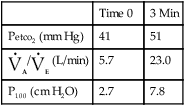
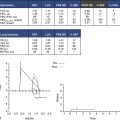
See Interpretive Strategies 5-3. The response to an increase in Paco2 in a normal individual is a linear increase in ![]() E of approximately 3 L/min/mm Hg (Pco2). The normal range of response varies from 1–6 L/min/mm Hg Pco2. Some variation is present in repeated testing of the same individual. The response to CO2 in patients who have obstructive disease may be reduced. This is partially attributable to increased airway resistance, which has been shown to reduce ventilatory drive in healthy individuals. It is unclear why some patients who have obstructive disease increase ventilation to maintain a normal Paco2, whereas others tolerate an increased Paco2. Genetic variation in drive may explain some of the differences in blood gas tensions in patients with chronic obstructive pulmonary disease (COPD). Lesions in the central nervous system may also cause a decreased sensitivity to CO2 (Figures 5-3, A and B). Some individuals who have no respiratory muscle weakness, mechanical ventilatory problems, or neurologic disease have a decreased sensitivity to CO2. This condition is described as primary alveolar hypoventilation. These patients can lower their Pco2 by voluntary hyperventilation (Figure 5-4).
E of approximately 3 L/min/mm Hg (Pco2). The normal range of response varies from 1–6 L/min/mm Hg Pco2. Some variation is present in repeated testing of the same individual. The response to CO2 in patients who have obstructive disease may be reduced. This is partially attributable to increased airway resistance, which has been shown to reduce ventilatory drive in healthy individuals. It is unclear why some patients who have obstructive disease increase ventilation to maintain a normal Paco2, whereas others tolerate an increased Paco2. Genetic variation in drive may explain some of the differences in blood gas tensions in patients with chronic obstructive pulmonary disease (COPD). Lesions in the central nervous system may also cause a decreased sensitivity to CO2 (Figures 5-3, A and B). Some individuals who have no respiratory muscle weakness, mechanical ventilatory problems, or neurologic disease have a decreased sensitivity to CO2. This condition is described as primary alveolar hypoventilation. These patients can lower their Pco2 by voluntary hyperventilation (Figure 5-4).
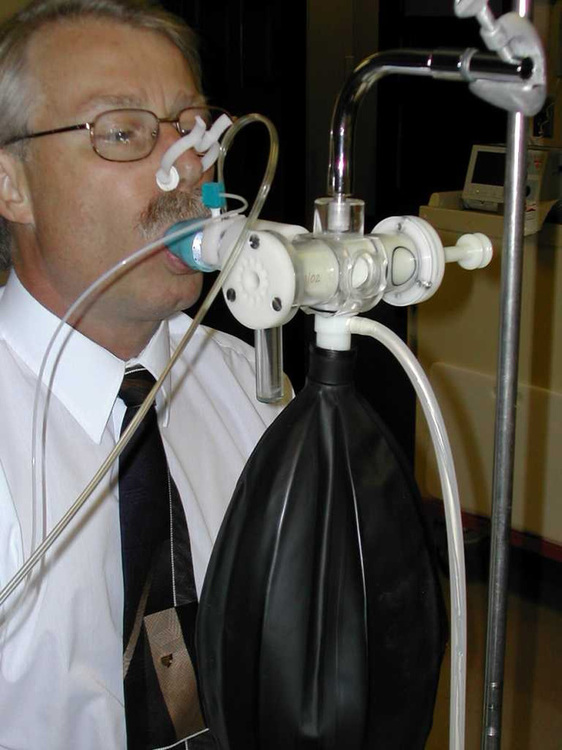
The subject is placed on the breathing valve with 10 liter rebreathing bag partially filled with a 6% CO2, balance O2 gas mixture. After 3-5 minutes of monitoring quiet breathing, they are switched into the rebreathing system. The test is terminated when the concentration of Petco2 exceeds 9%, or until 4 minutes have elapsed, and/or subject intolerance.
High altitude simulation test
Description
Technique
altitude other than sea level, a factor is calculated to use in the alveolar air equation:


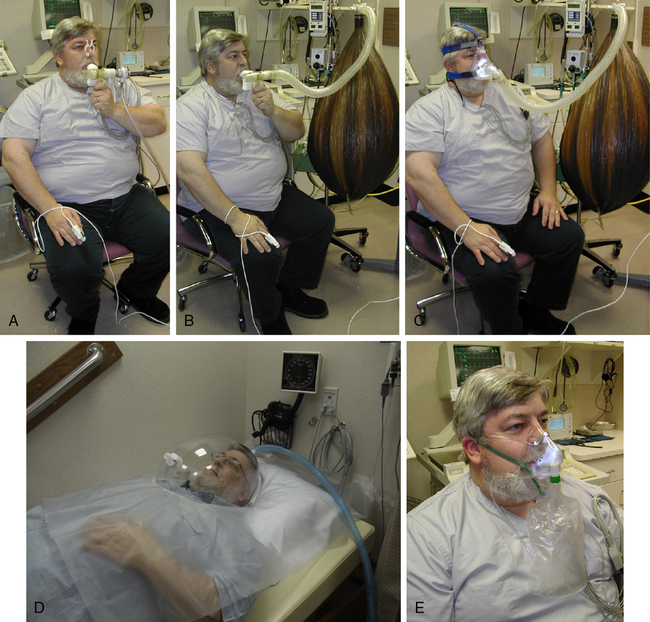
The desired FIO2 can be delivered via a specialized tank mixture administered with a demand valve, a mixed gas (100% nitrogen and room air added to a Douglas bag, analyzed to desired FIO2 and delivered via directional valve), a blender attached to 100% nitrogen supply and compressed air tanks, or a Ventimask driven by a 100 nitrogen source (40% setting = 14%-15% FIO2; 35% setting = 15%-16% FIO2). Patient interface has been evaluated with mask and canopy being the preferred methods by the subject (Figure 5-5). Once the desired FIO2 is established and the mode of delivery determined, the subject can be tested. It is typical to monitor the patient’s electrocardiogram (5 leads at a minimum) during the procedure. The Borg scale may also be used to assess dyspnea or breathlessness during the study. The patient oxygen level is monitored with pulse oximetry. Some laboratories assess end of test oxygen status using arterial blood gas, whereas others rely on the oximetry readings if the signal quality is acceptable. The subject breathes the hypoxic gas mixture for 20 minutes. The test is terminated early if the patient’s SpO2 is less than 80%, there is a change in the ECG rhythm, ST-T wave depression/elevation is greater than 1.0 mm, or the patient develops symptoms suggesting intolerance.
Significance and Pathophysiology
Air travel causes significant hypobaric hypoxemia in patients at risk. The British Thoracic Society recommends an evaluation before airline travel in subjects with severe COPD or asthma, severe restrictive disease, cystic fibrosis, and comorbidity conditions worsened by hypoxemia (CAD, CHF, etc.). A HAST should be performed if the screening process yields a resting SpO2 between 92%-95% with additional risk factors (Table 5-1).
Table 5-1
| Screening Result | Recommendation |
| Sea level SpO2 >95% | Oxygen not required [B] |
| Sea level SpO2 92%-95% and no risk factor* | Oxygen not required [C] |
| Sea level SpO2 92%-95% and additional risk factor* | Perform hypoxic challenge test with arterial or capillary measurements [B] |
| Sea level SpO2 <92% | In-flight oxygen [B] |
| Receiving supplemental oxygen at sea level | Increase the flow while at cruising altitude [B] |
*Additional risk factors: hypercapnia; FEV1<50% predicted; lung cancer; restrictive lung disease involving the parenchyma (fibrosis), chest wall (kyphoscoliosis) or respiratory muscles; ventilator support; cerebrovascular or cardiac disease; within 6 weeks of discharge for an exacerbation of chronic lung or cardiac disease. Grade type of recommendations
ARequires at least one randomized controlled trial as part of the body of literature of overall good quality and consistency addressing the specific recommendation
BRequires availability of well-conducted clinical studies but no randomized clinical trials on the topic of recommendation
CRequires evidence from expert committee reports or opinions and/or clinical experience of respected authorities; indicates absence of directly applicable studies of good quality
(From British Thoracic Society Standards of Care Committee. Managing passengers with respiratory disease planning air travel: British Thoracic Society recommendations. Thorax. 2002;57:289-304. Posted thorax.bmjjournals.com, Nov. 13, 2005.)
Equations are available to predict in-flight hypoxemia; however, several authors have concluded that equations do not accurately predict altitude Pao2 and favor a hypoxia altitude test (see Criteria for Acceptability 5-2 and Interpretive Strategies 5-3).
Summary
• The chapter discusses measurement of ![]() E, VT, respiratory rate, alveolar ventilation, dead space, and the ventilatory responses to hypercapnia and hypoxemia.
E, VT, respiratory rate, alveolar ventilation, dead space, and the ventilatory responses to hypercapnia and hypoxemia.
• Resting ventilatory measurements can be used in conjunction with blood gases to evaluate respiratory status.
• One of the most important parameters is the respiratory or physiologic dead space. An estimate of wasted ventilation can be made by comparing expired CO2 with arterial Pco2. Dead space and reduced ![]() A are common in many pulmonary disorders. When dead space increases, ventilation must increase to maintain a normal acid-base status.
A are common in many pulmonary disorders. When dead space increases, ventilation must increase to maintain a normal acid-base status.
• Disorders of ventilatory control are also common to many diseases. Evaluation of responses to hypoxemia and hypercapnia are often useful in characterizing types of ventilatory response disorders. Different techniques of assessing responses have been described.
• The rebreathing techniques for O2 and CO2 are used most often. P100 can discriminate central ventilatory drive problems from other causes of abnormal responses.
• HAST, also known as hypoxia inhalation test (HIT), is used to emulate high altitude in subjects susceptible to hypoxia during air travel (i.e., COPD, pulmonary fibrosis). If the subject desaturates significantly (SpO2 or SaO2 less than 84%), the clinician can order supplemental oxygen during flight.

 100 mm Hg). It is recorded as L/min/mm Hg P
 40 mm Hg). The change in ventilation (in liters per minute) may be recorded in relation to changes in Pa