CHAPTER 78 Vascular Ultrasonography
Physics, Instrumentation, and Clinical Techniques
DESCRIPTION OF TECHNICAL REQUIREMENTS
Physical Principles and Instrumentation in Vascular Ultrasonography
Ultrasound imaging is based on sound propagation in the body and its reflections from scatterers in the tissue and bloodstream, and reflections from interfaces between different tissues (Fig. 78-1). The reason for reflection and scattering is the difference in the mechanical impedances of different tissue and scatterers. The reflected and scattered ultrasound waves are collected with transducer arrays and converted to an image, which reveals the anatomic structures of the body.
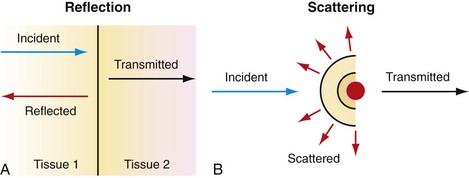
 FIGURE 78-1
Ultrasound transducer arrays are conventionally made of piezoelectric material, which is a special kind of crystal that converts electrical energy into acoustic energy and vice versa. By electronically controlling the hundreds of elements of which the transducer arrays are composed, these arrays can focus, steer, or translate the ultrasound beam. The first step to form an image is to transmit a focused ultrasound beam into the body that travels more or less along a line, and the echoes coming from the reflectors and scatterers along this line are collected by the transducer array. While receiving the echoes, the transducer array is dynamically focused to find the gray-scale value of a pixel on the line—black pixel means there is nothing to reflect ultrasound. This forms an image line. The steps that form an image line are repeated hundreds of times while the beam is translated or steered (or both) from line to line. As shown in Figure 78-2, four basic types of transducers are used in ultrasound imaging, which are classified according to how the image lines are formed: linear sequenced array, curvilinear array, linear phased array, and vector array.1
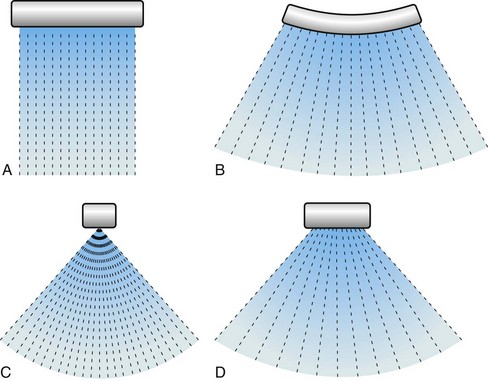
 FIGURE 78-2
The above-described image formation results in the conventional B-mode image, in which strong reflectors are depicted by white pixels, and weak reflectors are depicted as darker shades of gray. In B-mode images, blood appears dark and is considered anechoic mainly because the scatterers in the blood, predominantly red blood cells, are very small and have very low back-scattering coefficients. Vascular ultrasonography makes use of different techniques that enhance signals coming from the bloodstream to be able to image blood flow. First and most widely used of these is Doppler ultrasonography.2–5 In the Doppler technique, the signals coming from moving scatterers are enhanced, whereas stationary echoes are suppressed, which effectively displays blood flow information.
A more recently developed modality used for blood flow imaging is B-flow.6 The appearance of B-flow images is similar to that of B-mode images, and this technique overcomes some of the pitfalls of Doppler ultrasonography. A third modality used for blood flow imaging is contrast-enhanced harmonic imaging. In this modality, contrast agents, which are essentially gas-filled bubbles, are injected into the bloodstream. Contrast agents boost the echogenicity of the blood, and are used to enhance the signal coming from the blood in Doppler ultrasonography and B-flow imaging.
Doppler Ultrasonography
The Doppler effect, named after the Austrian mathematician and physicist Christian A. Doppler (1803-1853) who first hypothesized it, simply states that for a stationary observer, the apparent frequency of a wave emitted from a moving source changes proportional to the relative velocity of the source with respect to the observer (Fig. 78-3 is a conceptual drawing of wave fronts generated by a moving source). In simple terms, relative velocity is the rate of change of the distance between the source and the observer. In that sense, it could be the observer that is moving. The Doppler frequency shift solely depends on the relative velocity regardless of who or what is moving.
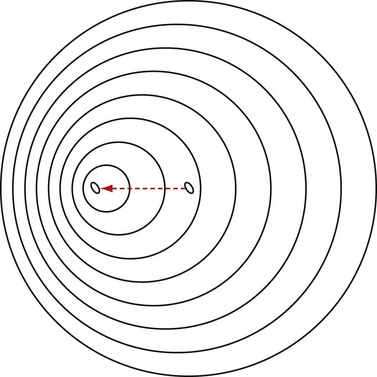
 FIGURE 78-3
Although Doppler developed his hypothesis for light waves, he also noted that the same hypothesis applied to sound waves. The Doppler effect is observed most easily with sound waves because, in the audible range, our ears can hear and detect changes in frequency (pitch). Imagine (or rather remember) a vehicle passing by while honking, or an ambulance, fire truck, or police car with sirens blaring. The pitch of the siren is noted to change while passing by: the siren starts with a high pitch; when getting close, the pitch starts to drop; the siren attains the actual pitch right when passing by and continues to drop thereafter. Figure 78-4 shows a simulated example, in which the solid and dashed curves show the frequency spectrum of the transmitted and received signals.
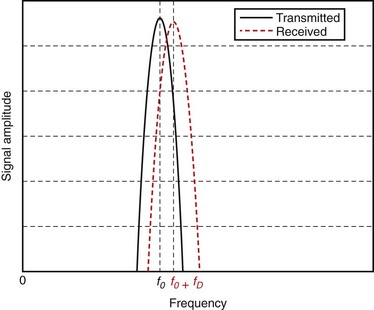
 FIGURE 78-4
In ultrasonography, the Doppler effect is applied to identify tissue motion, blood flow, and vessel structures. The simplest application of Doppler effect in ultrasonography is fetal heart rate monitoring. These devices detect the motion of the fetal heart and convert it into audible sound. More sophisticated Doppler instruments that visualize blood flow and vessel structures are now integrated into most modern ultrasound imaging systems.1
In blood flow imaging, the Doppler signal is generated by blood cells that back-scatter the transmitted ultrasound wave. The back-scattering coefficient of the cells is a quadratic function of their relative size with respect to the wavelength.2 The blood is mostly composed of red and white blood cells and water. In B-mode imaging, blood is almost anechoic because of the very small back-scattering coefficient of blood cells. The echoes coming from the surrounding tissue dominate the image. In Doppler imaging, in which the surrounding tissue is stationary, the moving blood cells generate the Doppler signal. Although white blood cells are larger, red blood cells are more numerous in the blood and generate most of the Doppler flow signal.
The Doppler frequency shift fD is formulated as:

where f0 is the frequency of the transmitted ultrasound wave, vs,r is the relative velocity of the moving target with respect to the transducer, and c is the speed of sound in tissue (on average 1540 m/s); θ is the angle of the direction of the moving target with respect to the transducer. This angle is zero when the target is moving head on toward the transducer, and it is 90 degrees when the target is moving parallel to the transducer surface. The factor 2 comes from the fact that the targets (e.g., blood cells in this case) are reflectors, and the transmitted signal is twice subjected to Doppler shift.
The Doppler signal is proportional to this frequency shift fD. The previous formula captures some of the attributes of Doppler imaging. The Doppler signal is proportional to the transmitted ultrasound frequency, so higher frequencies are preferred. Another reason for preferring higher frequencies is the back-scattering coefficient of blood cells. As mentioned previously, the back-scattering coefficient of cells is a quadratic function of the size of the cells in relation to the wavelength. Because wavelength is inversely proportional to the frequency, using higher ultrasound frequencies (shorter wavelength) increases the back-scattering coefficient significantly. Attenuation in tissue, which is an exponential function of frequency, ultimately limits the frequency and penetration depth, however. Stated in another way, for a target depth, there is always an optimal Doppler frequency dictated by these three factors. The cosine term accounts for the angular dependence of the Doppler signal. It is strongest when the blood flow is parallel to the ultrasound beam, and is zero when the blood flow is at right angles to the ultrasound beam. The Doppler signal is also proportional to the velocity of the blood cells and the number of blood cells in the sample volume interrogated by the ultrasound beam. Because the number of blood cells per unit blood volume is more or less constant, it is the spot volume of the ultrasound beam that determines the strength of the Doppler signal.3
Although we have been talking about Doppler frequency shift, in modern ultrasound systems the phase shift, not the frequency shift, is measured. Making true frequency measurements requires the system to use continuous wave ultrasound signals, which means complete loss of axial resolution for an ultrasound image. Because of this, ultrasound systems now use pulsed wave ultrasound techniques, which measure the phase shift in the received signal using a mathematical process called autocorrelation. This technique is achieved by interrogating the same sample volume multiple times (at least 3, typically 10 to 20 times), and correlating the echoes.1 Because measuring the phase shift is essentially equivalent to measuring the Doppler frequency shift within certain limitations, all the arguments we made before about Doppler frequency shift remain the same.
Continuous Wave Doppler Imaging
The continuous wave Doppler device, which continuously transmits and receives signals, requires two separate sections mounted in the ultrasound probe; one is the transmitting transducer, and the other is the receiving transducer. This is a simple process and it works well when only the magnitude of the Doppler shift frequency is required.7 It does not provide directional information about the flow, however, and does not have any axial resolution. The Doppler signal comes from a large sample volume, which is essentially the intersection of the transmit and receive beams. Vascular structures at different depths are sampled simultaneously.2 The major advantage of this system is that aliasing does not occur, and continuous wave Doppler is more sensitive to slow flow than pulsed Doppler.
Pulsed Wave Doppler Imaging
Color Doppler Imaging
Color Doppler imaging has three major limitations: aliasing, angle dependence, and low frame rate. The pulse repetition frequency (PRF) of the pulses that are used to interrogate each scan line is determined by the depth of interest. The system waits for the echoes from deepest locations to fire the next pulse. The PRF sets the maximum velocity that the system can detect without aliasing. Flows faster than the maximum velocity appear as if flowing in the opposite direction with a different velocity (faster flows are displayed under a different alias). Aliasing can be avoided only with high PRF.1,2
The Doppler shift is angle-dependent by nature. Around 90 degrees of incidence, there is no Doppler shift, and so there is no velocity information to display. Typically, these regions appear black on the screen with opposite flows on both sides. This appearance can be avoided only by looking at the same vessel from an angle so that 90 degrees of incidence is avoided.1,2
The low frame rate of color Doppler imaging is a result of the necessity to interrogate the same scan line multiple times. In contrast to B-mode images, it takes at least 3, and typically 10, times more time to generate a single scan line. The problem with low frame rate for Doppler imaging is that a significant portion of the cardiac cycle appears across the image. That is, by the time the image advances from the first scan line to the last, the body is at a different stage of the cardiac cycle. The color image is not an instantaneous snapshot of blood flow.1 There is no elegant remedy for this problem. One can only reduce the scan area and scan depth, and increase PRF to improve the frame rate.
Power Doppler Imaging
Power Doppler imaging is a flow imaging modality that has gained great popularity in the last decade. At the expense of loss of flow speed, direction, and character information, power Doppler imaging is able to display flow information free of angle dependence and aliasing effects. In simple terms, power Doppler imaging interrogates the power of the flow signal, not its speed and direction. Rather than displaying the Doppler shift spectrum in which each frequency of the spectrum corresponds to a flow speed component, it displays the integrated power of all these components. Because all the flow components are integrated, power Doppler has significantly more signal-to-noise ratio compared with color Doppler. In addition, power Doppler is not affected much by the cardiac cycle, and it is possible to use low PRF values to detect slow flow and averaging to improve signal-to-noise ratio further.1,4 With all these advantages, power Doppler is an excellent tool for imaging vessel structures and imaging small low-flow vessels.
Spectral Doppler Imaging
Spectral Doppler is an imaging modality in which Doppler shift spectrum is not lost and displayed. Because of the extent of the information, it is impossible to display the spectral information for a scan area as in color Doppler. Rather, the spectral Doppler information is displayed only for a point in the image area selected by a gate called range gate.1,3 The spectral Doppler display is a two-dimensional display with time on the x-axis and frequency on the y-axis, so that it displays the Doppler shift spectrum (corresponding to velocity components) as a function of time. Spectral Doppler displays vital information about the type of flow and is used to detect abnormal flow conditions (e.g., caused by plaque or stenoses or punctured vessels).1
B-Flow Imaging
B-flow imaging uses coded excitation to enhance the flow signal, and it equalizes the tissue signal to display tissue and flow signals simultaneously.6 There is no loss of information because of overlaying of images. In addition, coded excitation allows the use of long pulses without degrading the axial resolution, and these pulses are done close to the frame rate of the usual B-mode image.8 In all, B-flow imaging provides a precise depiction of the blood flow, vessel structures, and surrounding tissue simultaneously at the resolution and frame rate of B-mode images. Because of the ability of B-flow to scan at high frame rates, it is also used to visualize the interaction of blood flow with anatomic structures inside the vessel.6
With all the above-mentioned advantages, B-flow imaging allows the depiction of plaque characteristics even better than color Doppler and B-mode imaging, and is useful in carotid imaging. It can also be used to show small venous thrombi as a filling defect of the vessel lumen. It is useful in evaluating complex flow states, such as with bypass grafts, arteriovenous fistulas, pseudoaneurysm, and dialysis fistulas, in which color Doppler artifacts may obscure flow information.9
Contrast-Enhanced Harmonic Imaging
Aside from having a high back-scattering coefficient, ultrasound contrast agents are also known to have a highly nonlinear response.10,11 That is, when excited by an ultrasound beam, the back-scattered echo from a contrast agent contains harmonics of the transmitted signal. Because contrast agents are introduced into the bloodstream and perfuse into the vessel structure completely, contrast-enhanced harmonic imaging is a powerful tool for vascular ultrasonography, and it generated great interest in early tumor angiogenesis detection. One of the pitfalls of harmonic imaging is the harmonic signal generated by the tissue itself. Because contrast agents have a unique nonlinear response, using specific complex pulse sequences that suppress tissue harmonics and enhance contrast agent harmonics mitigates this pitfall.12
TECHNIQUE OF DOPPLER ULTRASONOGRAPHY
Contraindications
There are no contraindications of Doppler ultrasonography. However, because absorption of ultrasound energy increases the body temperature locally, there is a theoretical risk to the fetus during extended use of ultrasonography.13 In Doppler imaging, the average power sent into the body is significantly larger than typical B-mode. Especially in spectral Doppler, this power is concentrated on a small sample volume. As a rule of thumb, diagnostic Doppler ultrasonography is used in pregnancy only when a medical benefit is expected. The power output of the machine should always be checked, and minimum level of acoustic power and dwell time necessary to obtain the required diagnostic information should be used. This principle is referred as ALARA (as low as reasonably achievable).14
Technique
Choice of Probe and Frequency
The choice of the transducer depends on the clinical application and on the body habitus of the patient. Frequently, more than one transducer is used during an examination. Many factors influence the choice of frequency. The frequency determines the axial resolution and depth of the image. As the insonating frequency increases, attenuation of the ultrasound wave by the tissue increases, and penetration depth decreases. Detecting deep flow requires the use of lower frequencies. Also, low frequencies are less susceptible to aliasing and allow examination of high-velocity flow without aliasing. Sensitivity to flow increases with high frequencies because Doppler shift increases as the insonating frequency increases. Axial resolution is higher with higher frequencies.2,7 There is a compromise between axial resolution, sensitivity to flow, and depth. The highest frequency that would achieve the best resolution and highest Doppler shift with sufficient penetration should be chosen.
On the basis of this principle, examination of superficially situated vascular structures as in peripheral vasculature is performed by steered linear array transducers with frequencies of 5 MHz or greater. Curvilinear or convex probes in which insonating frequency ranges from 2.5 to 5 MHz are well suited for abdominal scanning.7,15 Trapezoid field of view convex array is a common configuration for transvaginal and transrectal applications.7
Sample Volume
In spectral Doppler, sample volume, which is also referred to as the gate size, defines the size and location of the area from which the Doppler information is obtained. Although larger sample volume results in higher signal-to-noise ratio, it may include erroneous signal arising from the adjacent vessels and from the movement of the vessel wall (Fig. 78-5).7,16 The gate size or sample volume in spectral Doppler should be kept as small as possible. A smaller sample volume also increases the frame rate and the spatial resolution. If it is kept too small, it may give the false impression of reduced or even absent flow.16
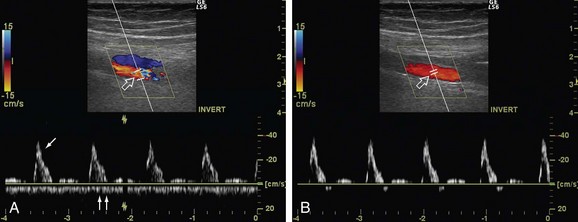
 FIGURE 78-5
Choice of Pulse Repetition Frequency/Velocity Scale
The most important factor that has an influence on PRF is the velocity of flow. As a rule of thumb, a low PRF value should be used to look at low velocities, and a high PRF value should be used to look at high velocities. Low PRF in the presence of a high-velocity flow produces aliasing (Figs. 78-6 and 78-7). High PRF reduces the sensitivity to flow, and an examination with high PRF may miss the signals from low-velocity flow (see Figs. 78-6 and 78-7).14 When searching for signals, examination should be started with the lowest PRF. When the flow signal is detected, PRF can be increased.7 Depth of the image is another factor affecting PRF. As the depth increases, it takes a longer time for the sound waves to traverse tissue, which increases the time interval between pulsing and sampling. Deeply situated flow should be examined with low PRF values. Using lower PRF values decreases the frame rate.
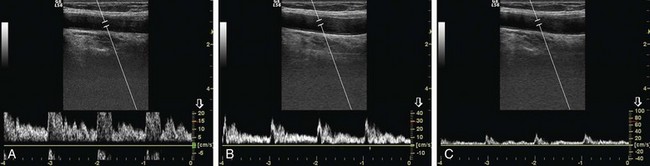
 FIGURE 78-6
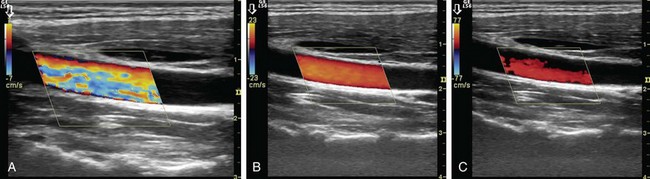
 FIGURE 78-7
Angle of Insonation and Angle of Correction
As easily understood from this equation, Doppler frequency shift is directly proportional to the cosine of the angle θ. As the transducer gets more aligned with the vessel, which means as θ gets smaller, the Doppler shift frequency increases. When the transducer is aligned with a vessel, the largest Doppler shift is obtained, but at such small angles technical difficulties occur in obtaining signal. Theoretically, Doppler shift frequency is zero, and no signal can be detected as the angle reaches 90 degrees. At angles approaching 90 degrees, directional knowledge of flow is lost, and flow appears equally above and below the zero line forming the mirror image artifact (Fig. 78-8). The ideal angle of insonation is between 30 degrees and 60 degrees.2
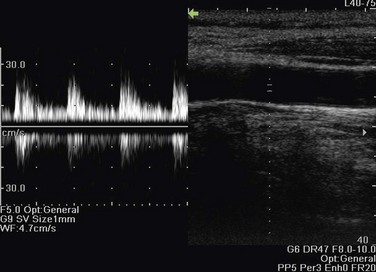
 FIGURE 78-8
Angle correction refers to adjustment of Doppler angle in spectral Doppler. It is used to calculate the velocity of flow as Doppler devices are equipped to calculate flow velocity from the Doppler frequency shift if the angle between the sound beam and the flow direction is measured and indicated to the machine by the operator. For accurate flow measurement, Doppler angle should not be greater than 60 degrees. At angles exceeding 60 degrees, small errors in angle measurement cause large errors in angle-corrected velocity computations.2,7
Power and Gain
Acoustic power generated by the Doppler device and transmitted to the tissue is an important factor affecting the sensitivity to flow. Color Doppler and spectral Doppler use higher average power than B-mode ultrasonography. Most devices allow the operator to control the power output according to the specific application. It must be set as low as possible and should be increased only if there is no other way to eliminate noise and detect a Doppler signal.7 Power output control is crucial, especially in obstetric Doppler applications.
Gain in spectral and color Doppler determines the overall sensitivity to flow. In color Doppler examinations with appropriate gain settings, color should occupy the full anteroposterior diameter of the vessel (Fig. 78-9A). The spectrum should be clearly visible and free of noise with optimal spectral gain; this can be achieved by first increasing receiver gain until noise is displayed, then after a signal is obtained, gain is reduced until noise disappears. Gain settings that are too high cause loss of directional information and produce mirror image artifact in spectral Doppler, whereas aliasing and color noise in the surrounding tissues occur in color Doppler (see Fig. 78-9B). If gain is set too low, slow flow cannot be detected (see Fig. 78-9C).15
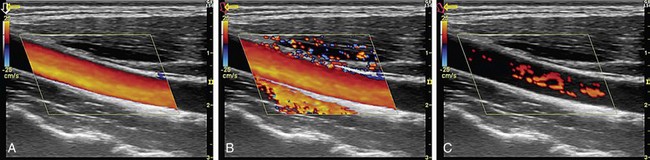
 FIGURE 78-9
High-Pass Filter
Doppler frequency shift is generated also by soft tissue motion, such as the movement of vessel wall and cardiac structures or movement owing to respiration. Such signals have higher amplitude than signals generated by blood flow and may overwhelm the signal of flow.2,17,18 Doppler equipment compensates for this effect by employing filters that cut out the high-amplitude, low-frequency Doppler signals generated by tissue movement. Because the dominant contribution to this signal is from the vessel wall movement, the filter is referred to as a wall filter. It is actually a high-pass filter. Filtering reduces the background noise and provides a clearer signal.19 Depending on the flow characteristics and desired clinical application, the operator can vary the cutoff frequency of the wall filter. A high-pass filter limits the minimum velocities that can be measured by the system, and it removes not only high-amplitude, low-frequency soft tissue components, but also slow flow components with frequency shifts below the cutoff frequency of the filter. If the filtration is set too high, diagnostic velocity information can be lost.20
Artifacts, Pitfalls, and Solutions in Doppler Ultrasonography
Artifacts in spectral and color Doppler imaging may be due to physical limitations of the modality, inappropriate equipment settings, or some anatomic factors (Table 78-1). The operator should be aware of the appearances of typical Doppler artifacts and factors that have an influence on the Doppler signal so as not to make false interpretations. The effects of inappropriate equipment settings on the obtained image are discussed in detail in the previous section. Some of the most important parameters are reviewed here.
|
Artifacts Related to Instrumentation and Settings Artifacts Related to Anatomic Factors Artifacts Unrelated to Vascular Structures and Blood Flow (Color in Nonvascular Structures) |
Aliasing
Aliasing is a fundamental limitation of pulsed wave Doppler systems. There is no such limitation in continuous wave Doppler. As mentioned earlier, the system transmits a pulse to the target and waits for the received echo to obtain a Doppler signal. The sampling frequency of the Doppler signal is referred to as PRF. The sampling frequency should provide sufficient time for the system to collect all signals from one pulse before the next pulse is generated. PRF limits the maximum Doppler shift that can be measured by the pulsed wave Doppler system. When the frequency of Doppler signal exceeds one half of the PRF (Nyquist sampling rate), this results in the ambiguity of the Doppler signal that is termed aliasing.9,20 In spectral tracing, this ambiguous signal is “wrapped around” and depicted as if flow is in the reversed direction (see Fig. 78-6A). Color aliasing projects the color of reversed flow in the central areas of higher laminar velocity (see Fig. 78-7A).20 Awareness of some technical and physical issues (Table 78-2) helps to build strategies that avoid aliasing (Table 78-3).
Wall Filter Setting
Diagnostically significant flow information, especially about low-velocity flow, may be lost if wall filter is set too high.20 When the area of investigation has a low-velocity flow pattern, no filtering or little filtering should be used. There are other system parameters such as PRF and frame rate that have an effect on filtering. In some systems, wall filter automatically increases as the PRF is increased.7,14 The processing time and Doppler sensitivity decrease as the frame rate increases; if high frame rates are used, wall filter should be reduced.
Directional Ambiguity
Directional ambiguity can result when the insonating angle is 90 degrees. It may display absence of flow in color Doppler. With linear transducers, this is a more significant problem, but beam steering can improve the angle and alleviate this problem. With sector transducers, the same artery is coded in different colors in different segments of the vessel, and a small colorless region exists at the point where the flow is perpendicular to the beam (Fig. 78-10).2,20
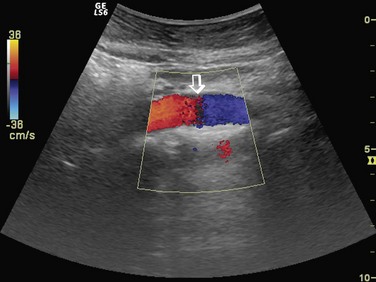
 FIGURE 78-10
Grating or Side-Lobe Artifact
Electronically focused transducers concentrate the insonating beam toward the sample volume. Because of design of the transducers, weak secondary lobes of focused sound may insonate areas unrelated to the primary beam, and if reflected echoes from these regions are strong enough, they are displayed in the image. Convex probes are more susceptible to this artifact than linear probes. These off-axis lobes can insonate vessels unrelated to Doppler sample volume, and if Doppler signal is strong enough, it can be displayed in the spectrum in regions where no Doppler signal is expected.20
Mirror Image Artifact
Mirror image artifact, which is commonly observed in B-mode imaging, can also occur in color Doppler and spectral Doppler imaging. In color Doppler imaging, it occurs in a vessel that is adjacent to a highly reflective surface, such as lung.21 The subdiaphragmatic region of the liver and supraclavicular region are also notorious for this artifact.20
In spectral Doppler, mirror image artifact is displayed as a similar time-velocity spectrum appearing below and above the zero line (see Fig. 78-8). It occurs at large angles of insonation especially when large receiver gain is used to detect weak Doppler signals.2
Flow Direction Artifact
In color Doppler imaging, flow toward and away from the transducer is encoded in different hues, so the veins and arteries are coded in different colors. The operator assigns the hue to the direction of flow. In some anatomic regions where vessels diverge, the color is not an absolute indicator of the vessel type (artery or vein) (Fig. 78-11). In such regions, the device codes arteries in red and blue. Use of spectral Doppler helps alleviate this problem.
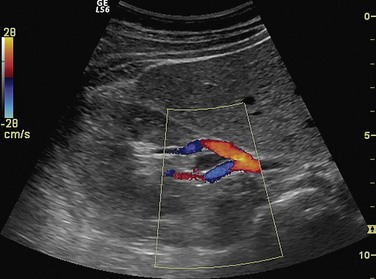
 FIGURE 78-11
Color in Nonvascular Structures and Color Modulation of Biologic Movement
In color flow devices, any motion of a reflector relative to the transducer produces a Doppler shift and is modulated into color by the device. An artifactual impression of flow is produced and is referred to as the color flash artifact.2,20,22 To compensate for this problem, most color flow devices are equipped with motion discriminators that separate true flow from random motion of soft tissues.
Low level signals arising from hypoechoic areas such as cysts and collections do not trigger the motion discriminators, and color flash artifacts occur in such regions.20 Artificial color signals may be observed in dilated bile ducts and gallbladder, especially if the color sensitivity settings are high.23 Transient color flash artifact may also occur because of patient motion (e.g., respiration, cardiac pulsations, and bowel movement) or transducer motion.
Pseudoflow artifact, which is closely related to color flash artifact, occurs secondary to fluid motion. This artifact may be caused by motion of ascites or urine. Spectral analysis of these regions helps to differentiate color flash or pseudoflow artifact from real blood flow because it reveals a spectrum that is very atypical for a vessel.22
Twinkle Artifacts
Strongly reflective granular interfaces, such as urinary tract stones or parenchymal calcifications, cause twinkle artifacts, which appear as rapidly fluctuating mixtures of red and blue pixels imitating turbulent flow.22 Discrimination of this artifact from a real turbulent flow is easy because spectral imaging reveals no flow, and spectrum is flat.
Image Interpretation
The image generated by spectral Doppler technique is known as the Doppler spectrum (Fig. 78-12). This is a graph that displays different Doppler shift frequencies present in the sample volume over a short time.9 Three characteristics of the signal—frequency, amplitude, and time—are displayed on the spectrum.
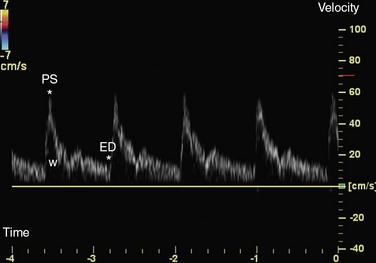
 FIGURE 78-12
Blood flow in arteries has a laminar pattern in which blood in the center of the vessel has a higher speed than blood at the periphery. In this pattern, most of the blood cells has a uniform speed. In spectral Doppler, laminar flow pattern is displayed as a thin line outlining a clear space referred as the spectral window.9 Turbulent flow, which is usually observed in pathologic conditions, may be shown in normal arteries in some situations (Table 79-4). Each cardiac cycle induces cyclic changes in arterial flow and causes variations in the velocity ranges during systole and diastole. Arteries have a distinct waveform that begins with systole and ends at the end of diastole. The shape of this wave reveals information about a crucial flow property of arteries, the pulsatility (Fig. 78-13).
|
Decrease in vessel diameter (stenosis), increase in flow velocity (arteriovenous shunt), and decreased blood viscosity are causes
|
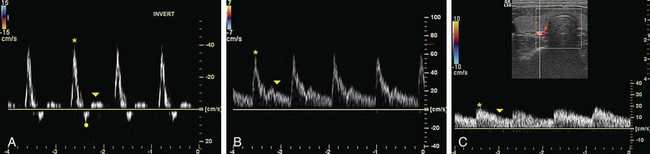
 FIGURE 78-13
Venous flow is slower than arterial flow, and its detection requires low PRF and low wall filtering. Venous flow is continuous, but respiratory and cardiac modulations can be observed in flow, especially in the central veins. The respiratory modulation appears as enhancement of velocities during expiration in the subdiaphragmatic territory veins. This phenomenon exists in the supradiaphragmatic territory during inspiration. Cardiac modulation is observed in the abdominal veins that are located close to the heart, such as the inferior vena cava and hepatic veins; this appears as a short reversal of flow during diastole.24
Arterial Stenosis
Spectral Doppler Changes
The flow velocity and acceleration are highest at the site of maximum stenosis. Commonly used stenotic zone velocities are peak systolic velocity (PSV) and end-diastolic velocity (EDV). PSV is the first Doppler parameter that becomes abnormal in the stenotic zone, whereas EDV remains normal with less than 50% diameter narrowing. Systolic velocity ratio (PSV in the stenotic zone/PSV in the normal zone proximal to the stenosis) is another important parameter of arterial stenosis and compensates for patient-to-patient hemodynamic variabilities.9
In the poststenotic region, flow is disorganized, and turbulent flow with negative frequencies predominating in systole is observed. The resistance to flow increases in the prestenotic region where high-resistance flow pattern is observed. In the region distal to the stenosis, flow resistance decreases, and pulsus parvus et tardus is observed with rounded systolic peak, reduced PSV, slower acceleration, and increased diastolic flow.24
Color Doppler Changes
There is a localized aliasing in the region of stenosis where the reduction in caliber can also be visually observed. Reverse flow with color inversion is observed in the immediate poststenotic zone. When narrowing is severe, turbulence in the poststenotic zone becomes so high that an artifact caused by the wall vibrations arises in the perivascular soft tissues. This artifact is displayed as a random color map.9,25
Aneurysm and Pseudoaneurysm
Velocities decrease in the aneurysmatic region because of an increase in the vessel diameter. The spectrum is dampened, and color encoding is poor inside the lumen. A helical flow is displayed as a multiphasic spectrum and a mixture of red and blue color. Pseudoaneurysms have a communication with the arterial lumen via a narrow neck in which a to-and-fro flow pattern is observed.24
Postprocessing
Doppler Indices
Further analysis of the spectrum and calculating some indices help to describe the complex waveform in a simple way and to evaluate organ blood flow. Commonly used indices available on most scanners are resistive index, systolic/diastolic ratio, and pulsatility index (see Table 78-5 for calculations). The major advantage of these indices is that they are independent of the transmit frequency and Doppler angle.
A, peak systolic frequency; B, end-diastolic frequency.
Acceleration Time and Acceleration Index
Acceleration time and acceleration index are also important parameters obtained from the Doppler spectrum. They quantify the flow.9 In systole, the flow velocity accelerates very rapidly in the arteries, and the time needed to reach the maximum systolic velocity is referred as the acceleration time.
Volume Blood Flow Measurement
Quantification of flow volume is possible with color Doppler and duplex Doppler instruments. Different techniques are used to calculate flow volume, but it is simply calculated by multiplying luminal area with the mean velocity. This calculation is done automatically by the ultrasound machine. Measurement of flow volume is fraught with difficulties even under ideal conditions. Errors may arise because of many factors, including shape of the vessel, inaccurate estimation of the mean velocity, and variation in the vessel diameter (e.g., artery diameters are smaller during systole).2 Volume flow measurements have found surprisingly little use in a clinical setting. Parameters such as pulsatility index seem to be more helpful in defining many physiologic and pathologic conditions.2,9 Increased resistance to flow may increase cardiac contractility, and flow may be maintained until late in the disease.


Campbell SC, Cullinan JA, Rubens DJ. Slow flow or no flow? Color and power Doppler US pitfalls in the abdomen and pelvis. RadioGraphics. 2004;24:497-506.
Grenier N, Basseau F, Rey MC, et al. Interpretation of Doppler signals. Eur Radiol. 2001;11:1295-1307.
Nelson TR, Pretorius DH. The Doppler signal: Where does it come from and what does it mean? AJR Am J Roentgenol. 1988;51:439-447.
Pozniak MA, Zagzebski JA, Scanlan KA. Spectral and color Doppler artifacts. RadioGraphics. 1992;12:35-44.
Scoutt LM, Zawin ML, Taylor KJW, et al. Doppler US, part II: clinical applications. Radiology. 1990;174:309-319.
Taylor JWK, Holland S. Doppler US, part I: basic principles, instrumentation, and pitfalls. Radiology. 1990;174:297-307.
Teh J. Applications of Doppler imaging in the musculoskeletal system. Curr Probl Diagn Radiol. 2005;35:22-34.
Wells PN. Ultrasound in vascular pathologies. Eur Radiol. 1998;8:849-857.
1 Frederick WK. Diagnostic Ultrasound, Principles and Instruments. Philadelphia: Saunders; 2006.
2 Taylor KJW, Holland S. Doppler US, part I: basic principles, instrumentation, and pitfalls. Radiology. 1990;174:297-307.
3 Nelson TR, Pretorius DH. The Doppler signal: where does it come from and what does it mean? AJR Am J Roentgenol. 1988;51:439-447.
4 Martinoli C, Derchi LE, Rizzatto G, et al. Power Doppler sonography: general principles, clinical applications, and future prospects. Eur Radiol. 1998;8:1224-1235.
5 William JZ, Pellerito JS. Introduction to Vascular Ultrasonography. Philadelphia: Saunders; 2004.
6 Chiao RY, Mo LY, Hall AL, et al B-mode blood flow imaging. IEE Ultrasonics Symposium. 2000, 1469-1472.
7 Burns PN. Interpreting and analysing the Doppler examination. In: Taylor JW, Burns PN, Wells PNT, editors. Clinical Applications of Doppler Ultrasound. Philadelphia: Lippincott-Raven; 1995:55-98.
8 O’Donnell M. Coded excitation system for improving the penetration of real-time phased-array imaging systems. IEEE Trans Ultrason Ferroelectr Freq Control. 1992;39:341-351.
9 Zweibel WJ, Pellerito JS. Basic concepts of Doppler frequency spectrum analysis and blood flow imaging. In: Zweibel WJ, Pellerio JS, editors. Introduction to Vascular Ultrasonography. Philadelphia: Saunders; 2005:61-89.
10 Simpson DH, Burns PN, Averkiou MA. Techniques for perfusion imaging with microbubble contrast agents. IEEE Trans Ultrason Ferroelectr Freq Control. 2001;48:1483-1494.
11 Chang PH, Shung KK, Wu SJ, et al. Second harmonic imaging and harmonic Doppler measurements with Albunex. IEEE Trans Ultrason Ferroelectr Freq Control. 1995;42:1020-1027.
12 Hope-Simpson D, Chin C, Burns P. Pulse inversion Doppler: a new method for detecting non-linear echoes from microbubble contrast agent. IEEE Trans Ultrason Ferroelectr Freq Control. 1999;46:372-382.
13 Scoutt LM, Zawin ML, Taylor KJW, et al. Doppler US, part II: clinical applications. Radiology. 1990;174:309-319.
14 Maulik D. Biological safety of diagnostic sonography. In: Maulik D, editor. Doppler Ultrasound in Obstetrics and Gynecology. Berlin: Springer-Verlag; 2005:95-111.
15 Foley WD, Erickson SJ. Color Doppler flow imaging. AJR Am J Roentgenol. 1991;156:3-13.
16 Kruskal JB, Newman PA, Sammons LG, et al. Optimizing Doppler and color flow US: application to hepatic sonography. RadioGraphics. 2004;24:657-675.
17 Rubin JM. Spectral Doppler US. RadioGraphics. 1994;14:139-150.
18 Powis RL. Color flow imaging. RadioGraphics. 1994;14:415-428.
19 Teh J. Applications of Doppler imaging in the musculoskeletal system. Curr Probl Diagn Radiol. 2006;35:22-34.
20 Pozniak MA, Zagzebski JA, Scanlan KA. Spectral and color Doppler artifacts. RadioGraphics. 1992;12:35-44.
21 Middletoon WD, Melson GL. The carotid ghost: a color Doppler ultrasound duplication artifact. J Ultrasound Med. 1990;9:487-493.
22 Campbell SC, Cullinan JA, Rubens DJ. Slow flow or no flow? Color and power Doppler US pitfalls in the abdomen and pelvis. RadioGraphics. 2004;24:497-506.
23 Mitchell DG, Burns P, Neddleman L. Color Doppler artifacts in anechoic regions. J Ultrasound Med. 1990;9:255-260.
24 Grenier N, Basseau F, Rey MC, et al. Interpretation of Doppler signals. Eur Radiol. 2001;11:1295-1307.
25 Mitchell DG. Color Doppler imaging: principles, limitations and artifacts. Radiology. 1990;177:1-10.
26 Pourcelot L. Applications clinique de lexamen Doppler transcutane. In: Peronneau P, editor. Velocitmetric Ultrasonor Doppler, 34. Inserm; 1974:213-240.
27 Gosling RG. Extraction of physiological information from spectrum analyzed Doppler-shifted continuous wave ultrasound signals obtained noninvasively from the arterial tree. In: Hill DW, Watson BW, editors. I.E.E. Medical Electronic Monographs, 13-22. London: Peter Peregrinus; 1976:73-125.
28 Stuart B, Drumm J, Fitzgerald DE, et al. Fetal blood velocity waveforms in normal pregnancy. Br J Obstet Gynaecol. 1980;876:780-785.
