Vascular Pressure Monitoring

Published on 12/06/2015 by admin

Filed under Pulmolory and Respiratory

Last modified 12/06/2015

Print this page

rate 1 star rate 2 star rate 3 star rate 4 star rate 5 star
Your rating: none, Average: 2.9 (35 votes)

This article have been viewed 13422 times

Vascular Pressure Monitoring

Kenneth Miller and Craig L. Scanlan

Learning Objectives

After reading this chapter, you will be able to:

1. Describe the following regarding arterial cannulation:

a. Indications for placing an A line

b. Common insertion sites

c. Monitoring equipment set-up

d. Procedure for placement of the catheter

e. Interpretation of arterial pressure waveforms

f. Pressures measured and their interpretation

g. Potential complications

2. Describe the following regarding central venous pressure (CVP) monitoring:

a. Indications for placing a CVP catheter

b. Catheter description and insertion sites

c. Procedure for placement of the catheter

d. Interpretation of the CVP waveform

e. Interpretation of pressures measured

f. Relationship of CVP to left and right ventricular function

g. Potential complications

3. Describe the following regarding pulmonary artery pressure monitoring:

a. Indications for placing a pulmonary artery catheter

b. Catheter description and insertion sites

c. Procedure for placement of the catheter

d. Interpretation of pulmonary artery waveforms

e. Interpretation of pressures measured

f. Relationship between pulmonary artery diastolic pressure and pulmonary artery wedge pressure (PAWP)

g. Techniques for obtaining an accurate PAWP reading

h. Relationship between transmural pressure and PAWP

i. Effect of positive end-expiratory pressure on PAWP measurements

j. Potential complications of using the pulmonary artery catheter

4. Outline the key interventions recommended to minimize central line–associated bloodstream infections (the central line bundle)

Hemodynamic monitoring often plays an important role in the assessment and treatment of critically ill patients. It is performed to evaluate intravascular fluid volume by measuring central venous pressure (CVP); cardiac function by measuring arterial blood pressure, pulmonary artery wedge pressure (PAWP), and cardiac output (CO); and vascular function by measuring systemic and pulmonary vascular resistance. Ideally, the information will be easily obtained, continuously available, and reliable, and the process of obtaining the information will not harm the patient.

Invasive hemodynamic monitoring is needed because basic clinical assessments such as evaluating jugular venous distention or heart sounds alone may not accurately reflect patients’ hemodynamic status. Before a catheter is placed in a patient, however, clinicians must consider the risk-to-benefit ratio of invasive monitoring. The risk for invasive hemodynamic monitoring is minimized when properly trained clinicians insert and maintain the system. The complications associated with placing a catheter in a major blood vessel are detailed throughout this chapter.

Bedside monitors acquire and calculate physiologic data in real time and often transfer the data automatically to computers for trend analysis. However, monitors may not always provide accurate information. Therefore, optimal invasive monitoring requires not only knowledge of the procedural complications and use of the information but also understanding and control of the factors affecting the validity of the data. Therapeutic decision making based on the numbers alone is never adequate and can be dangerous.

This chapter provides an introduction to the hemodynamic pressures most often monitored invasively in critically ill patients: arterial pressure, CVP, and pulmonary artery pressures (Box 15-1). Indications and complications of invasive monitoring, normal and abnormal pressure waveforms, and clinical applications are discussed.

Box 15-1   The Heart as Two Pumps: An Overview of Hemodynamic Pressure Relationships

When discussing hemodynamic parameters, it is necessary to think of the heart as two separate pumps. The right heart receives blood from the venous system (venous return) and pumps blood to the pulmonary system. The left heart receives blood from the pulmonary system and pumps blood to the systemic circulation. In normal states, both hearts pump at the same time and move the same amount of blood.

Both atria are filling chambers for the ventricles. Their pressures are about equal, and they have the same waveform. When the atrioventricular valves open (tricuspid and mitral), the pressures in the atrium and ventricle are equal; therefore, atrial pressure usually reflects the ventricle’s filling pressure (end-diastolic pressure).

Both ventricles pump blood into arterial systems and create two waveforms: ventricular and arterial. Their waveforms have the same shape characteristics, but their pressures are significantly different. The right heart pumps to a low-resistance circuit, the lungs, and thus produces a lower pressure. The left heart pumps to a high-pressure circuit, the body, so it has to produce a high pressure.

Alterations in blood flow and resistance to flow are reflected backward through the cardiopulmonary circuit as pressure changes. Pulmonary hypertension causes pressure to increase in the right heart and eventually the venous system.

< ?xml:namespace prefix = "mml" />Lung pressurePAPCVPVenous congestion

image

A failing left ventricle will cause blood to “dam up” in the left heart, then the lungs, and eventually alters the entire circuit.

LAPPAWPPAPCVPVenous congestion

image

The following simple diagram illustrates the dynamic relationship between the two hearts and shows where pressures are measured. Marking a patient’s pressure changes helps clarify where there is and is not a problem (e.g., increased PAWP with normal PAP and CVP indicates a left heart problem that has not altered the lungs or right heart).

image

AV, arteriovenous; BP, blood pressure; CVP, central venous pressure; LA, left atrium; LAP, left atrial pressure; LV, left ventricle; PAP, pulmonary artery pressure; PAWP, pulmonary artery wedge pressure; RA, right atrium; RV, right ventricle; vertical bars indicate heart valves.

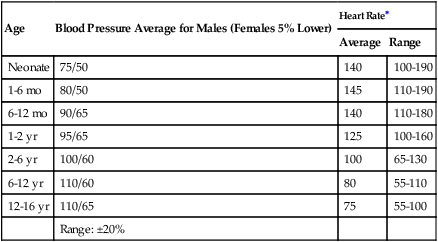
Table 15-1 summarizes the common reference ranges and the abbreviations for the pressures discussed in this chapter. Although intracardiac pressures are essentially the same in adults and children, heart rate and blood pressure vary significantly by age. Table 15-2 lists the common reference ranges for heart rate and blood pressure for children from infancy through 16 years of age. Remember that reference ranges are obtained from studies on healthy people and may be neither normal nor desirable for a specific patient. Nevertheless, knowledge of these reference ranges is essential in the interpretation and application of hemodynamic data.

TABLE 15-1

Reference Ranges for Hemodynamic Pressures

Pressure Abbreviation Normal Value (mm Hg)
Arterial pressure BP Systolic 100-140
Diastolic 60-90
120/80 (90/60 in teenage girls)
Mean arterial pressure MAP 70-105
Central venous pressure CVP 2-6 (mean)
Right atrial pressure RAP 2-6 (mean)
Right ventricular pressure RVP Systolic 15-30
Diastolic 2-8
Right ventricular end-diastolic pressure RVEDP 2-6
Pulmonary artery pressure PAP Systolic 15-30
Diastolic 8-15
Mean pulmonary artery pressure MPAP or PAP 9-18
Pulmonary artery wedge pressure PAWP, PCWP, PAOP 6-12
Left atrial pressure LAP 4-12
Left ventricular pressure LVP Systolic 100-140
Diastolic 0-5
Left ventricular end-diastolic pressure LVEDP 5-12

TABLE 15-2

Reference Ranges for Heart Rate and Blood Pressure in Children

Age Blood Pressure Average for Males (Females 5% Lower) Heart Rate
Average Range
Neonate 75/50 140 100-190
1-6 mo 80/50 145 110-190
6-12 mo 90/65 140 110-180
1-2 yr 95/65 125 100-160
2-6 yr 100/60 100 65-130
6-12 yr 110/60 80 55-110
12-16 yr 110/65 75 55-100
  Range: ±20%    

image

Heart rates rounded to nearest 5.

Data from Rubenstein JS, Hageman JR: Monitoring of critically ill infants and children. Crit Care Clin 4:621, 1988.

Arterial Pressure Monitoring

Indications for Arterial Pressure Monitoring

The attending physician may place or order placement of an arterial catheter into a patient with significant hemodynamic instability or a patient who will require frequent arterial blood sampling. Patients with severe hypotension (shock), severe hypertension, or unstable respiratory failure (acute respiratory distress syndrome [ARDS]) are likely candidates to have continuous arterial pressure monitoring. Patients in need of medications that affect blood pressure (e.g., vasodilators or inotropic agents) may benefit from arterial pressure monitoring.

Equipment Set-Up

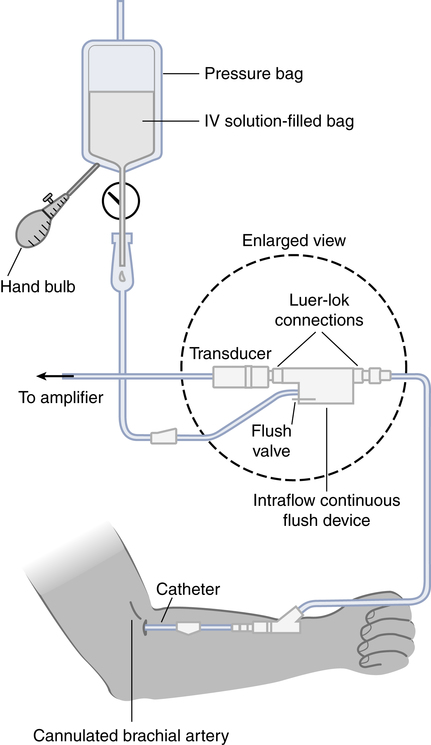
Figure 15-1 shows the basic equipment used for an indwelling vascular line, in this case a brachial artery catheter. Once inserted, the catheter connects to a disposable continuous flush device by low-compliance tubing. The flush device keeps the line open by providing a continuous low flow of fluid (2 to 4 mL/hour) through the system. To maintain continuous flow, the intravenous bag supplying these systems must be pressurized, usually by a hand bulb pump. A pressure transducer, connected to the flush device, provides an electrical signal to an amplifier or monitor, which displays the corresponding pressure waveform. A sampling port (not shown) typically is included to allow blood withdrawal. CVP and pulmonary artery monitoring systems use the same basic set-up.

Procedure for Inserting an Arterial Line

Box 15-2 outlines the key procedural steps for inserting a radial artery line. Note that if the Allen test for collateral circulation is negative, the opposite wrist should be assessed. If collateral circulation cannot be confirmed on either side, the brachial site typically is used.

Box 15-2   Key Elements in Arterial Line Insertion Procedure

• Ensure that a “time out” is performed before the procedure.

• Obtain patient written consent if required (some institutions).

• Ensure that monitoring system is set up and calibrated, with lines properly flushed.

• Restrain arm with the wrist dorsiflexed using an armboard or towel.

• Assess adequacy of ulnar collateral blood flow by Allen test.

• Decontaminate hands and don personal protection equipment (use sterile gloves).

• Scrub the insertion area using chlorhexidine (30 seconds) and allow to dry.

• Drape the area per proper aseptic technique.

• Apply local anesthetic agent (as needed).

• Locate pulsating artery by palpation.

• Puncture skin at 30-degree angle, with needle bevel and hub arrow up.

• Advance catheter into position (direct cannulation or Seldinger technique).

• Connect catheter system to transducer tubing and flush.

• Confirm proper arterial waveform on monitor (neither overdampened or underdampened).

• Reposition catheter if waveform is inadequate or dampened.

• Cleanse area, apply benzoin, and let dry.

• Secure line to prevent traction on catheter.

• Cover line insertion point with clear sterile dressing.

• Dispose of infectious waste and sharps and decontaminates hands.

• Recheck for adequacy of distal blood flow and patient comfort.

• Instruct patient on line use and safety considerations.

• Record pertinent data in chart and departmental records.

There are two common arterial line insertion methods: direct cannulation and the guidewire (Seldinger) technique. The direct cannulation method uses a puncture needle sheathed with the catheter. Using this approach, once a flash of blood is observed in the needle hub, the catheter sheath is advanced over the needle into the artery, and the needle is then removed.

With the Seldinger technique, a needle is used to penetrate the artery, with a soft-tipped guidewire then threaded through the needle into the vessel. Next, the needle is removed, leaving the guidewire in place. Finally, the indwelling catheter is advanced over the guidewire into position, and the guidewire is removed.

Arterial Pressure Waveforms

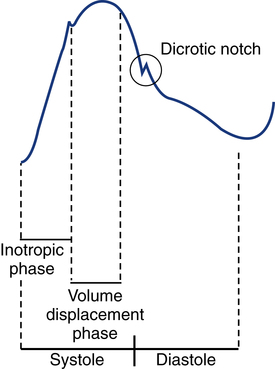
An arterial pressure waveform should have a clear upstroke on the left, with a dicrotic notch representing aortic valve closure on the downstroke to the right (Fig. 15-2). If the dicrotic notch is not visible, the pressure tracing is dampened and probably inaccurate, and the measured pressures likely lower than the patient’s actual values. The dicrotic notch disappears in some patients when the systolic pressure drops below 50 or 60 mm Hg.

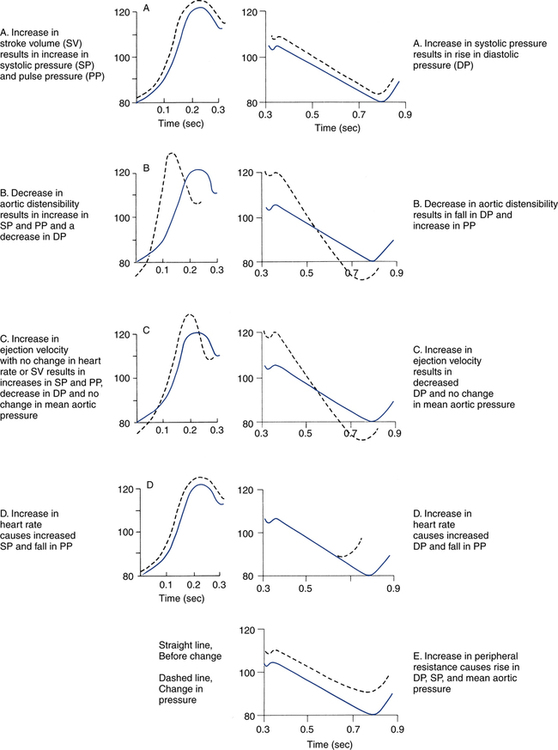
Arterial pressure waves take on many different configurations (Fig. 15-3). The left side of the pressure wave may become straight and even pointed on the top when there is an increase in circulating catecholamines that increase cardiac contractility (a positive inotropic response). A tall, narrow pressure wave is also seen in patients with a stiff aorta due to arteriosclerotic vascular disease. In these patients, the diastolic pressure may also fall, producing an exaggerated tall and narrow complex. Increases in heart rate and vascular resistance increase diastolic pressure. On the other hand, vasodilation decreases vascular resistance and can cause a fall in diastolic pressures. Because approximately 70% of coronary artery perfusion occurs during diastole, coronary artery perfusion may be compromised if the diastolic pressure falls below 50 mm Hg.

Respiratory Variations

Respiratory variations in the arterial pressure waveform normally go unnoticed because arterial pressures are substantially higher than intrathoracic pressure changes during breathing. Also, the monitor scale usually is set to a pressure range of 0 to 300 mm Hg, making changes of 10 mm Hg barely visible. When respiratory variations in the arterial pressure waveform are seen, the possibility of cardiac tamponade or other causes of paradoxical pulse must be considered (see Chapter 4). Increases in arterial pressure during inspiration (reverse pulsus paradoxus) are seen after heart surgery and in patients with left ventricular failure who are mechanically ventilated with techniques that produce high mean airway pressures, such as positive end-expiratory pressure (PEEP). Dysrhythmias and pulsus alternans also cause variations in the height and shapes of the arterial pressure waveform.

Interpretation of Arterial Pressure Measurements

Normal arterial pressure in the adult is approximately 120/80 mm Hg and increases gradually with age. Systolic pressures greater than 140 and diastolic pressures greater than 90 are considered hypertensive (see Chapter 4 for the current classification of hypertension). A pressure below 90/60 mm Hg in adults is termed hypotension.

Although arterial pressure is one of the most frequently monitored vital signs, it reflects only the general circulatory status. Pressure is the product of flow and resistance. Because neurovascular compensatory mechanisms can maintain blood pressure by vasoconstriction while flow is decreasing, low blood pressure is a late sign of hypovolemia or impaired cardiac function. Earlier evidence of decreased blood volume or CO includes cold, clammy extremities caused by catecholamine-mediated peripheral vasoconstriction.

Arterial pressure decreases in the following circumstances:

Diastolic pressure must be watched carefully during the administration of vasodilators such as sodium nitroprusside, which may reduce diastolic pressure more rapidly than systolic or mean pressure. Diastolic pressure less than 50 mm Hg and mean pressure less than 60 mm Hg in an adult may result in compromised coronary perfusion.

Arterial pressure increases with the following:

Administration of inotropic agents may or may not increase blood pressure. If a positive inotropic drug stimulates the heart under conditions of inadequate myocardial oxygenation or hypovolemia, the pressure may fall. Additionally, if the inotropic agent also causes vasodilation, the pressure may stay the same or fall as the medication is increased. In addition to systolic and diastolic blood pressure, arterial pressure monitoring allows assessment of pulse and mean arterial pressure.

The pulse pressure is the difference between the systolic and diastolic pressure. Normal pulse pressure is 30 to 40 mm Hg and is a reflection of left ventricular stroke volume (SV) and arterial system compliance. A decreasing pulse pressure is a sign of low SV. An increasing SV in a patient receiving fluid therapy is consistent with improved preload.

Mean arterial pressure (MAP) is an average of pressures in the systemic circulation and thus the pressure best associated with the adequacy of tissue perfusion. The normal reference range for MAP is 70 to 105 mm Hg. MAP is not an arithmetic average of systolic and diastolic pressures because the cardiac cycle spends about twice as long in diastole as in systole when the heart rate is normal. Most monitors compute MAP and display it digitally. MAP can be estimated mathematically by either of the following formulas:

MAP=1/3 Pulse pressure+Diastolic pressure

image

or

MAP=Systolic pressure+(diastolic pressure × 2)3

image

Circulation to the vital organs (i.e., kidneys, coronary arteries, and brain) may be compromised when MAP falls below 60 mm Hg. In such cases, the patient may need fluid therapy or medications to increase left ventricular contractility (inotropics) or to increase vascular resistance. Elevated MAP is associated with increased risk for stroke and heart failure. Pharmacologic treatment of elevated MAP may include vasodilators or negative inotropic agents. MAP is used in calculating derived hemodynamic variables such as systemic vascular resistance, left ventricular stroke work, and cardiac work (see Chapter 16).

Complications Associated with Arterial Lines

Ischemia

Ischemia resulting from embolism, thrombus, or arterial spasm is the major complication of direct arterial monitoring. It is evidenced by pallor distal to the insertion site and usually is accompanied by pain and paresthesia (numbness and tingling). Ischemia can proceed to tissue necrosis if the catheter is not repositioned or removed. Thrombosis is prevented by irrigation with diluted heparinized solution. Bolus irrigation is done in very small amounts because flushing the line can result in retrograde flow and cerebral embolization.

Infection

As with all invasive lines, the presence of an arterial catheter increases the risk for infection. The incidence of infection increases over time and is directly related to the care of the lines and transducers; frequency of dressing, tubing, and solution change; to-and-fro motion of the catheter; and altered host defenses. Fever in any patient with invasive lines must trigger questions about the necessity of the lines and their role as a cause of the infection process. More detail on preventing catheter-associated infections is provided later in this chapter.

Central Venous Pressure Monitoring

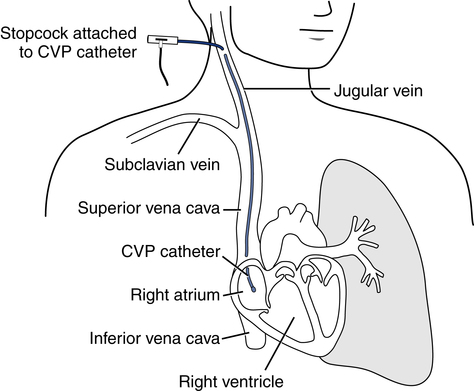
Central venous pressure (CVP) is the pressure of the blood in the right atrium or vena cava, where the blood is returned to the heart from the venous system. Because the tricuspid valve is opened between the right atrium and ventricle during diastole (ventricular filling), CVP also represents the end-diastolic pressure in the right ventricle (RVEDP) and reflects right ventricular preload (filling volume). To obtain a CVP measurement, a venous catheter is placed in a major vein (see the later section on insertion).

Indications for CVP Monitoring

CVP monitoring is indicated to assess the circulating blood volume (adequacy of cardiac filling), adequacy of venous return, or right ventricular function. Patients who have had major surgery or blood loss caused by trauma and those suspected of severe dehydration may benefit from placement of a CVP catheter to guide fluid replacement therapy. Patients with either cardiogenic or noncardiogenic pulmonary edema also need CVP monitoring to guide fluid therapy. In addition, CVP measurements are useful in evaluating patients suspected of having right ventricular damage due to myocardial infarction. Once the catheter is in place, the line can be used for rapid infusion of fluids or medications and to obtain blood samples for measurement of routine laboratory studies (e.g., complete blood counts and electrolytes).

CVP Catheters and Insertion Sites

The most common central venous catheters are 7-French, triple-lumen catheters with one distal port and two ports 3 to 4 cm from the distal end of the catheter (Fig. 15-4). The multiple-lumen catheter allows infusion of blood and various medications and solutions through different ports and permits aspiration of blood samples or injections for CO measurements without interrupting the infusion of medication. Catheters with walls that are impregnated with antibiotics are less commonly associated with infection than standard catheters.

Common sites for introduction of central venous catheters include the subclavian and internal jugular veins (Fig. 15-5). An advantage of the subclavian vein approach is that it results in a much more stable catheter after placement. Disadvantages of the subclavian vein approach are that it is technically more difficult because the vein is harder to find and the catheter guidewire does not follow the subclavian vein as easily as it turns to form the superior vena cava. The subclavian vein is close to the subclavian artery, which is easily punctured, and the mediastinum can hold a fair amount of blood without external evidence of blood loss. The pleural surface is not far below the vein, so pneumothorax is a potential complication of the procedure.

The internal jugular vein approach is easier because there is nearly a straight shot for the guidewire to reach the superior vena cava and less risk for pneumothorax, and hematomas are easier to see and control. Disadvantages of the internal jugular vein approach are that the catheter is much less stable after placement and is subject to kinking, breakage, and accidental removal.

A chest radiograph should be performed after central venous line insertion to ensure proper placement and to rule out pneumothorax.

Procedure for Inserting a CVP Catheter

Central venous line kits commonly include a needle for venous penetration, a stiff plastic dilator, and a guidewire coiled in a plastic sheath with a “J” tip to prevent venous wall penetration. The J tip is held straight by a small separate sheath to accommodate entry into the hub of the insertion needle.

The technique is nearly identical for subclavian and internal jugular line insertions. Normally, the head of the patient’s bed is lowered, which increases venous pressure and causes the vein to swell, making it easier to penetrate and thread the guidewire. This also decreases the risk for inadvertent air embolism. The subclavian vein is entered from an insertion site at the edge of the distal third of the clavicle. The internal jugular vein can be entered from the head of the clavicle or a site behind the brachial artery.

The catheter lumens are flushed with heparinized saline, and the cap is removed from the lumen with the distal port. The guidewire is inserted and threaded, and the needle withdrawn. A dilator is inserted over the guidewire and removed, and the distal port of the CVP catheter is threaded onto the guidewire. It is advanced to a depth that should leave the tip in the superior vena cava. The guidewire is then removed, the hub replaced, the port flushed with heparinized saline, and the catheter secured in position. A chest radiograph typically is taken after insertion to verify the tip of the catheter is in the superior vena cava just above the right atrium.

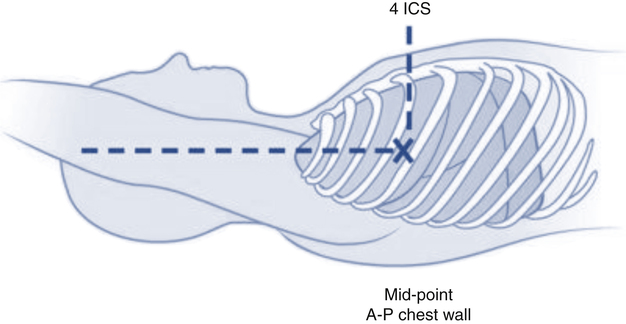
Once inserted and secured, the CVP catheter is attached to a flushed and calibrated monitoring system like that used for pressure measurement through an arterial line (see Fig. 15-1). However, because central venous pressures typically are much lower than arterial pressures, two key differences in the procedure are required. First, the monitor scale for CVP measurement should be set to the low range, typically 0 to 30 mm Hg. Second, to assure accuracy in measurement and interpretation, the pressure transducer must be placed level with the patient’s right atrium, identified externally at the phlebostatic axis. As indicated in Figure 15-6, the phlebostatic axis is located at the intersection of the fourth intercostal space and midaxillary line. Positioning of the transducer below the phlebostatic axis will result in erroneously high CVP readings, whereas positioning the transducer above this level will cause the reading to be lower than the patient’s actual value.

Central Venous and Atrial Pressure Waveforms

The CVP waveform reflects pressure changes in the right atrium and normally consists of three waves for each cardiac cycle: a, c, and v (Fig. 15-7).

The a wave results from atrial contraction and occurs during ventricular diastole. When there is no atrial contraction (atrial fibrillation), there is no a wave. Conversely, when the atrium contracts against a closed valve, as occurs during atrioventricular (AV) dissociation or with some junctional or ventricular pacemaker rhythms, large a waves called cannon waves occur. The downslope of the a wave (X descent) results from the decrease in atrial pressure as the blood moves into the ventricle and ends with the closure of the tricuspid valve (tricuspid on right, mitral on left).

The c wave occurs at the completion of AV valve closure. It represents the movement or bulging of the AV valve back toward the atrium during ventricular contraction.

Buy Membership for Pulmolory and Respiratory Category to continue reading. Learn more here