Chapter 12  Vascular Laboratory Testing
Vascular laboratory technology offers many cost-effective applications in the practice of vascular medicine.1 Vascular testing includes both physiological testing and duplex ultrasonography. Physiological testing includes segmental pressure measurements, pulse volume recordings, continuous wave Doppler, and plethysmography. These tests employ sphygmomanometric cuffs, Doppler instruments, and plethysmographic recording devices. Duplex ultrasonography combines gray-scale and Doppler imaging with spectral and color Doppler and is used for the majority of vascular laboratory tests. An ultrasound machine should be equipped with vascular software and two transducers/probes, 5- to 12-MHz transducers for the neck and extremities, and 2.25- to 3.5-MHz transducers for the abdomen.
Limb Pressure Measurement and Pulse Volume Recordings
Segmental Doppler Pressure Interpretation
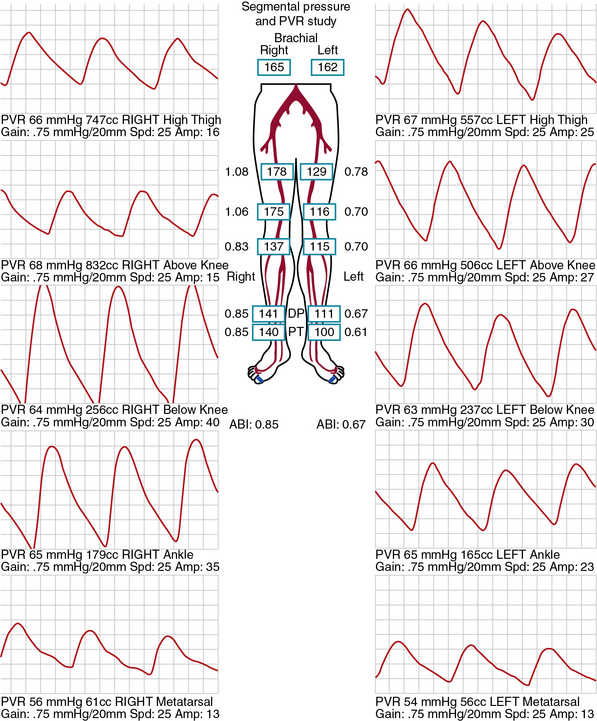
Segmental limb pressures are compared with the highest arm pressure. Ankle pressures are used to calculate the ankle-brachial indices (ABI) for each extremity. This is accomplished by dividing each of the ankle pressures by the higher of the brachial artery pressures.2 A normal ABI is between 1.0 and 1.4, whereas an ABI above 0.9 to 1.0 is borderline abnormal.3 Studies that evaluated the ABI in healthy subjects and patients with PAD confirmed by arteriography found that an ABI of 0.9 or lower was diagnostic of PAD with 79% to 95% specificity and 96% to 100% sensitivity.4 Pressures are compared between levels. A 20-mmHg or greater reduction in pressures from one level to the next is considered significant and indicates stenosis between those two levels. In healthy subjects, the high thigh pressure determined by cuff typically exceeds the brachial artery pressure by approximately 30 mmHg. A thigh/brachial index above 1 is interpreted as normal, and an index of 1 or less indicates stenosis proximal to the thigh (Fig. 12-1). When high thigh pressures are low compared with arm pressure, the site of obstruction could be in the aorta or ipsilateral iliac artery, common femoral artery (CFA), or proximal superficial femoral artery (SFA) (see Fig. 12-1). If only one high thigh pressure is less than the brachial pressure, an ipsilateral iliofemoral artery stenosis is inferred.
Pulse Volume Recording Interpretation
The same cuffs used to measure segmental pressures may be attached to a plethysmographic instrument and used to record the change in volume of a limb segment with each pulse, designated the pulse volume. Pulse volume waveform evaluation allows assessment of arterial flow in regions of calcified vessels because the test does not rely on cuff occlusion of the calcified artery.5 Each cuff is inflated in sequence to a predetermined reference pressure up to 65 mmHg. The change in volume in the limb segment causes a corresponding change in pressure in the cuff throughout the cardiac cycle. Interpretation of the pulse volume recording (PVR) requires calibration of the amount of air in the cuff.
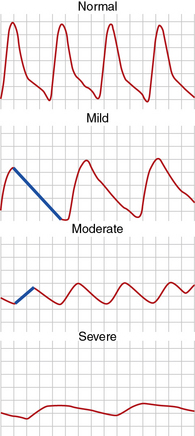
A pulse volume waveform is recorded for each limb segment. Pulse volume recording analysis is based on evaluation of waveform shape, signal, and amplitude (Fig. 12-2). The configuration of the normal pulse volume waveform resembles the arterial pressure waveform, and is composed of a sharp systolic upstroke followed by a downstroke that contains a prominent dicrotic notch. A hemodynamically significant stenosis manifests as a change in the PVR contour toward a tardus parvus waveform. Both the slope and amplitude decrease when there is more severe disease. Severity of PAD can be defined by the slope of the upstroke and amplitude of the pulse volume (see Fig. 12-2).
Pulse waveforms can also be obtained using photoplethysmography, recording reflected infrared light. In photoplethysmography, the signal is proportional to the quantity of red blood cells in the cutaneous circulation; it does not measure volume changes. Waveform shape is assessed in a similar fashion in pulse volume and photoplethysmography recordings. Low photoplethysmographic waveforms in the toes identify increased risk of amputation, in addition to the toe pressure.5
Exercise Testing for Peripheral Artery Disease
Exercise testing is an adjunctive physiological test to evaluate PAD. It is useful to assess functional capacity and determine the distance patients with claudication are able to walk. Moreover, it can be used to clarify whether leg symptoms are related to PAD. This is relevant in patients with symptoms that are atypical for claudication and in those who have a history of intermittent claudication, yet normal ABIs at rest.6 Relative contraindications to treadmill exercise testing for PAD include rest pain in the leg, shortness of breath with minimal exertion, or unstable angina. The test cannot be performed if the patient cannot walk on a treadmill.
Patients are instructed to fast for 12 hours prior to walking on the treadmill. The constant-load treadmill test is performed at a speed of 2 mph and an incline of 12%. Graded exercise protocols increase the grade and/or speed in 2- to 3-minute stages. The Gardner protocol is the most commonly used graded protocol to evaluate walking exercise capacity.7 It begins at a speed of 2 mph and an incline of 0%, and the grade progressively increases by 2% every 2 minutes, allowing for a wider range of responses to be measured. It is often used to determine clinical trial end points such as change in walking time in response to therapy. Other graded exercise protocols, such as the Bruce protocol, are not commonly used because the rapid rate of speed and incline limits assessment of exercise capacity in claudicants.
Transcutaneous Oximetry
By exploiting variations in color absorbance of oxygenated and deoxygenated hemoglobin (Hb), transcutaneous oximetry can determine the state of blood oxygenation. Oximeters use two light frequencies, red at 600 to 750 nm and infrared at 800 to 1050 nm, to differentiate oxygenated and deoxygenated Hb. Deoxygenated blood absorbs more red light, whereas oxygenated blood absorbs more infrared light. Oximeters typically employ both an emitter and receiver. Red and infrared light is emitted and passes through a relatively translucent structure such as the finger or earlobe. A photodetector determines the ratio of red and infrared light received to derive blood oxygenation. When measured continuously, oxygenation peaks with each heartbeat as fresh oxygenated blood arrives in the zone of measurement. Normal values for oxygen tension are from 50 to 75 mmHg. One probe is placed on the chest as a control to ensure that oxygen tension is from 50 to 75 mmHg. A second probe is placed on the limb in the area of interest. Measurements are obtained from the probe, which is sequentially positioned from proximal to distal segments of the limb. Normal limb TcO2 should approximate that of the chest. Transcutaneous oximetry is most often used to determine the level of amputation. A value above 20 mmHg can predict healing at the site with 80% accuracy.7 This measurement is not affected by arterial calcification.
Physical Principles of Ultrasonography
Artifact
Although a highly reliable imaging modality, ultrasound does suffer from occasional image artifact.8 Dense objects like vessel-wall calcium deposits permit few sound waves to penetrate, resulting in acoustic shadowing and diminishing imaging of deeper tissues. Tissue imaging enhancement may be noted on the far side of echo-free or liquid-filled zones. Tissue interfaces may generate multiple sound wave reflections, causing “additions” to the tissue termed reverberation artifact. Refraction of the sound pulse may cause improper placement of a structure of an image and shadowing at the edge of a large structure. Highly reflective surfaces may create mirror images because the reflecting tissue alters the timing of the returning sound wave. The mirror image should be equidistant from the reflecting surface or tissue.
Spectral Doppler Waveform Analysis
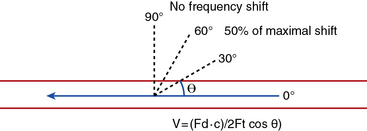
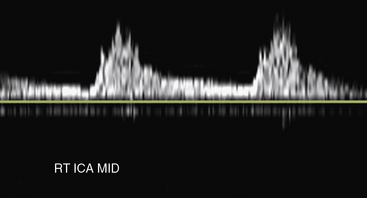
Velocity recordings are obtained with an angle of 60 degrees between the Doppler insonation beam and the flow. In ultrasound practice, the optimal angle of measurement between the beam and blood flow is 60 degrees. Although maximal shift is detected at 0 degrees, this angle cannot be reliably obtained in vascular imaging because the vessels are parallel to the surface of the body. Insonation angles below and above 60 degrees influence the measurement such that small reductions in the insonation angle may alter velocity by 10%, whereas small increases in insonation angle may change flow velocity by 25% (Fig. 12-3). Thus, the sample-volume cursor is placed parallel to the inner wall, and a Doppler9,10 angle from 30 to 60 degrees between the wall and the insonation beam (or flow jet) is used. A normal peripheral artery Doppler waveform consists of a narrow, sharply defined tracing. This indicates that all blood cells are moving at an equivalent speed at any time in the cardiac cycle.11 Waveforms are also characterized as high resistance due to limited flow during diastole (e.g., normal peripheral arterial Doppler velocity waveform), or low resistance with continuous flow during diastole, as when downstream resistance arterioles are widely dilated or there is contiguity with low-resistance circuits (e.g., normal internal carotid artery [ICA] velocity waveform) (Fig. 12-4). The normal high resistance waveform is typically triphasic. The first component is caused by initial high-velocity forward flow during ventricular systole. A range of normal peak systolic velocity (PSV) measurements have been defined12 for each arterial segment, described later in this chapter.
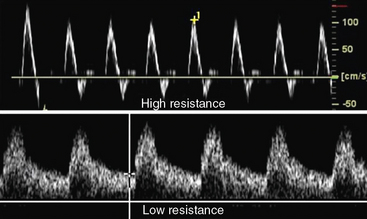
The second phase of the waveform consists of early diastolic flow reversal as left ventricular (LV) pressure falls below aortic pressure prior to aortic valve closure.13 The final or third component is a small amount of forward flow when there is elastic recoil of vessel walls. Flow is typically not uniform or laminar at bifurcations and sites of stenosis; at these sites flow becomes turbulent. For these locations, the spectral Doppler waveform reflects the fact that blood cells move with varying velocities. Instead of a narrow well-defined tracing (see Fig. 12-4), spectral broadening becomes evident (Fig. 12-5), with partial or complete filling-in of the area under the spectral waveform. This third, or late, diastolic component is usually absent in atherosclerotic vessels that have lost compliance or elasticity.
Color Doppler
Color Doppler is the phase or frequency shift information contained in the returning echoes and processed in real time to form a velocity map over the entire imaging field.14 Doppler frequency-shift data are available for every point imaged. This information is then superimposed on the gray-scale image to provide a composite real-time display of both anatomy and flow. When motion is detected, it is assigned a color, typically red or blue, determined by whether the frequency shift is toward or away from the probe. Color assignment is arbitrary and can be altered by the user, but most choose to assign the color red to arteries and blue to veins. With increasing Doppler frequency shifts, the hue and intensity of the color display change, with progressive desaturation of the color and a shift toward white at the highest detectable velocities.
The pulse repetition frequency (velocity) scale determines the degree of color saturation and filling of the vessel lumen. The pulse repetition frequency (radio frequency pulses per second from the probe) is adjusted so that in a normal vessel, laminar flow appears as a homogeneous color. The color appearance changes throughout the cardiac cycle. Increasing flow velocity and turbulence in the region of a stenosis results in production of a high-velocity jet and an abrupt change in color-flow pattern (Fig. 12-6). Color aliasing occurs at the site of stenosis when flow velocity exceeds the Nyquist limit (i.e., when Doppler frequency shift exceeds half the pulse repetition frequency). Aliasing causes the color display to appear as if there is an abrupt reversal in direction of flow (wraparound). This suggests a high-velocity flow jet, requiring confirmation by pulsed-wave Doppler analysis. Color persistence is a continuous flow signal that is the color of the forward direction only, in contrast to the alternating color in normal arteries. There is loss of early diastolic flow reversal. Color persistence corresponds to the monophasic spectral Doppler waveform and is indicative of severe stenosis. Post-stenotic regions display mosaic patterns indicating turbulent flow (see Fig. 12-6). A color bruit in the surrounding soft tissue also indicates flow disturbance. This color artifact is associated with turbulence and occurs with flow disturbances associated with high-velocity jets. The color bruit is particularly useful in locating postcatheterization arteriovenous fistulae (AVF).
Assessment of Arterial Stenosis
Characteristic duplex ultrasound features of a stenosis include elevated systolic velocity, elevated end-diastolic velocity (EDV), color aliasing, color bruit, spectral broadening of the Doppler waveform, post-stenotic flow, and post-stenotic turbulence. An auditory “thump” occurs in the presence of total arterial occlusion. Doppler velocity measurements are the main tools used to evaluate stenosis severity. When flow rate is constant, a decrease in vessel cross-sectional area is balanced by an increase in velocity.13 As blood flow turbulence increases, spectral broadening of the Doppler waveform becomes a clear indicator of turbulent flow seen in the post-stenotic region. The post-stenotic waveform is dampened with a delayed upstroke (see Fig. 12-3). If no post-stenotic turbulence can be identified, inappropriate angle alignment or a tortuous vessel should be suspected.
Power (or amplitude) Doppler is a complementary imaging technique that displays the total strength or amplitude of the returning Doppler signal.15 In comparison with conventional color-flow imaging, color-flow sensitivity is increased by a factor of 3 to 5 times with power Doppler. This enhanced dynamic range can depict very slow flow in the area of a subtotal occlusion that may not be detected by conventional color-flow Doppler. Contrast agents can also help differentiate between occlusion and high-grade stenosis in carotid and renal arteries, especially in cases where multiple renal arteries are present.16
Carotid Duplex Ultrasound
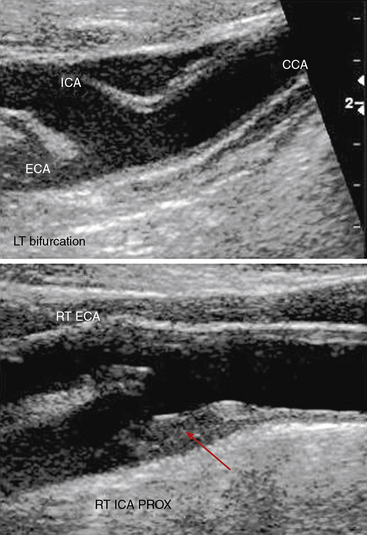
The standard carotid duplex examination includes assessment of the carotid arteries as well as the vertebral, subclavian, and brachiocephalic arteries. Indications for this test include a bruit, transient ischemic attack (TIA), amaurosis fugax, stroke, and surveillance after revascularization.17 The examination begins with a gray-scale survey of the extracranial carotid arteries in transverse and longitudinal views. The operator images the region from the clavicle to the angle of the jaw, in both anterolateral and posterolateral views.18 The common carotid artery (CCA) is typically medial to the internal jugular vein, and the bifurcation is often located near the cricoid cartilage. The ICA is usually posterolateral, with a diameter at its origin greater than that of the anteromedially located external carotid artery (ECA).
Carotid artery stenosis can be focal, and flow patterns can normalize within a short distance. Therefore, the pulse-wave sample volume should be methodically advanced along the length of the vessel; color Doppler may be used for guidance in delineating areas of abnormal flow requiring change in position of the sample volume (Fig. 12-7). Representative velocity measurements should be recorded from the proximal, mid- and distal CCA. The CCA spectral waveform is a combination of the ECA and ICA waveforms, with greater diastolic flow than the ECA but less than the ICA. Atherosclerosis, when present, is usually most evident at the ICA origin, whereas fibromuscular dysplasia may be more evident distally. Using spectral Doppler, the sample volume is advanced throughout the entire ICA. At a minimum, PSV and EDV from the proximal, mid-, and distal ICA segments should be recorded. The vertebral artery is then located posterior to the carotid artery. The vertebral artery and vein lie between the spinous processes. The vertebral artery is followed as far cephalad as possible, sampling the spectral Doppler in the accessible portions of the vertebral artery.
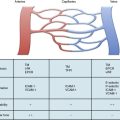
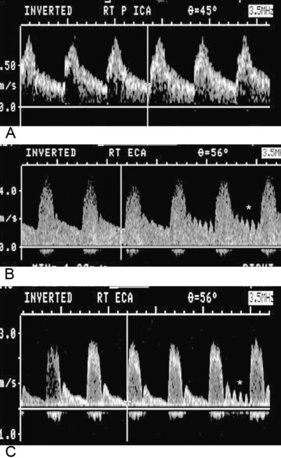
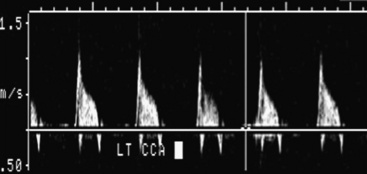
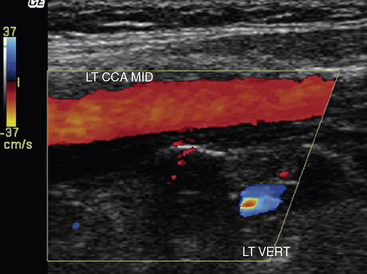
Distinguishing between the ICA and ECA is critical to the examination (Fig. 12-8). The ECA is usually smaller, more anteromedial, and has less diastolic flow than the ICA. The ECA will also have branches in the cervical region, whereas the ICA will not. Direct comparison of the waveforms from the two vessels is critical. A velocity waveform obtained from the proximal vessel or the site of maximal velocity should be obtained while intermittently tapping on the preauricular branch of the temporal artery. The intermittent tapping is reflected clearly in the diastolic portion of the ECA waveform, but not in the ICA waveform (Fig. 12-9).
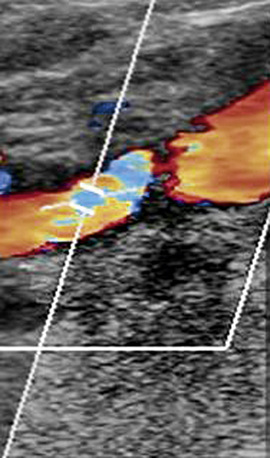
Figure 12-8 Color Doppler of internal carotid artery (ICA).
Color Doppler is added to gray-scale picture of right ICA seen in Figure 12-7. Color aliasing identifies an area of high velocity adjacent to the plaque. This guides placement of spectral Doppler sample volume, identified by parallel white lines.
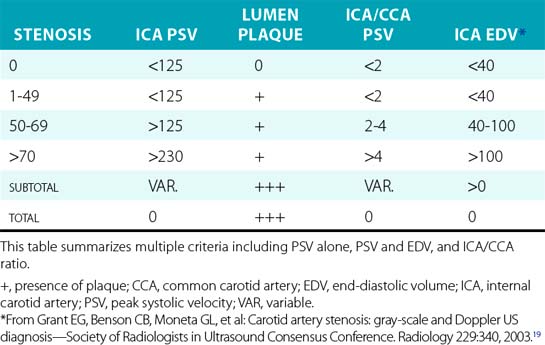
Interpretation of the spectral waveforms is based on parameters such as PSV, EDV, shape, and extent of spectral broadening19 (Fig. 12-10). A number of criteria have been proposed, each having their own strengths and weaknesses (Table 12-1). Peak systolic velocity criteria for ICA stenosis have identified a cut point of 230 cm/sec as the threshold for detecting greater than 70% stenosis, and 125 cm/sec as the cut point for identifying greater than 50% stenosis. Criteria that include EDV use a cut point of greater than 140 cm/sec to identify greater than 80% stenosis. The ratio of peak ICA systolic velocity to mid-CCA velocity may be particularly useful in determining the presence of stenosis in the hemodynamic setting of low cardiac output or critical aortic stenosis. At a minimum, velocity criteria must distinguish less than 50% stenosis, 50% to 69% stenosis, and greater than 70% stenosis. Selection of criteria for use in an individual laboratory requires review of the published parameters and selection of those appropriate to laboratory practice. Individual vascular laboratories must validate the results of their own criteria for stenosis against a suitable standard such as arteriography.
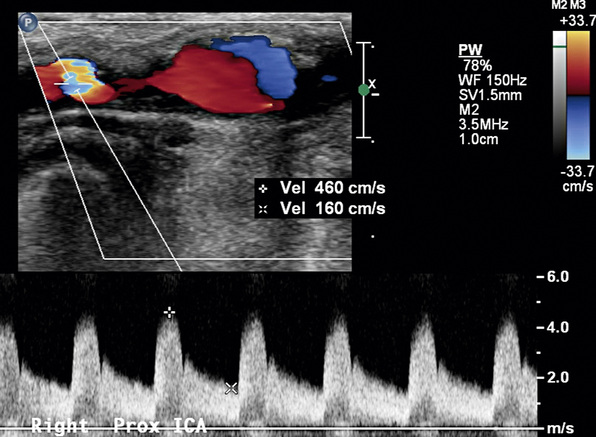
Figure 12-10 Internal carotid artery (ICA) stenosis.
Pulsed-wave sample volume is placed at the site of aliasing. There is marked spectral broadening. Waveform resembles that in Figure 12-9C.
Waveform analysis depends on evaluation of acceleration, diastolic flow, direction of flow, and comparison to the contralateral vessel. If the ICA is totally occluded, there will be absent or severely diminished diastolic flow in the ipsilateral CCA (Fig. 12-11). A delay in the upstroke suggests more proximal stenosis. For example, severe stenosis of the brachiocephalic artery will result in dampened right CCA waveforms. A step-up in systolic velocity in the cervical portion of the CCA indicates stenosis, with doubling indicating at least 50% stenosis and tripling indicating at least 75% stenosis.
Waveform evaluation is particularly valuable in the vertebral artery because the segments within the bone cannot be directly evaluated with ultrasound. Specific velocity criteria have not been developed for vertebral artery stenosis. Velocities greater than 125 cm/sec and dampened waveforms are two indicators of vertebral artery stenosis. Absent flow in the vertebral artery is confirmed when flow is detected in the vertebral vein, but not in the vertebral artery. Retrograde flow in the vertebral artery is referred to as subclavian steal (i.e., the subclavian circulation is stealing from the cerebral circulation). Reverse flow is confirmed by comparing the direction of vertebral artery flow with that of the carotid artery (Fig.12-12). Reverse flow typically will have a diminished diastolic component because flow is into the high-resistance bed of the subclavian artery (Fig. 12-13). If flow is cephalad but notching is evident in the systolic portion of the wave, subclavian steal can be elicited by reexamining flow after arm exercise or following deflation of a blood pressure cuff that had been inflated to suprasystolic pressures on the ipsilateral arm. These maneuvers will increase demand in the subclavian bed, and vertebral flow will completely reverse in the setting of subclavian stenosis proximal to the vertebral origin. The vast majority of these patients with subclavian stenosis are asymptomatic.
The subclavian artery is evaluated as close to the origin as possible. The probe is placed longitudinally above the clavicle and angled to obtain a scanning plane below the clavicle. Color Doppler surveillance is used to detect nonlaminar flow. The Doppler spectrum is obtained throughout the vessel.20 Doubling of PSV is consistent with 50% or greater stenosis.
Plaque and Arterial Wall Characterization
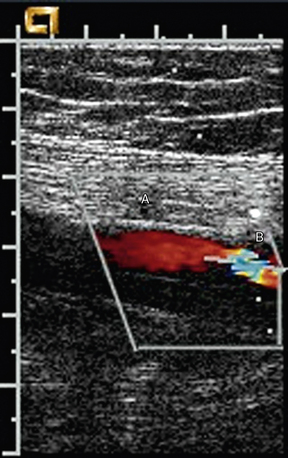
Gray-scale imaging is used to evaluate carotid plaque and arterial wall characteristics. Atherosclerotic plaque is evident on ultrasound examination as material that thickens the intima and protrudes into the arterial lumen. Plaque surface and echo characteristics can be determined and described. Ulceration refers to an excavation within the plaque containing flow. Echolucent plaque is characterized as plaque that is less echogenic than surrounding muscle (Fig. 12-14) and is often first detected by the presence of abnormal color flow (Fig. 12-15). The volume of plaque is appreciated best in the transverse view and with three-dimensional (3D) reconstruction.
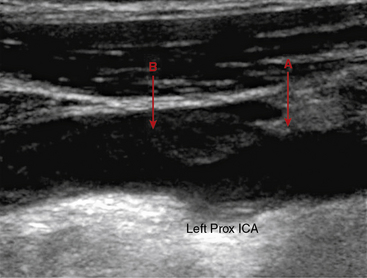
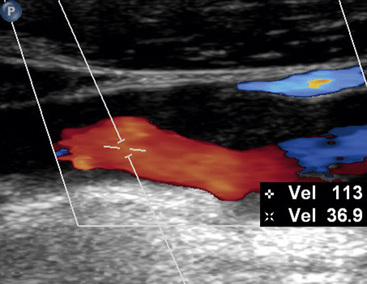
Figure 12-15 Duplex imaging of atherosclerotic plaque.
Echolucent plaque is now clearly evident with addition of color Doppler.
Another potential technique to characterize plaque content and activity is contrast-enhanced ultrasound to detect ulceration and inflammation. Activated leukocytes attached to the inflamed vessel wall may bind the shells of lipid microbubbles, which are detectable by ultrasound.21 Contrast also can be used to define the wall/lumen interface (Fig. 12-16A). Plaque thickness can be severely overestimated or underestimated in the longitudinal image, and is best evaluated in transverse images.
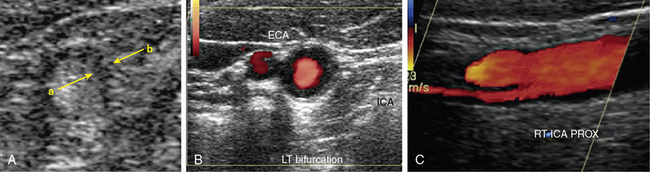
Ultrasound can also evaluate findings such as edema (Fig. 12-16B) and dissection of the carotid wall (Fig. 12-16C). Dissection can originate in the ICA or extend from the arch into the CCA. A flap separates the true and false lumen. The flap may be apparent on gray-scale imaging but generally requires color or contrast for elucidation. A flutter is occasionally identified in the downslope of the waveform on the affected side. Evaluation should identify both the proximal and distal extent of dissection, and flow velocities in the true lumen.
Carotid Intima Media Thickness
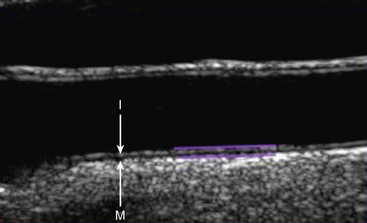
Carotid ultrasonography has traditionally been used to evaluate the presence of obstructive atherosclerosis in the setting of symptomatic cerebrovascular disease or asymptomatic carotid bruit. More recently, carotid ultrasonography has been performed in epidemiological studies to detect nonobstructive plaque and intima media thickness (IMT).22 Intima media thickness refers to the distance from the intima lumen interface to the media adventitia border. Protocols have measured ICA, CCA, ICA plus CCA, and carotid bulb IMT. Yield and reproducibility appear to be greatest for the far-wall CCA IMT measurement. Intima media thickness measurement is most commonly made from longitudinal images, with the assistance of semiautomated edge-detection software (Fig. 12-17). There is variability in this measurement from systole to diastole, and by age and gender. A single threshold value for abnormal IMT has not been determined. Ideally, threshold values derived from large population-based studies should be used in evaluation of IMT. Both plaque and IMT correlate with cardiovascular morbidity and mortality.22 Indeed, the presence of carotid plaque resulting in 50% stenosis is included in the Adult Treatment Panel III guidelines as a coronary heart disease equivalent.
Abdominal Aorta Evaluation
Abdominal ultrasound is used to diagnose and follow abdominal aortic aneurysms. An ultrasound machine with a low-frequency transducer (e.g., 2.5 MHz) is used to determine aneurysm size, shape, location (infrarenal or suprarenal), and distance from other arterial segments. The patient is required to fast prior to the study because bowel gas will obscure imaging. Aortic ultrasound scanning begins with the patient supine and the transducer placed in a subxiphoid position. The aorta is located slightly left of midline. The abdominal aorta from the diaphragm to the bifurcation is evaluated using three sonographic views: the sagittal plane (anteroposterior [AP] diameter), transverse plane (AP diameter and transverse diameters), and coronal plane (longitudinal and transverse diameters). Diameter is measured from outer wall to outer wall. If overlying bowel gas obstructs the aorta from view, patients are instructed to lie in the decubitus position, and the aorta is visualized via the coronal plane through either flank.23 As the transducer is moved caudally, the celiac trunk will be evident branching into the common hepatic and splenic arteries (Fig. 12-18). The superior mesenteric artery (SMA) originates approximately 1 cm distal to the celiac trunk (Fig. 12-19). Next, the right renal artery may be seen emerging from the aorta and traveling under the inferior vena cava. The left renal vein then crosses over the aorta, and the left renal artery will be seen posterior to the vein. The inferior mesenteric artery (IMA) is the final branch arising from the aorta before it bifurcates into the iliac vessels. Spectral Doppler evaluation of the celiac and mesenteric vessels will demonstrate low-resistance waveforms following a meal and high resistance waveforms in the normal fasting patient (Fig. 12-20). In contrast, evaluation of the normal renal arteries always demonstrates low-resistance waveforms.
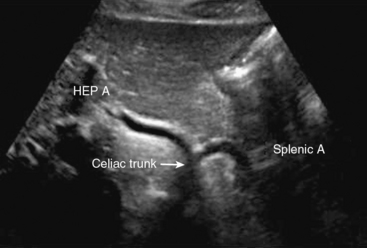
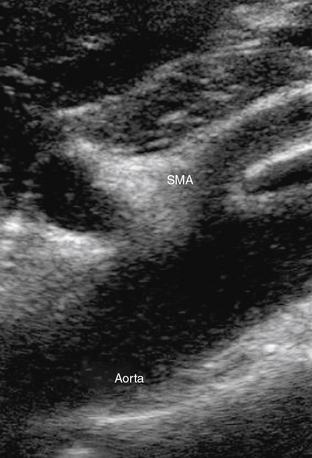
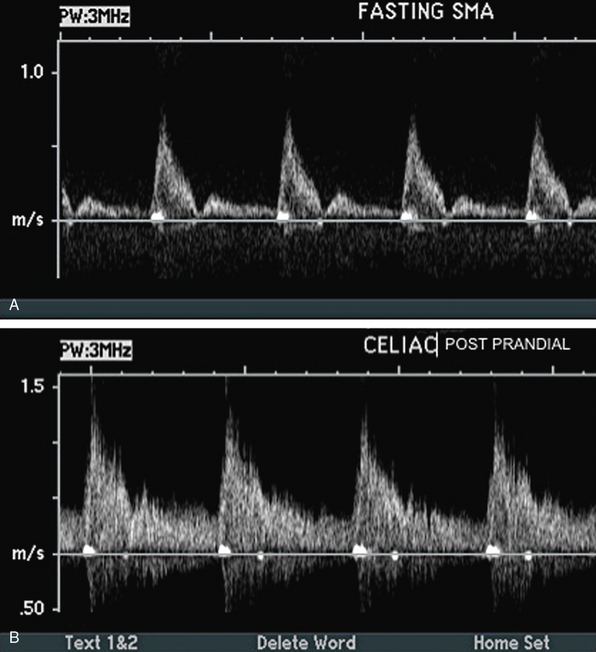
Figure 12-20 A, Fasting spectral waveform in superior mesenteric artery (SMA). B, Postprandial spectral waveform in celiac trunk.
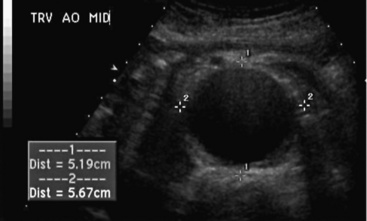
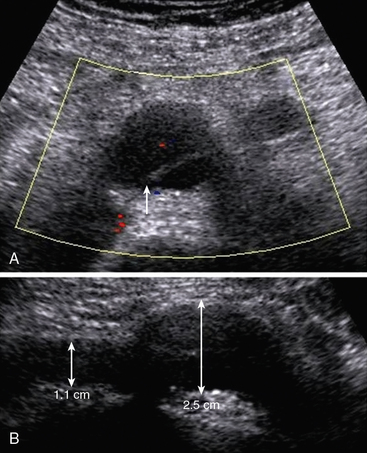
An abdominal aortic aneurysm is defined as an aortic diameter of at least 1.5 times the adjacent normal segment, or a distal aorta diameter of greater than 3.0 cm (Fig.12-21). Normal abdominal aortic diameters range from 1.4 to 3.0 cm.24 The shape of the abdominal aortic aneurysm is described as saccular, fusiform, or cylindrical. The majority of abdominal aortic aneurysms are fusiform in shape, located below the renal arteries, and involve one or both of the iliac arteries. Atherosclerotic plaque, mural thrombus, and dissection can be detected in the wall of the aneurysm.25
Ultrasound evaluation is also performed after endograft repair of abdominal aortic aneurysm. Flow within the graft is evaluated with longitudinal and transverse imaging. Endoleak is diagnosed when there is flow outside the graft but within the aneurysm. Dissection, pseudoaneurysm, and thrombus within the graft are other potential complications26 that can be detected using ultrasound evaluation.
Renal Artery Duplex Ultrasonography
Atherosclerotic renal artery stenosis is recognized as a cause of hypertension and may contribute to decline in renal function (see Chapter 22). Duplex ultrasound of the renal arteries includes spectral Doppler evaluations of the aorta, the renal arteries and renal parenchyma, and B-mode determination of kidney size (also see Chapter 41). Abdominal obesity and bowel gas are barriers to adequate renal artery duplex examination.
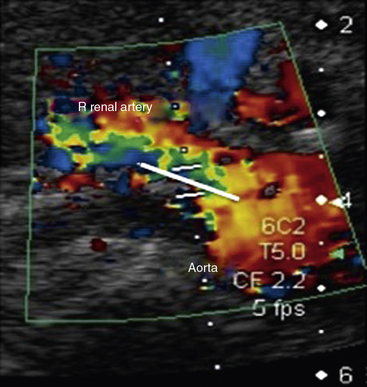
A longitudinal view of the aorta is obtained with the patient in the supine position. The origins of the celiac artery and SMA are seen on the anterior aspect of the aorta cephalad to the renal arteries. Peak systolic velocity in the aorta is then recorded using a 60-degree Doppler angle. The probe is turned transverse to localize the renal arteries. The Doppler cursor is “walked” from the aorta into the ostium of the renal artery (Fig. 12-22). The right renal artery is generally seen most easily. It is followed from the origin to the hilum of the kidney. The left lateral decubitus position can also be used for examination of the right renal artery. The left renal artery is best evaluated in the right lateral decubitus position using a posterolateral transducer position. Ideally, the renal arteries are evaluated from two views to ensure that stenosis is not missed. Kidney length is measured from pole to pole with the patient in the decubitus position.
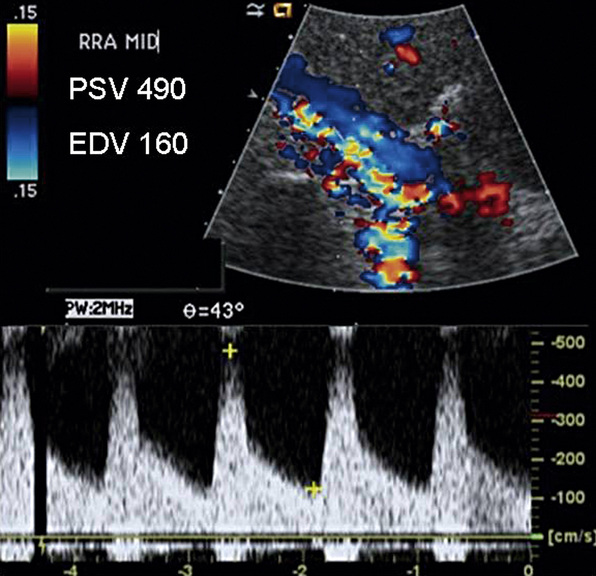
Color and spectral Doppler are obtained throughout the course of each renal artery. A low-velocity range and a low wall filter setting are used in spectral Doppler evaluations of the segmental renal arteries and hilar flow. The renal artery normally has a low-resistance waveform.27 A 60% or more renal artery stenosis is characterized by a renal-to-aortic PSV ratio of greater than 3.5, combined with a PSV within the stenosis of greater than 200 cm/sec. Elevated EDV 150 cm/sec or more suggests 80% or greater stenosis (Fig. 12-23). The same criteria are used in native and stented renal arteries.28 Low systolic flow, post-stenotic turbulence, and a color mosaic appearance indicate subtotal occlusion of the renal artery. Low parenchymal Doppler velocities support the diagnosis of an occluded renal artery in those cases where no flow can be detected in the renal artery. In addition, the ipsilateral kidney is often small, less than 9 cm in length. Overall sensitivity of duplex ultrasonography for renal artery stenosis is 98%, and specificity is 98% compared with arteriography.29
Measurement of the resistive index (RI) is used to evaluate renal parenchymal disease. Spectral Doppler waveforms are obtained from at least three regions of each kidney. The RI is calculated using the formula: RI = [1 − (Vmin ÷ Vmax)] × 100, where Vmin denotes end-diastolic velocity, and Vmax denotes peak systolic velocity. In severe renal artery stenosis where there is significant renal parenchymal disease, the EDV is often low. An RI above 0.80 suggests significant parenchymal renal disease30 and may have implications regarding the outcome of therapy. Similarly, the PSV and EDV can be used to monitor renal transplants.31
Peripheral Arterial Ultrasonography
Ultrasound of the lower extremities is used to diagnose PAD in the setting of claudication, limb pain, or ulcers.12 It is also indicated following lower-extremity revascularization and in planning therapy for known PAD. The goal of the examination is to elucidate the location and severity of limb arterial stenoses.32 The study is tailored to individual requirements and can be limited to a given arterial segment, extended to evaluate both lower extremities in their entirety, or to evaluate the upper extremity.
Color Doppler is used initially to detect normal or abnormal flow states throughout the arterial segments or bypass grafts being evaluated.33 Laminar flow is visible in the absence of disease (Fig. 12-24A), whereas turbulence and aliasing are present at the sites of disease. When an abnormal flow pattern is detected by color Doppler, pulsed (spectral) Doppler sampling is used to characterize the degree of stenosis. The pulse Doppler signal is acquired throughout the arterial segments. Peak systolic velocity determination and waveform analyses are the primary parameters used to quantify and localize disease. Peak systolic velocity measurements are obtained at the level of the lesion and from vascular segments proximal and distal to the lesion. Aneurysmal dilation is another etiology for abnormal color flow. Velocities will decrease as diameter doubles at the site of the aneurysm. The iliac, superficial femoral, and popliteal arteries are all sites of aneurysm (Fig. 12-25).
Peripheral arterial stenosis is categorized by pulsed-wave Doppler examination as percentage reduction of luminal diameter that is mild (0%-19%), moderate (20%-49%), or severe (≥ 50%).12 With mild stenosis, there is some spectral broadening and a slight increase in PSV. With moderate stenosis, there is increased spectral broadening and a rise in PSV less than double that of the proximally sampled segment. Pulsed Doppler interrogation at the level of a severe stenosis reveals marked spectral broadening and a monophasic waveform. The waveform loses its normal diastolic reverse flow component, and flow is forward throughout the cardiac cycle. Also, the PSV is more than double the velocity measured in the proximal segment. An occlusion is present when flow is absent within an arterial segment. If there are no collateral vessels, high-resistance waveforms are present in the artery proximal to the occlusion. Antegrade diastolic flow is present in the proximal artery if there are collateral vessels. The reconstituted distal artery will have the characteristic post-stenotic tardus et parvus waveform. This Doppler waveform is particularly important to recognize because it signifies a proximal high-grade lesion.
Duplex ultrasound examination is accurate for diagnosing PAD. The comparison of duplex ultrasound evaluation with arteriography to detect significant stenoses in patients with symptomatic aortoiliac and femoropopliteal disease reveals high sensitivity (82%) and specificity (92%) for identifying significant stenoses.33 Ratios of PSV between the stenosis and the proximal artery are preferred over absolute PSV measurements for classification of peripheral arterial stenosis because a wide range of absolute PSV measurements is obtained in normal and abnormal patients. There is a stronger correlation between PSV ratio and degree of stenosis than between absolute PSV and degree of stenosis. Peak systolic velocity ratios of 2 and 7 correspond to stenoses of 50% or more and 90% or more, respectively. There are conflicting data regarding precision of duplex ultrasound examination in determining stenosis severity when serial stenoses are present.
Extremity Arterial Ultrasound Following Revascularization
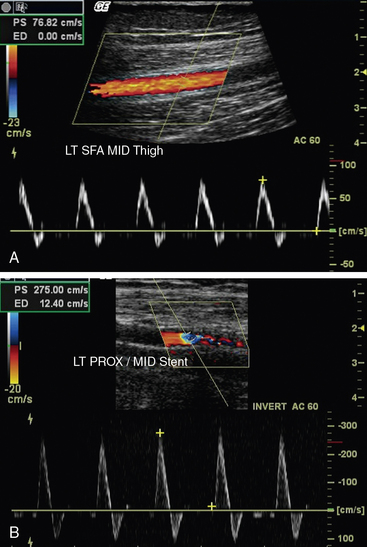
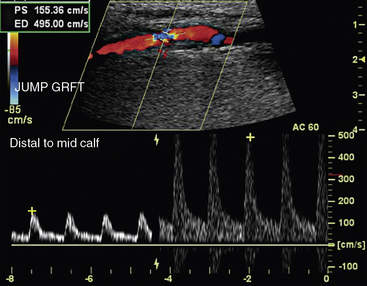
Ultrasound evaluation following endovascular procedures is performed to detect recurrence of stenoses at sites of intervention. The concept is similar to that for graft surveillance (i.e., early detection of lesions assists in identifying the need for reintervention to maintain arterial patency).33,34 Duplex ultrasonography is performed following the intervention, prior to discharge; 1, 3, and 6 months postintervention; then yearly. The color Doppler and pulsed-wave Doppler evaluations focus on the vessel proximal to the site of intervention, at the site of intervention, and distal to the site of intervention. Waveform analysis is used to categorize stenosis in a manner similar to that used in native vessels.35 A doubling of PSV is consistent with hemodynamically significant stenosis (see Fig. 12-24B). Increases in velocity measurements and change in waveform shape from triphasic to monophasic on serial examinations suggest developing stenosis and warrant close-interval follow-up and consideration for revision.
Graft surveillance is extremely useful in efforts to preserve patency of peripheral arterial bypass grafts.36 Graft failure in the first month is usually caused by technical factors. Between 1 month and 2 years postoperatively, it is often due to intimal hyperplasia. Graft failure after 2 years is likely the result of progression of atherosclerotic disease. The 5-year primary patency rate for an infrainguinal vein bypass graft ranges from 60% to 85%. Surgical revision of these stenoses identified with ultrasound surveillance improves the 5-year patency rate to 82% to 93%. By contrast, segmental pressure measurements have not proved useful to predict bypass graft thrombosis. To detect graft abnormalities before frank graft failure, standard graft surveillance protocols recommend duplex ultrasound evaluation at 1, 3, and 6 months during the first postoperative year, and 12 months thereafter.37
Pulsed Doppler is used to determine PSV ratios within the graft, similar to its use in the native arterial examination (Fig. 12-26). A segment distal (rather than proximal) to the lesion may be chosen for the ratio when there is a diameter mismatch in the graft or there are tandem lesions proximal to the flow disturbance. Doubling of the velocity ratio indicates a significant graft stenosis (> 50% diameter reduction) with a sensitivity of 95% and specificity of 100%. Vein graft lesions also have been classified using PSV: (1) a minimal stenosis (< 20%) has PSV ratio up to 1.4 with a PSV of less than 125 cm/sec; (2) a moderate stenosis (20%-50%) has a PSV ratio of 1.5 to 2.4 with a PSV up to 180 cm/sec; (3) a severe stenosis (50%-75%) has a PSV ratio of 2.5 to 4 with a PSV of more than 180 cm/sec; and (4) a high-grade stenosis (> 75%) has a PSV ratio greater than 4 with a PSV greater than 300 cm/sec. Intervention is recommended for lesions categorized as severe or high grade.38 Detection of low-flow velocities within the graft with pulsed Doppler suggests either proximal or distal stenosis. Low velocity flow can also be caused by large graft diameter or poor arterial inflow. Nonetheless, velocities within a functioning graft that are less than 45 cm/sec indicate that subsequent graft failure is likely to occur. Other worrisome findings are a significant decrease or increase in PSV on serial examination.
Pseudoaneurysm
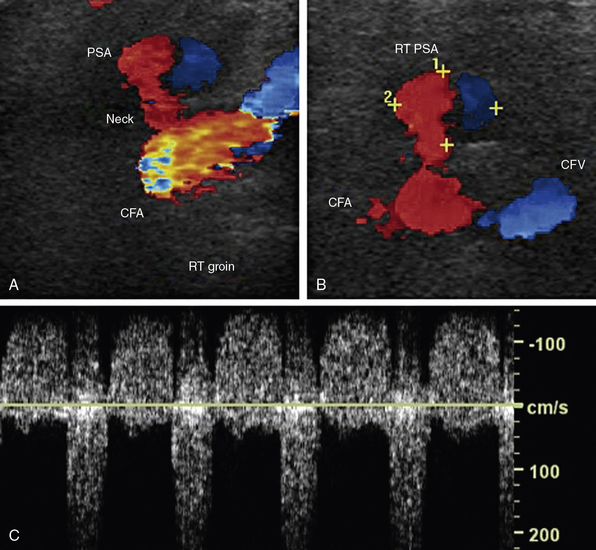
A pseudoaneurysm is a contained arterial rupture. A hole through all layers of the arterial wall results in extravasation of blood, which is then enclosed by surrounding soft tissues.39 Any patient who has undergone an arterial puncture for arteriography and experiences sudden pain at the access site, or is found to have pulsatile mass or a bruit on auscultation over the access site, should be evaluated for the presence of pseudoaneurysm.
Ultrasound evaluation is performed in the region of the puncture. Spectral waveforms are obtained in the native artery proximal and distal to the site of puncture, and in the femoral vein proximal and distal to the site of puncture. Color Doppler evaluation should focus on detecting an extravascular collection of flowing blood, most commonly anterior to the native artery (Fig. 12-27A-B). Posterior extravasation is less common. The neck is the connection between the native artery and the pseudoaneurysm sac. The neck is identified by a “to-and-fro” pattern of the Doppler waveform that is pathognomonic for pseudoaneurysm (Fig. 12-27C). This waveform results from systolic flow out of the native artery into the contained rupture, and diastolic flow back into the native artery. In addition to the to-and-fro signal in the neck, the segment of native artery proximal to the origin of the pseudoaneurysm may have a lower-resistance waveform when compared with that found in the artery distal to the pseudoaneurysm.
There are several options for treatment of pseudoaneurysms, including observation, surgical repair, manual compression, ultrasound-guided compression, or thrombin injection.40 Ultrasound-guided compression is performed with visualization of the pseudoaneurysm neck while compressing until flow is absent in the neck. Pressure is applied for 20 minutes and may have to be maintained for much longer before thrombosis of the pseudoaneurysm sac is achieved. Reported success rate of compression varies from 60% to 80%. Ultrasound-guided thrombin injection is best suited for those pseudoaneurysms with a long, narrow neck.41,42 Thrombin injection is contraindicated in those with allergy to bovine thrombin, those with overlying skin infections, in the presence of ipsilateral AVF, and in those with active limb ischemia. The injection is performed under sterile conditions using a syringe equipped with a three-way stopcock. The needle is placed into the sac while drawing back gently on the syringe. The tip of the needle is seen in the cavity, and blood return is noted. The stopcock is then switched to a position open to the thrombin, and 0.1 to 0.2 mL of thrombin are injected. The duplex ultrasound examination should include final pictures documenting thrombosis of the pseudoaneurysm and a patent artery of origin. Complications of thrombin injection include limb ischemia (if thrombin enters the native artery and causes a thrombus to form) and anaphylaxis.
Arteriovenous Fistulae
Arteriovenous fistulae occur secondary to trauma, including catheterization,43 or are created intentionally for dialysis.44 Duplex ultrasound findings include turbulent and pulsatile venous flow. Turbulence may result in a “color bruit” adjacent to the vein, caused by vibration of the surrounding soft tissue. Arterial flow proximal to the fistula will have a low-resistance pattern, rather than the typical high-resistance peripheral waveform (Fig. 12-28). Arterial flow distal to the fistula will have a high-resistance waveform. Venous flow pattern at the connection will resemble an arterial waveform. The actual arteriovenous connection may be too small to be seen in postcatheterization AVF.
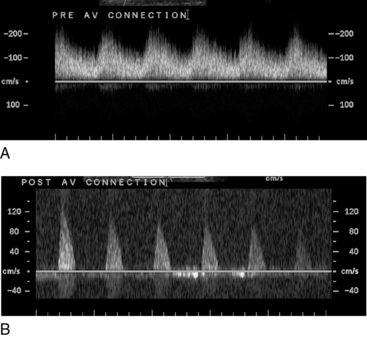
Figure 12-28 Spectral Doppler evaluation of peripheral artery proximal (A) and distal (B) to an arteriovenous (AV) connection.
Low-resistance pattern in A occurs because artery is flowing into high-capacitance venous bed.
Evaluation of dialysis fistulae use specific criteria for the Doppler spectra obtained from arterial inflow and venous outflow.45,46 Peak systolic velocity is recorded throughout the native system and the graft. The arterial limb should demonstrate high velocities and continuous forward flow with a low-resistance waveform. The venous limb is expected to have slightly lower velocities. The normal PSV at the anastomosis is 300 cm/sec. The normal outflow vein has a PSV greater than 180 cm/sec and appears distended. Peak systolic velocity less than 150 cm/sec indicates a fistula in jeopardy of failure. The fistula may result in arterial steal from the distal circulation. If this is suspected, direction of distal flow should be evaluated before and after compression of the AVF.
Venous Duplex Ultrasound
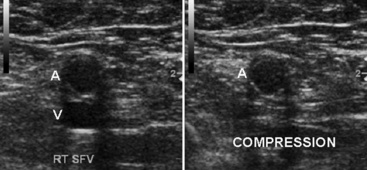
Duplex examination of the extremity veins enables accurate noninvasive evaluation for deep vein thrombosis (DVT).47 Normal veins have thin walls and an echo-free lumen. The vein lumen can be obliterated (compressed) with a small amount of extrinsic pressure (Fig. 12-29). The walls do not co-apt, however, when the lumen contains thrombus, even when enough pressure is applied to distort the shape of an adjacent artery. Vein compressibility is best tested in an image plane transverse to the vein axis. Veins are characterized by anatomical location as deep or superficial, and as proximal or distal. The major veins of the thigh and arm are larger in diameter than the corresponding arteries. Extremity veins have valves that permit only cephalad flow, and these increase in number from proximal to distal. Valve sinuses are widened areas of the lumen that accommodate the valve cusps.
Neck and Upper-Extremity Venous Duplex Ultrasound
Neck and upper-extremity duplex evaluation includes assessments of the internal jugular, subclavian, axillary, brachial, cephalic, and basilic veins.48 The innominate veins and the superior vena cava cannot be evaluated with duplex ultrasound because of their location within the bony thorax. Examination begins with evaluation of the internal jugular (Fig. 12-30) and subclavian veins. The subclavian vein can be imaged from a supraclavicular or subclavicular approach. The arm is extended in a comfortable position for the evaluation of the axillary vein, paired brachial veins, basilic vein (medial), and cephalic vein (lateral). Examination includes color and spectral Doppler evaluation of flow in all these veins. Loss of respirophasic variation in the waveform in the subclavian or axillary veins suggests the presence of more proximal venous obstruction (due to thrombosis or extrinsic compression) (Fig. 12-31). The subclavian vein cannot be compressed where it lies directly below the clavicle, and venous thrombosis is suspected when flow is absent or echogenic material is seen within the lumen.
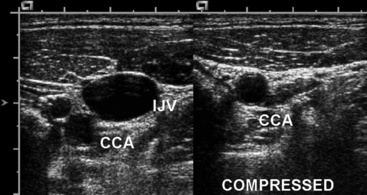
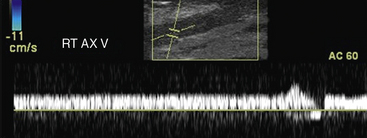
Figure 12-31 Spectral Doppler evaluation of axillary vein (AX) demonstrating loss of phasic variation in flow with respiration.
Loss of compressibility is the pathognomonic feature of venous thrombosis. As the thrombus progresses from acute to chronic, there is increased echogenicity of the thrombus and decreased diameter of the vein. Over time, collateral veins may develop and recanalization may occur in the thrombosed vessel. In the upper arm, both superficial and deep venous systems have a significant role in venous drainage. The majority of upper-extremity DVTs are secondary to indwelling venous catheters, pacemaker leads, or hypercoagulability. Primary upper-extremity DVT is a rare disorder that is idiopathic, attributed to effort thrombosis (Paget-Schrötter’s syndrome), or related to thoracic outlet obstruction.49 An unusual etiology of noncompressible veins is intravascular tumor. This is suspected when the echogenic material within the lumen appears to extend through the vessel wall and may contain arterial flow signals.
Lower-Extremity Venous Duplex Ultrasound
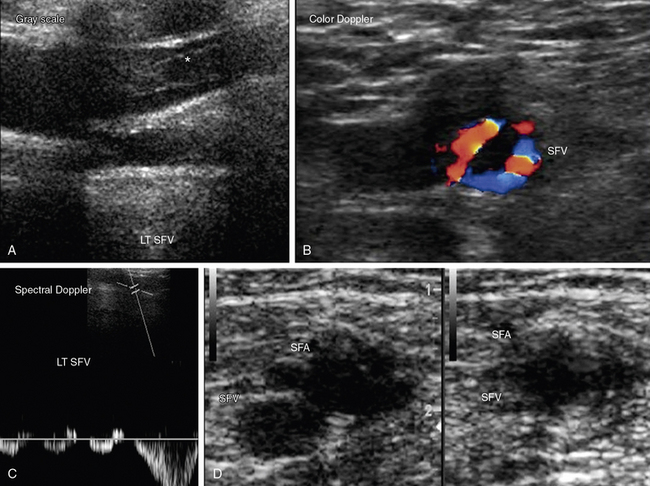
The venous ultrasound examination to evaluate the presence or absence of leg DVT begins at the inguinal ligament with identification of the common femoral vein and extends to the calf.50 The proximal deep veins evaluated include the common femoral, femoral (previously known as superficial femoral), and popliteal veins. The deep calf veins include posterior tibial, peroneal, gastrocnemius (sural), and soleal veins. Special attention is given to the saphenofemoral and saphenopopliteal junctions because thrombus in the superficial veins of these regions deserve more aggressive treatment than thrombus limited to other parts of the superficial venous system. Examination includes color and spectral Doppler evaluation of flow in all these veins 51,52 (Fig. 12-32). Loss of respirophasic variation in the waveform of the common femoral vein suggests presence of obstruction proximal to the site of Doppler interrogation that is preventing venous return. Augmentation of flow with calf compression is not prevented by proximal venous obstruction. Proximal obstruction may be caused by extrinsic compression or venous thrombosis.
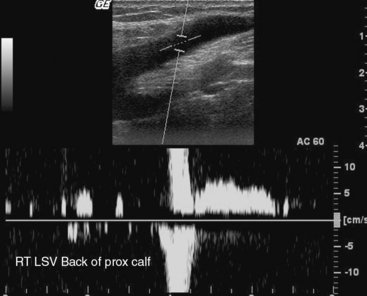
Duplex ultrasound is accurate for diagnosing deep calf vein thrombosis in symptomatic patients, so long as the calf veins can be seen clearly (Fig. 12-33). When compared with angiography, sensitivity of compression ultrasound for deep calf vein thrombosis is 94% and specificity is 100%. Small calf veins cannot be visualized well in all patients. However, specificity and positive predictive value are high even when individuals with poor calf vein images are included in the evaluation. Thus, the diagnosis of DVT is made when calf veins are seen and cannot be compressed.

Duplex Ultrasound Evaluation of Venous Insufficiency
Use of duplex ultrasound has been extended to detect reflux or obstruction and determine the anatomical extent of venous disease in patients with chronic venous insufficiency.53 This development has been facilitated by color Doppler imaging to provide instant determination of the direction of blood flow. A 4- to 7-MHz linear array transducer is used. The saphenofemoral junction is examined first with the patient standing, and then in the supine reverse-Trendelenburg position. Compressibility is determined in transverse views of the veins. A longitudinal view of the saphenofemoral junction is then obtained.
One of two maneuvers can be used to elicit reflux. The first is the Valsalva maneuver. Intraabdominal pressure increases as the patient bears down, and venous outflow from the legs decreases. Venous return from the legs increases with release of the maneuver.54 The second is thigh cuff inflation and deflation. Venous return is stopped with inflation of a cuff, typically to a level approximating arterial diastolic pressure. There is a transient increase in venous return that accompanies cuff deflation. Color flow is evaluated before and after one of these two maneuvers to elicit reflux. Baseline antegrade flow is displayed by blue color Doppler. Red color after the maneuver indicates retrograde flow. Reflux is present if red color persists for more than 0.5 seconds after either maneuver. Spectral Doppler can also be used to evaluate reflux. The Doppler cursor is placed midstream with an angle of 60 degrees with respect to the wall. Reverse flow over 0.5 seconds in duration is consistent with reflux (Fig. 12-34). Ideally, the remainder of the examination is performed with the patient standing with the weight on the leg not being examined.
Perforating veins are vessels connecting superficial and deep veins. Incompetent perforating veins are identified by sliding the transducer up and down dilated superficial varicose veins.55 Color Doppler is then used while distal compression of the superficial vein is performed. The presence of different colors during compression and release indicates that the direction of venous flow changes with compression and relief. This finding is diagnostic of reflux in the perforator veins.
Plethysmographic Evaluation of Venous Reflux
Duplex ultrasound identifies reflux in individual veins, and plethysmographic methods evaluate the volume of venous reflux in the limb.56 Air or strain gauge plethysmography is a simple screening test that has the potential to provide a complete analysis of venous hemodynamics (also see Chapter 55) . The air chamber is filled with air to 6 mmHg and connected to a pressure transducer and recorder. Changes in the volume of the leg as a result of emptying or filling veins produce changes in the pressure of the air chamber. Recordings are made with the patient supine, and the leg elevated at a 45-degree angle. The patient then stands with the leg flexed slightly and bearing weight on the nonstudy leg. Venous filling time and venous volume are determined. The time until the volume plateaus after the raised limb is dropped is the venous filling time. Venous volumes of 80 to 150 mL are normal. The venous filling index (VFI) correlates best with the clinical severity of reflux.

Values less than 2 mL/sec indicate the absence of significant reflux, whereas values over 10 mL/sec indicate high risks of edema, skin changes, and ulceration.57
Vascular Laboratory Accreditation
Laboratory accreditation is obtained through organizations such as the Intersocietal Commission for the Accreditation of Vascular Laboratories (www.icavl.org) and the American College of Radiology (www.acr.org). The accreditation process reviews the educational credentials of the interpreting physicians and sonographers, as well as laboratory procedures. It provides excellent standards for setting up examination protocols and quality assurance programs.
1 Boyajian R.A., Otis S.M. Integration and added value of the modern noninvasive vascular laboratory in vascular diseases management. J Neuroimaging. 2002;12:148.
2 Kupinski A.M. Segmental pressure measurement and plethysmography. J Vasc Technol. 2002;26:32–38.
3 Rooke T.W., Hirsch A.T., Misra S. 2011 ACCF/AHA Focused Update of the Guideline for the Management of patients with peripheral artery disease (Updating the 2005 Guideline): a report of the American College of Cardiology Foundation/American Heart Association Task Force on practice guidelines. Circulation. 2011;124:2020–2045.
4. Aboyans V, Criqui M, Abraham P, et al: The measurement and interpretation of the ankle brachial index, Circulation In press.
5 Carter S.A., Tate R.B. The value of toe pulse waves in determination of risks for limb amputation and death in patients with peripheral arterial disease and skin ulcers or gangrene. J Vasc Surg. 2001;33:708–714.
6 Stein R., Hrilajac I., Halperin J., et al. Limitation of resting ankle brachial index in symptomatic patients with peripheral artery disease. Vasc Med. 2006;11:29–33.
7 Anderson C.A. Noninvasive assessment of lower extremity hemodynamics in individuals with diabetes mellitus. J Vasc Surg. 2010;128:77S.
8 Feldman M.K., Katyal S., Blackwood M.S. US artifacts. Radiographics. 2009;4:1179–1189.
9 Grenier N., Basseau F., Rey M.C., et al. Interpretation of Doppler signals. Eur Radiol. 2001;8:1295–1307.
10 Logason K., Barlin T., Jonsson M., et al. The importance of Doppler angle of insonation on differentiation between 50-69% and 70-99% carotid artery stenosis. Eur J Endovasc Surg. 2001;21:311.
11 Wood M.M., Romine L.E., Richman K.M., et al. Spectral Doppler signature waveforms in ultrasonography: a review of normal and abnormal waveforms. Ultrasound Q. 2010;26:83–99.
12 Pellerito J.S. Current approach to peripheral arterial sonography. Radiol Clin North Am. 2001;39:553–567.
13 Needham T.N. Review of pressure and flow in the arterial system, 26:27. 2002.
14 Phillips G.W. Review of vascular ultrasound. World J Surg. 2000;24:232–248.
15 Rubin J.M. Power Doppler. Eur J Radiol. 1999;9:318S–322S.
16 Bokor D. Diagnostic efficacy of SonoVue. Am J Cardiol. 2000;86:19G–24G.
17 Brott T.G., Halperin J.L., Abbara S., et al. 2011 ASA/ACCF/AHA/AANN/AANS /ACR/ASNR/CNS/SAIP/SCAI/SIR/SNIS/SVM/SVS guideline on the management of patients with extracranial carotid and vertebral artery disease: a report of the American College of Cardiology Foundation/American Heart Association Task Force on Practice Guidelines, and the American Stroke Association, American Association of Neuroscience Nurses, American Association of Neurological Surgeons, American College of Radiology, American Society of Neuroradiology, Congress of Neurological Surgeons, Society of Atherosclerosis Imaging and Prevention, Society for Cardiovascular Angiography and Interventions, Society of Interventional Radiology, Society of NeuroInterventional Surgery, Society for Vascular Medicine, and Society for Vascular Surgery. Stroke. 2011;42:e420–e463.
18 Gerhard-Herman M., Gardin J.M., Jaff M., et al. Guidelines for noninvasive vascular laboratory testing. American Society of Echocardiography; Society for Vascular Medicine and Biology. Vasc Med. 2006;11:183–200.
19 Grant E.G., Benson C.B., Moneta G.L., et al. Carotid artery stenosis: gray-scale and Doppler US diagnosis—Society of Radiologists in Ultrasound Consensus Conference. Radiology. 2003;229:340.
20 Ochoa V.M., Yeghezarians Y. Subclavian artery stenosis: a review for the vascular medicine practitioner. Vasc Med. 2011;16:29–34.
21 Staub D., Schinkel A.F., Coll B., et al. Contrast-enhanced ultrasound imaging of the vasa vasorum: from early atherosclerosis to the identification of unstable plaques. J Am Coll Cardiol Cardiovasc Imaging. 2010;3:761–771.
22 Polak J.F., Pencina M.J., Pencina K.M., et al. Carotid-wall intima-media thickness and cardiovascular events. N Engl J Med. 2011;365:213–221.
23 Hirsch A.T., Haskal Z.J., Hertzer N.R., et al. ACC/AHA 2005 Practice Guidelines for the management of patients with peripheral arterial disease (lower extremity, renal, mesenteric, and abdominal aortic): a collaborative report from the American Association for Vascular Surgery/Society for Vascular Surgery, Society for Cardiovascular Angiography and Interventions, Society for Vascular Medicine and Biology, Society of Interventional Radiology, and the ACC/AHA Task Force on Practice Guidelines (Writing Committee to Develop Guidelines for the Management of Patients With Peripheral Arterial Disease): endorsed by the American Association of Cardiovascular and Pulmonary Rehabilitation; National Heart, Lung, and Blood Institute; Society for Vascular Nursing; TransAtlantic Inter-Society Consensus; and Vascular Disease Foundation. Circulation. 2006;113:e463–e654.
24 Beales L., Wolstenholme S., Evans J.A., et al. Reproducibility of ultrasound measurement of the abdominal aorta. Br J Surg. 2011;98:1517–1525.
25 Hong H., Yang Y., Liu B., et al. Imaging of the abdominal aortic aneurysm: the present and the future. Curr Vasc Pharmacol. 2010;8:808–819.
26 Cao P., De Rango P., Verzini F., et al. Endoleak after endovascular aortic repair: classification, diagnosis and management. J Cardiovasc Surg (Torino). 2010;51:53–69.
27 Hedayati N., Del Pizzo D.J., Harris S.E., et al. Predictors of diagnostic success with renal artery duplex sonography. Ann Vasc Surg. 2011;25:515–519.
28 Fleming S.H., Davis R.P., Cravens T.E., et al. Accuracy of duplex sonography scans after renal artery stenting. J Vasc Surg. 2010;52:953–957.
29 Ciccone M.M., Cortese F., Fiorella S., et al. The clinical role of contrast enhanced ultrasound in the evaluation of renal artery stenosis and diagnosis compared to traditional echo color Doppler flow imaging. Int Angiol. 2011;30:135–139.
30 Radermacher J., Chavan A., Bleck J., et al. Use of Doppler ultrasonography to predict the outcome of therapy for renal-artery stenosis. N Engl J Med. 2001;344:410.
31 Gao J., Rubin J.M., Xiang D.Y., et al. Doppler parameters in renal transplant dysfunction. J Ultrasound Med. 2011;30:169–175.
32 Collins R., Cranny G., Burch J., et al. A systematic review of duplex ultrasound, magnetic resonance angiography and computed tomography angiography for the diagnosis and assessment of symptomatic, lower limb peripheral arterial disease. Health Technol Assess. 2007;11:1–184.
33 Begelman S., Jaff M. Noninvasive diagnostic strategies for peripheral arterial disease. Cleve Clin J Med. 2006;73:22–29.
34 Roth S.M., Bandyk D.F. Duplex imaging of lower extremity bypasses, angioplasties and stents. Semin Vasc Surg. 1999;12:275–284.
35 Shrikhande G.V., Graham A.R., Aparjita R., et al. Determining criteria for predicting stenosis with ultrasound duplex after endovascular intervention in infrainguinal lesions. Ann Vasc Surg. 2011;25:454–460.
36 Slim H., Tiwari A., Ritter J.C., et al. Outcome of infrainguinal bypass grafts using vein conduit less than 3 mm in diameter in critical limb ischemia. J Vasc Surg. 2011;53:421–425.
37 Tinder C.N., Bandyk D.F. Detection of imminent graft occlusion: what is the optimal surveillance program? Semin Vasc Surg. 2009;22:252–260.
38 Tinder C.N., Chavapun J.P., Bandyk D.F., et al. Efficacy of duplex ultrasound surveillance after infrainguinal vein bypass may be enhanced by identification of characteristics predicting stenosis development. J Vasc Surg. 2008;43:613–618.
39 Kapoor B.S., Haddad H.L., Saddekni S., et al. Diagnosis and treatment of pseudoaneurysms. Curr Probl Diagn Radiol. 2009;38:170–188.
40 Kang S.S., Labropoulos N., Mansour M.A., et al. Expanded indications for ultrasound-guided thrombin injection of pseudoaneurysms. J Vasc Surg. 2000;31:289.
41 Mohler E.R.III, Mitchell M.E., Carpenter J.P., et al. Therapeutic thrombin injection of pseudoaneurysms: a multicenter experience. Vasc Med. 2001;6:241.
42 La Perna L., Olin J.W., Goines D., et al. Ultrasound-guided thrombin injection for the treatment of postcatheterization pseudo-aneurysms. Circulation. 2000;102:2391.
43 Seay T., Soares G., Dawson D. Postcatheterization arteriovenous fistula: CT, ultrasound and arteriographic findings. Emerg Radiol. 2002;9:269–299.
44 Rose S.C. Noninvasive vascular laboratory for evaluation of peripheral arterial occlusive disease. Part III—clinical applications: nonatherosclerotic lower extremity arterial conditions and upper extremity arterial disease. J Vasc Interv Radiol. 2001;12:11.
45 Polkinghorne K.R., McMahon L.P., Becker G.J. Pharmacokinetic studies of dalteparin (Fragmin), enoxaparin (Clexane), and danaparoid sodium (Orgaran) in stable chronic hemodialysis patients. Am J Kidney Dis. 2002;40:990.
46 Gonzalez S.B., Busquets J.C., Figueriras R.G., et al. Imaging arteriovenous fistulas. AJR Am J Roentgenol. 2009;31:1425–1433.
47 Tan M., van Rooden C.J., Westerbeek R.E., et al. Diagnostic management of clinically suspected acute deep vein thrombosis. Br J Haematol. 2009;146:347–360.
48 Kucher N. Clinical practice: deep vein thrombosis of the upper extremities. N Engl J Med. 2011;3:861–869.
49 Joffe H.V., Goldhaber S.Z. Upper-extremity deep vein thrombosis. Circulation. 2002;106:1874.
50 Bounameaux H., Perrier A., Righini M. Diagnosis of venous thromboembolism: an update. Vasc Med. 2010;15:399–406.
51 Vogel P., Laing F.C., Jeffrey R.B.Jr, et al. Deep venous thrombosis of the lower extremity: US evaluation. Radiology. 1987;163:747.
52 Elliot C.G., Lovelace T.D., Brown L.M., et al. Diagnosis: imaging techniques. Clin Chest Med. 2010;4:641–657.
53 Kalodiki E., Nicolaides A.N. Out of a recent CVI consensus: some features of a basic statement. Int Angiol. 2002;21:2.
54 Min R.J., Khilnani N.M., Golia P. Duplex ultrasound evaluation of lower extremity venous insufficiency. J Vasc Interv Radiol. 2000;14:1233–1241.
55 Stuart W.P., Adam D.J., Allan P.L., et al. The relationship between the number, competence, and diameter of medial calf perforating veins and the clinical status in healthy subjects and patients with lower-limb venous disease. J Vasc Surg. 2000;32:138–143.
56 Miyazaki K., Nishibe T., Kudo F., et al. Hemodynamic changes in stripping operation or saphenofemoral ligation of the greater saphenous vein for primary varicose veins. Ann Vasc Surg. 2004;18:465–469.
57 Nicolaides A.N. Investigation of chronic venous insufficiency: a consensus statement. Cardiovascular Disease Educational and Research Trust; European Society of Vascular Surgery; The International Angiology Scientific Activity Congress Organization; International Union of Angiology; Union Internationale de Phlebologie at the Abbaye des Vaux de Cernay. Circulation. 2000;102:E126–E163.