[level-membership-for-emergency-medicine-category]
9 Useful formulas and information for managing paediatric emergencies
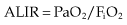
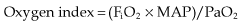
Acid–base balance
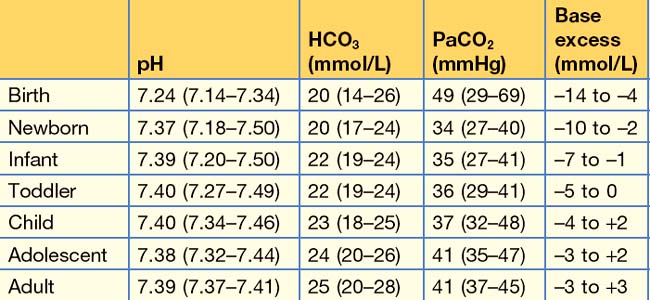
Age-specific normal acid–base values in children
Acid–base values change slightly from the moment of birth until adulthood (Table 9.1). The first hour after birth is characterized by a mixed (predominantly respiratory) acidosis which steadily normalizes in the normal neonate. Preterm neonates may have a lower HCO3 and lower PaCO2 for the first month to 6 weeks of life.
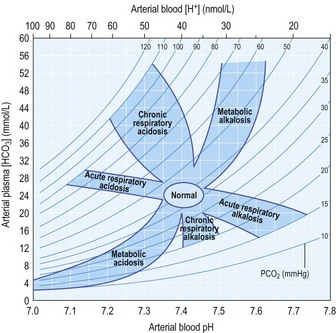
Acid–base diagram
Figure 9.1 can be used to elucidate the nature of an acid–base disturbance by plotting pH against PCO2 or HCO3.
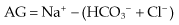
Universal acid–base formula
There is also a ‘rule-of-thumb’ formula that may be used to rapidly assess acid–base status:

There are more specific equations to predict the expected values for compensation in acid–base derangement (Box 9.1).
Box 9.1
Equations to predict compensation in acid–base derangements
Respiratory compensation for metabolic acidosis:

Respiratory compensation for metabolic alkalosis:

Respiratory compensation – simplified formula:

Metabolic compensation for respiratory acidosis:


Metabolic compensation for respiratory alkalosis:


PaCO2 = arterial partial pressure of carbon dioxide (mmHg); Actual HCO3 = actual measured bicarbonate (mmol/L). *Or use age-specific normal values of PaCO2 for a more precise calculation (see table 9.1); †or use age-specific normal values of HCO3 for a more precise calculation (see table 9.1).
Electrolytes and fluids

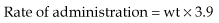
Parkland formula
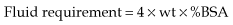
Where fluid requirement (mL) = the total fluid volume to infuse (over and above normal maintenance fluids): half in the first 8 hours from the time of the burn and the second half in the subsequent 16 hours; wt = weight in kg and %BSA = burn surface area as a percentage of total body surface area (see Fig. 1.7).
Respiratory system
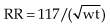
Estimated minute ventilation requirements
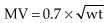
Where MV = minute ventilation (L/min), wt = weight (kg) and RR = ventilator respiratory rate.
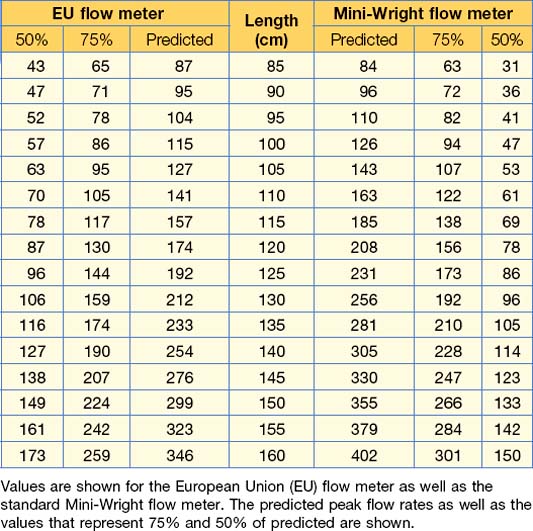
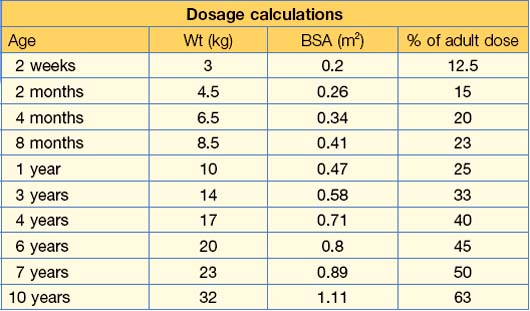
Predicted peak expiratory flow rate
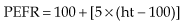
Where PEFR = peak expiratory flow rate (L/min) and ht = height (cm).
This formula approximates the 50th centile for peak expiratory flow rate in children taller than 100 cm. More precise values should be obtained from tables or electronic applications as soon as time permits (Table 9.2).
Cardiovascular system
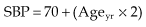
Maximum systolic blood pressure
This formula approximates the 95th centile for systolic blood pressure from age 1 to 18 years.
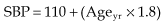
Maximum diastolic blood pressure
This formula approximates the 95th centile for diastolic blood pressure from age 1 to 18 years.
Nervous system
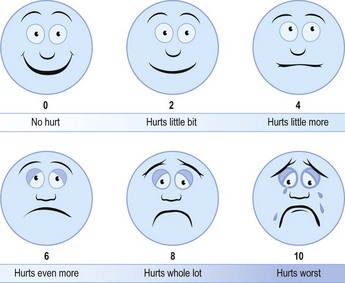
Wong Baker faces
Pain in children is often underestimated by parents and doctors alike. This system (Fig. 9.3) can be used by asking children to point out the face that best represents how they are feeling. A decrease in the indicated pain will provide proof of analgesic efficacy or the need for additional analgesia.
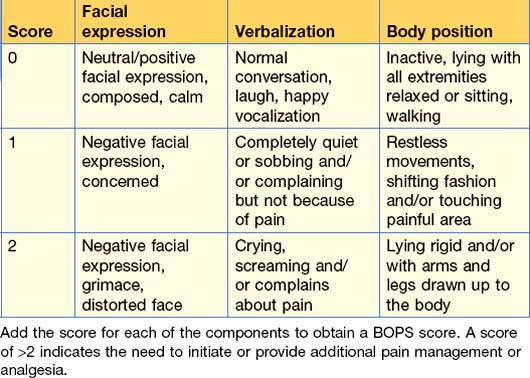
Behavioural observational pain scale (BOPS)
Younger children and infants cannot self-report pain effectively. There are several observational pain systems, of which the BOPS is an example (Table 9.3). A pain scale should be used to obtain an indication of pain or discomfort in young children and the need for analgesia.
Sedation scores
Procedural sedation is a core skill for ED practice and patient safety is of paramount importance in its performance. Although dissociative agents are most frequently used in children (for which there is no sedation scale) other agents need to be used to target a particular level of sedation. The Ramsay (Table 9.4) and American Society of Anaesthesiologists (Table 9.5) sedation scales are useful to evaluate and document sedation levels.
| Score | Response |
|---|---|
| 1 | Anxious or restless or both |
| 2 | Cooperative, orientated and tranquil |
| 3 | Responding to commands |
| 4 | Brisk response to stimulus |
| 5 | Sluggish response to stimulus |
| 6 | No response to stimulus |
Table 9.5 The ASA sedation scale
| Level of sedation | Definition |
|---|---|
| Minimal sedation (anxiolysis) |
• Drug-induced depression of consciousness
• Patients cannot be easily aroused
• Patients respond purposefully following repeated or painful stimulation
• The ability to independently maintain ventilatory function may be impaired
• Patients may require assistance in maintaining a patent airway
• Drug-induced loss of consciousness
• Patients are not arousable even by mild painful stimulation
• Ability to independently maintain ventilatory function is often impaired
• Patients often require assistance to maintain a patent airway
• Positive pressure ventilation may be required due to depressed spontaneous ventilation and drug-induced depression of neuromuscular function
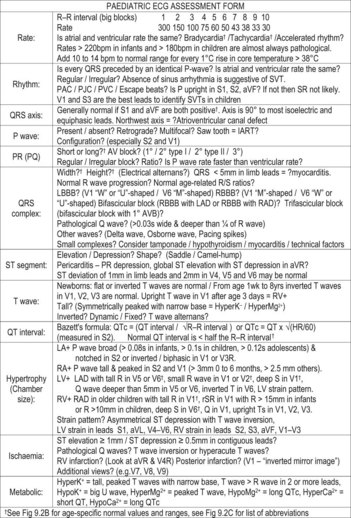
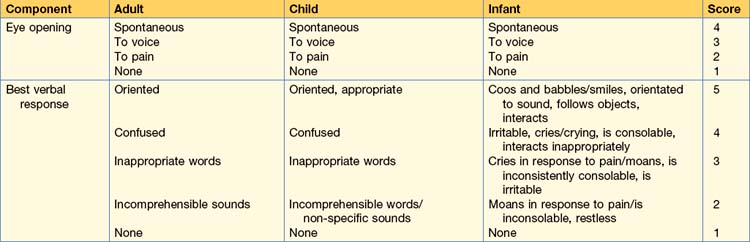
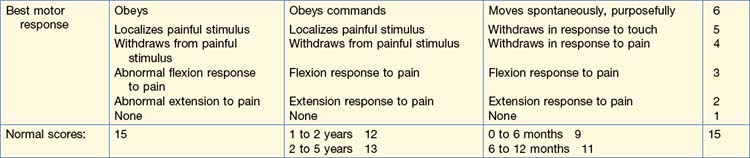
Paediatric Glasgow Coma Scale
The adult Glasgow Coma Scale (GCS) has been modified for application to infants and children (Table 9.6).
Spinal nerve root assessment
Accurate evaluation of spinal cord function or injury is essential after trauma in children. Sensory and motor maps (Table 9.7) allow for determination of the level of spinal cord injury as well as the exclusion of spinal cord injury by examining the function of the spinal nerve roots.
Table 9.7 The sensory and motor pathways to map out the testing of spinal nerve roots
| Dermatome map (sensory function) | Myotome map (motor function) |
|---|---|
C5 – abduction at shoulder (deltoid muscle)
C6 – flexion at elbow (biceps muscle) and extension at wrist (wrist extensors)
C7 – extension at elbow (triceps muscle)
C8 – flexion of distal interphalangeal joint of middle finger (flexor digitorum profundus)
T1 – abduction of little finger (abductor digiti minimi)
L2 – flexion at the hip (psoas and iliacus)
L3, L4 – extension at the knee (quadriceps)
L4, L5, S1 – flexion at the knee (hamstrings)
L5 – dorsiflexion of ankle and hallux (tibialis anterior, extensor hallucis longus)
Body composition
Body surface area
Both Mosteller’s formula and Haycock’s formula may be used for children.


Where BSA = body surface area (m2), wt = weight (kg) and ht = height (cm).


Conversions
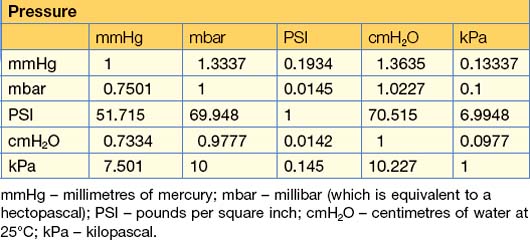
Measurements of pressure
In Table 9.10, find the row of the unit that you wish to convert from and follow it across to the unit that you wish to convert to. Multiply by that factor to convert to the new unit.
Laboratory test units
See Table 9.11 for conversion factors applicable to lab results.
Table 9.11 Conversion factors for SI and non-metric units of measurement for laboratory investigations commonly used in the ED
| Laboratory units | ||
|---|---|---|
| Bilirubin | 1 µmol/L = 0.058 mg/dL | 1 mg/dL = 17.2 µmol/L |
| Calcium | 1 mmol/L = 4 mg/dL | 1 mg/dL = 0.25 mmol/L |
| Cholesterol | 1 mmol/L = 38.61 mg/dL | 1 mg/dL = 0.0259 mmol/L |
| Creatinine | 1 µmol/L = 0.013 mg/dL | 1 mg/dL = 76.9 µmol/L |
| Glucose | 1 mmol/L = 18.02 mg/dL | 1 mg/dL = 0.055 mmol/L |
| Lactate | 1 mmol/L = 9.01 mg/dL | 1 mg/dL = 0.111 mmol/L |
| Magnesium | 1 mmol/L = 2.43 mg/dL | 1 mg/dL = 0.412 mmol/L |
| Phosphate | 1 mmol/L = 3.1 mg/dL | 1 mg/dL = 0.323 mmol/L |
| Urea | 1 mmol/L = BUN 2.8 mg/dL | 1 mg/dL BUN = 0.357 mmol/L |
Steroid equivalence
• Hydrocortisone – short acting with a relative potency of 1.
• Prednisone or prednisolone – intermediate acting with a relative potency of 4.
• Dexamethasone – long acting with a relative potency of 25.
• Betamethasone – long acting with a relative potency of 30.
• Triamcinolone – intermediate acting with a relative potency of 5.
Opioid equivalence
• Morphine 10 mg – duration of action 3 to 4 hours.
• Diamorphine 5 mg – duration of action 3 to 4 hours.
• Fentanyl 0.1 mg – duration of action 1 hour.
• Alfentanil 1 mg – duration of action 20 minutes.
• Tramadol 100 mg – duration of action 4 to 6 hours.
• Pethidine (meperidine) 75 mg – duration of action 2 to 3 hours.
Miscellaneous
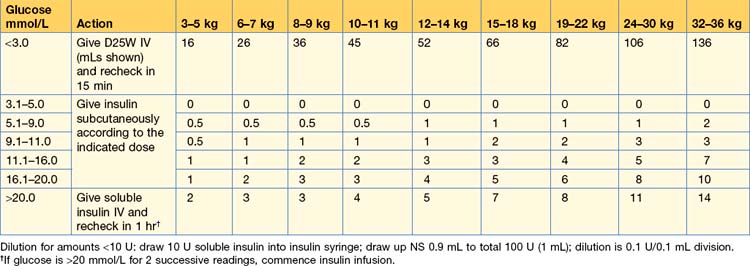
Insulin infusion
An insulin infusion at 0.1 U/kg/hr is, in general, preferable to an insulin sliding scale. There are times when a sliding scale is required and Table 9.12 is an example of one such scale.
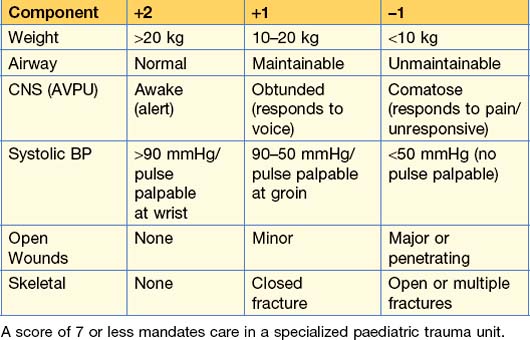
Paediatric trauma score
Early objective assessment of the severity of injury (see Table 9.13) is an essential component of managing the paediatric trauma victim in the ED. Severely injured children should ideally be treated at a facility that specializes in treating children as outcomes are better.
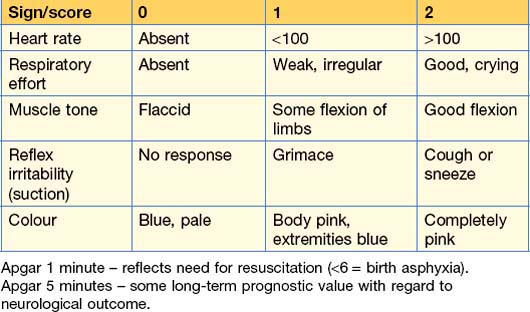
APGAR score
The APGAR score (Table 9.14) is useful, and of particular relevance, for neonates that are born in the ED as unplanned or unexpected deliveries.
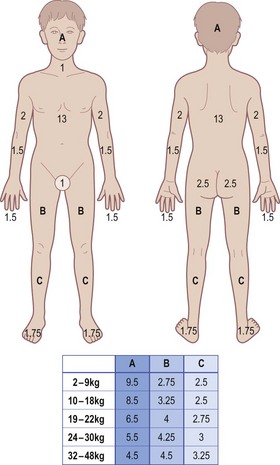
Lund and Browder Chart
The Lund and Browder chart (Fig. 9.4) is used to accurately determine burn surface area in infants and children of all ages. The relative contribution of head and lower limbs to total body surface area changes with increasing age, as is shown on the chart. The total burn surface area is obtained from the sum of each component area affected by the burn.
[/level-membership-for-emergency-medicine-category][not-level-membership-for-emergency-medicine-category]
9 Useful formulas and information for managing paediatric emergencies
Acid–base balance
Age-specific normal acid–base values in children
Acid–base values change slightly from the moment of birth until adulthood (Table 9.1). The first hour after birth is characterized by a mixed (predominantly respiratory) acidosis which steadily normalizes in the normal neonate. Preterm neonates may have a lower HCO3 and lower PaCO2 for the first month to 6 weeks of life.
Acid–base diagram
Figure 9.1 can be used to elucidate the nature of an acid–base disturbance by plotting pH against PCO2 or HCO3.
Universal acid–base formula
There is also a ‘rule-of-thumb’ formula that may be used to rapidly assess acid–base status:
There are more specific equations to predict the expected values for compensation in acid–base derangement (Box 9.1).
Box 9.1
Equations to predict compensation in acid–base derangements
Respiratory compensation for metabolic acidosis:
Respiratory compensation for metabolic alkalosis:
Respiratory compensation – simplified formula:
Metabolic compensation for respiratory acidosis:
Metabolic compensation for respiratory alkalosis:
PaCO2 = arterial partial pressure of carbon dioxide (mmHg); Actual HCO3 = actual measured bicarbonate (mmol/L). *Or use age-specific normal values of PaCO2 for a more precise calculation (see table 9.1); †or use age-specific normal values of HCO3 for a more precise calculation (see table 9.1).
Electrolytes and fluids
Parkland formula
Where fluid requirement (mL) = the total fluid volume to infuse (over and above normal maintenance fluids): half in the first 8 hours from the time of the burn and the second half in the subsequent 16 hours; wt = weight in kg and %BSA = burn surface area as a percentage of total body surface area (see Fig. 1.7).
Respiratory system
Estimated minute ventilation requirements
Where MV = minute ventilation (L/min), wt = weight (kg) and RR = ventilator respiratory rate.
Predicted peak expiratory flow rate
Where PEFR = peak expiratory flow rate (L/min) and ht = height (cm).
This formula approximates the 50th centile for peak expiratory flow rate in children taller than 100 cm. More precise values should be obtained from tables or electronic applications as soon as time permits (Table 9.2).
