Chapter 17 Use of the Cropping Tool to Show Structures of Interest
Aortic Valve Cropping: Transesophageal Imaging
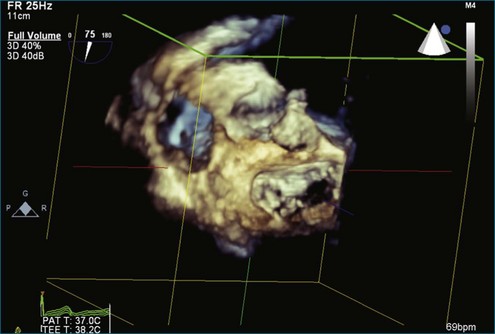
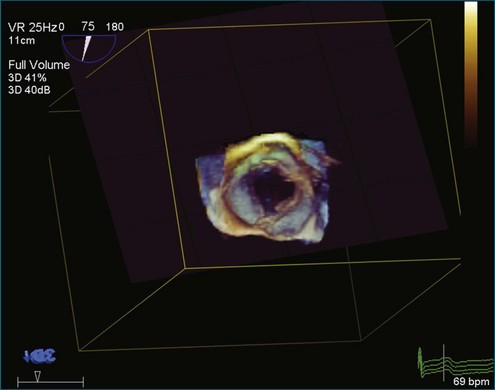
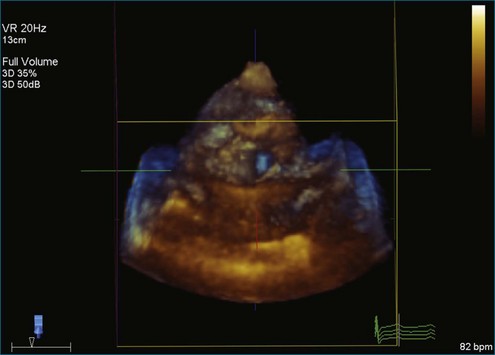
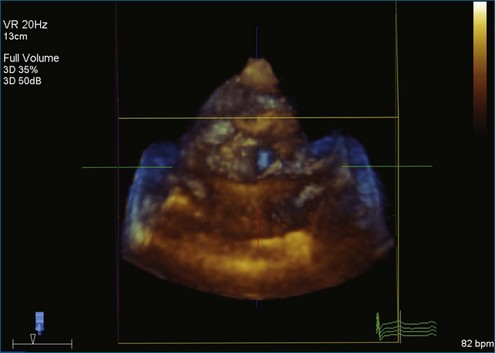
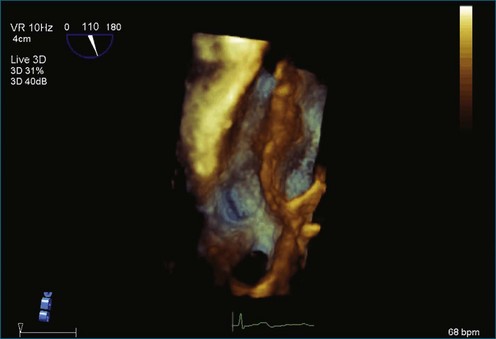
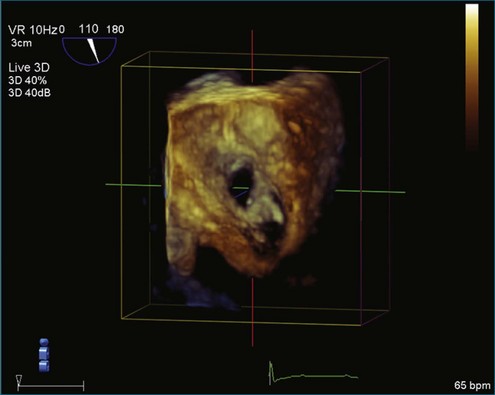
Figure 17-1 (Video 17-1) shows the starting point.
Steps
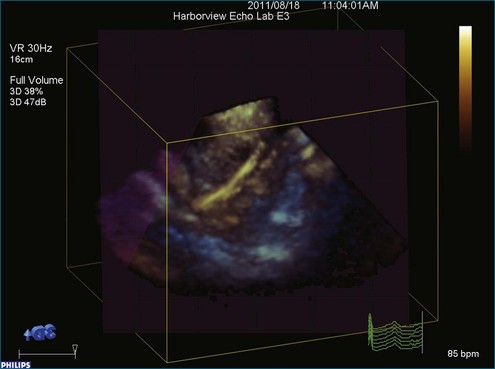
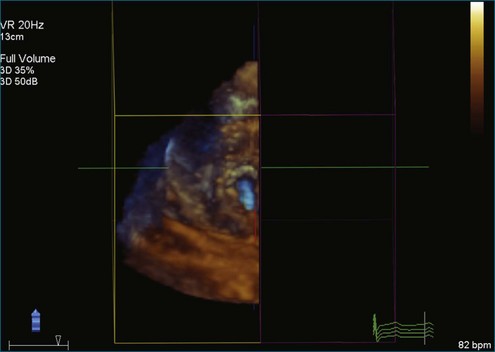
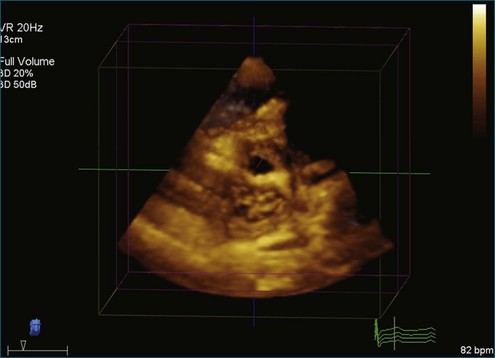
Step 1 (Figure 17-2; Video 17-2): Obtain the full volume of the aortic valve. The initial approach is to image the aortic valve in the standard short-axis transesophageal echocardiography (TEE) view. This view typically has the rotational angle at 30 degrees. In this case, the rotational angle is at 75 degrees. When the aortic valve is well visualized, a full volume is obtained.
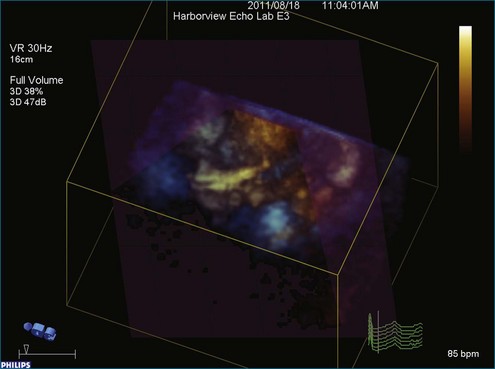
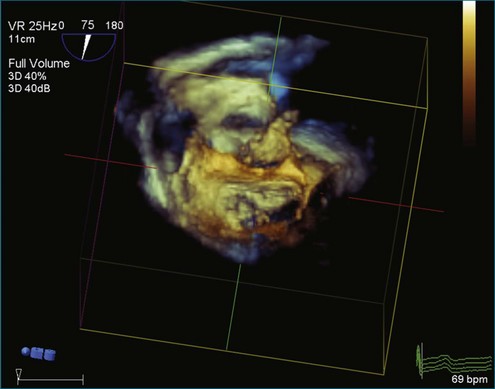
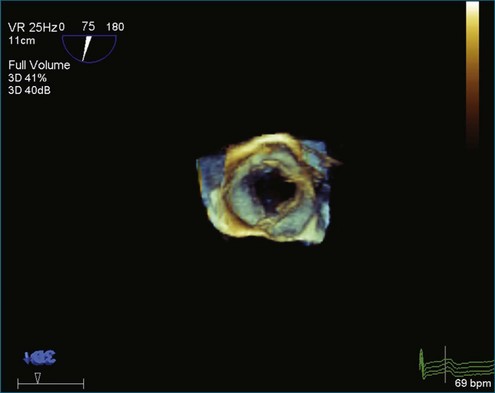
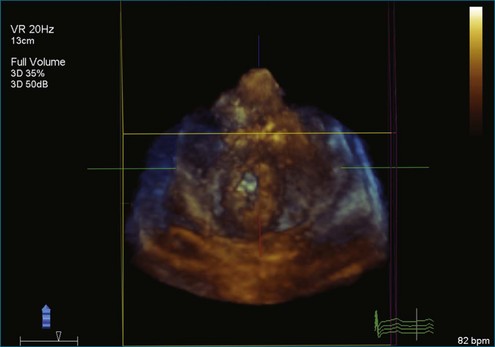
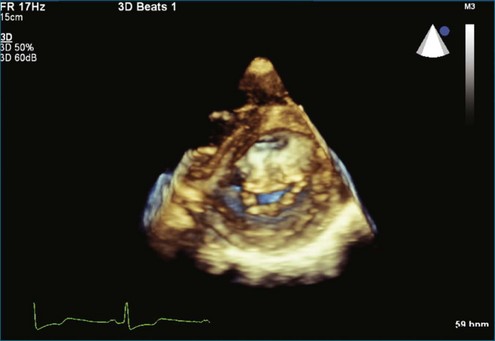
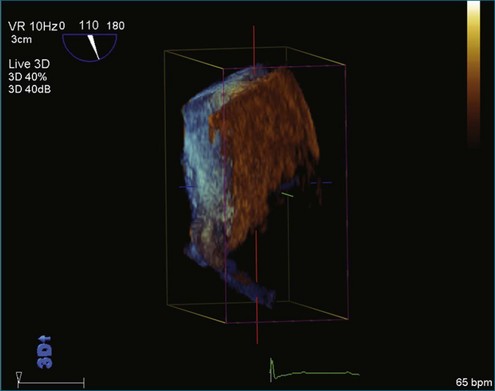
Step 2 (Figure 17-3; Video 17-3): After obtaining the full volume, pull the dataset down toward the user with the track ball or mouse.
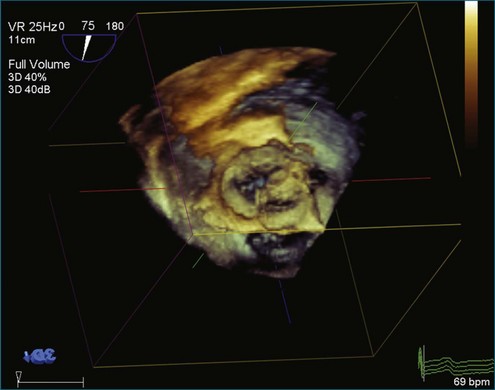
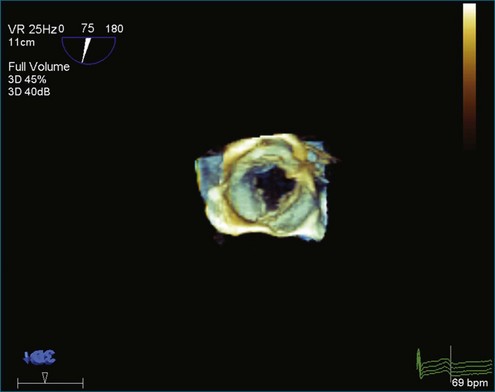
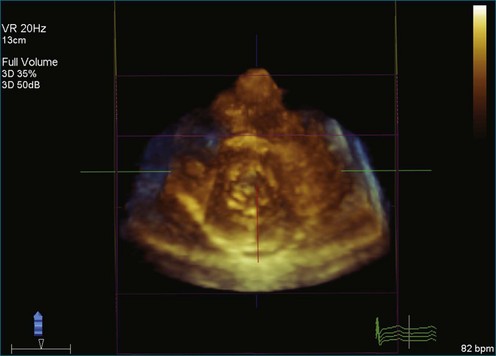
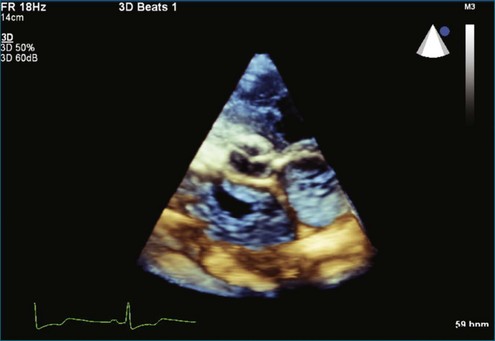
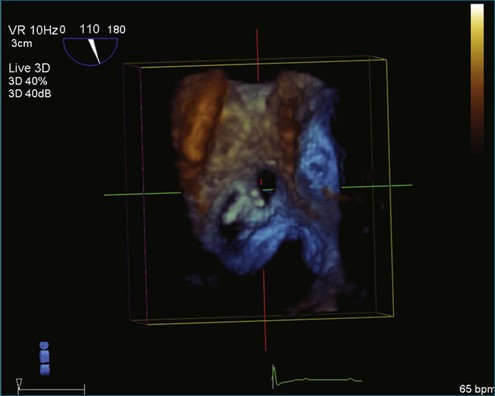
Step 3 (Figure 17-4; Video 17-4): Maximize and minimize all the cut planes (X, Y, and Z) to the annulus of the aortic valve cusps.
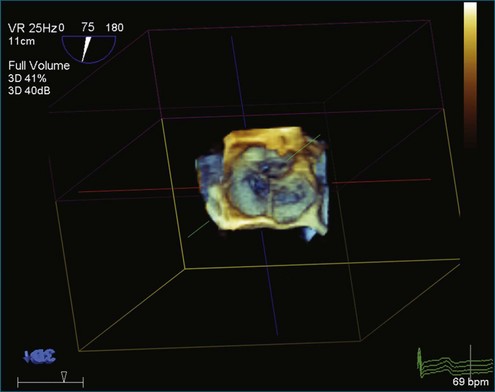
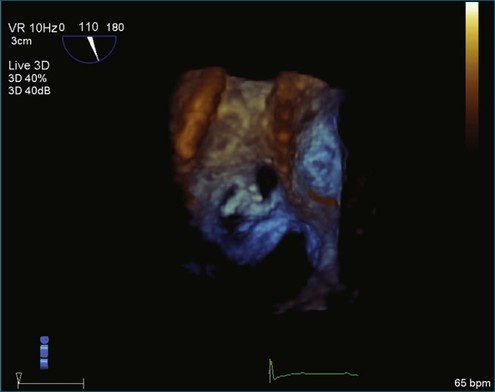
Step 4 (Figure 17-5; Video 17-5): Activate “Any Plane” by clicking on “Crop Adjust Plane.” Position “Any Plane” to the upper right corner of the right coronary cusp annulus and slide the plane adjust bar one third to the left.
Step 5 (Figure 17-6; Video 17-6): Remove the crop box and “Any Plane” by clicking on the “Crop Adjust Plane” button.
Step 6 (Figure 17-7; Video 17-7): Optimize the image by clicking on the “B/W” tab and sliding the Gain, Brightness, Compression, and Smoothing bars until the desired appearance is achieved.
Mitral Valve: Transthoracic Imaging
Figure 17-8 (Video 17-8) is a setup view showing parasternal long-axis view of the mitral valve and left atrium.
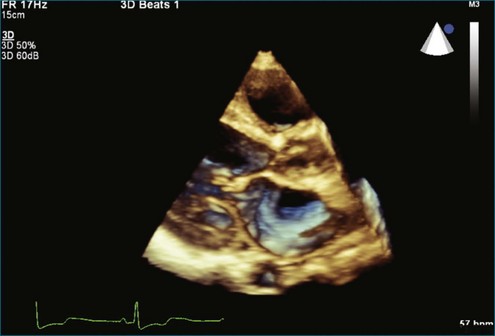
Figure 17-8 Setup view for obtaining full volume of the left ventricle, the left atrium, and the mitral valve.
Steps
Step 1 (Figure 17-9; Video 17-9): Begin with the parasternal long-axis view and obtain a full volume.
Step 2 (Figure 17-10; Video 17-10): Rotate the volume rightward to be en face with the X plane.
Step 3 (Figure 17-11; Video 17-11): Maximize the Z plane to visualize the mitral valve in the short-axis view. That is, when the image initially is called up, it is auto-cropped such that the dataset has the Z plane partially moved in. By maximizing the Z plane, the entire volume is now seen.
Step 4 (Figure 17-12; Video 17-12): Adjust or minimize the X plane to best see the leaflets.
Step 5 (Figure 17-13; Video 17-13): Alternatively, turn the volume from 3 completely around to see the mitral valve from the atrial side, pull the volume up slightly, and adjust “X Max” to best see the leaflets.
Figures 17-14 to 17-16 (Videos 17-14 to 17-16) show the resulting images of the mitral valve on the left atrial and left ventricular sides of the valve.
Tricuspid Valve: Transthoracic Imaging
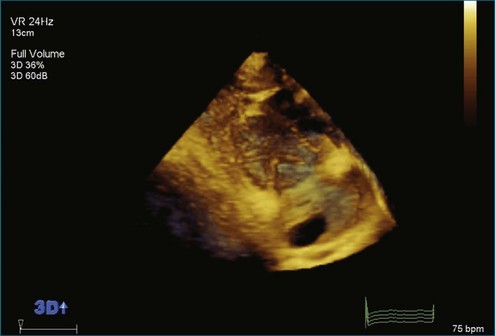
Figure 17-17 (Video 17-17) shows the starting point—full volume of the right ventricle (RV), the tricuspid valve, and the right atrium.
Steps
Step 1 (Figure 17-18; Video 17-18): The image shows the full volume acquired in the parasternal long-axis view. From the full volume that is auto-cropped, maximize the tricuspid valve to full volume from the parasternal long-axis view by maximizing the Z plane.
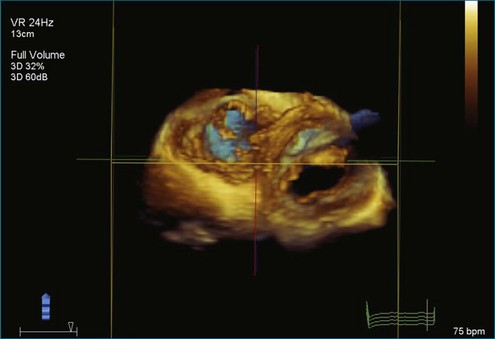
Step 2 (Figure 17-19; Video 17-19): Rotate the full volume rightward to be en face with the X plane.
Step 3 (Figure 17-20; Video 17-20): Minimize the X plane to the edge of the tricuspid valve annulus.
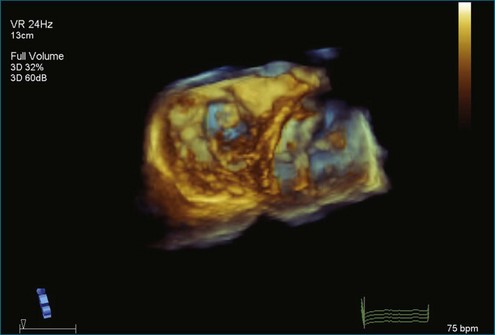
Step 4 (Figure 17-21; Video 17-21): Minimize the Y plane to one third of the volume just above the leaflet tips.
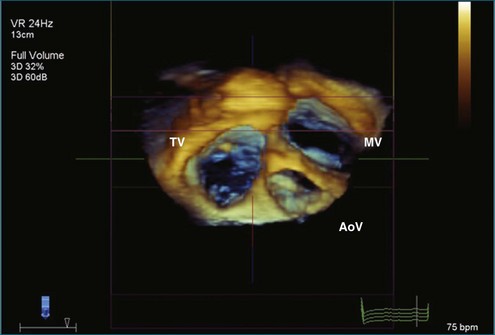
Step 5 (Figure 17-22; Video 17-22): Pull the volume down to show the tricuspid valve and the mitral valve en face from the ventricular side.
Step 6 (Figure 17-23; Video 17-23): Remove the crop box by clicking on “Crop Adj Box.”
Step 7 (Figure 17-24; Video 17-24): To view from the atrial side, pull the volume up to view along the X plane and crop the max back along the X plane to show the tricuspid valve, the mitral valve, and the aortic valve. (Note that the tricuspid valve is on the left side of the volume.)
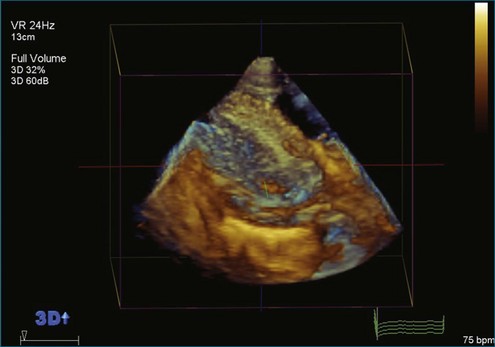
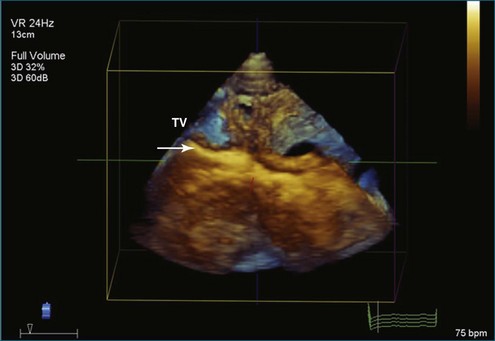
Figure 17-19 Rotating the full volume rightward to be en face with the X plane. TV, tricuspid valve.
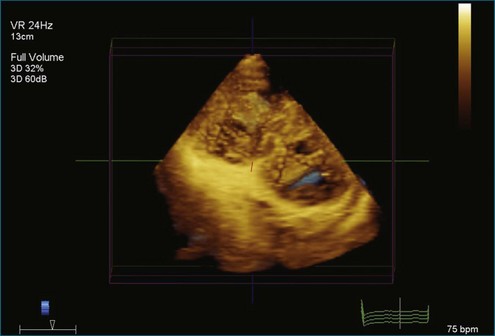
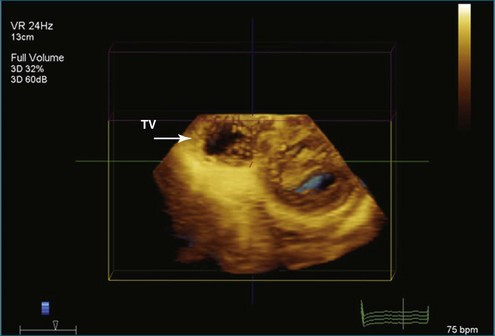
Figure 17-21 Minimizing the Y plane down to one third of the volume (i.e., just above the leaflet tips). TV, tricuspid valve.
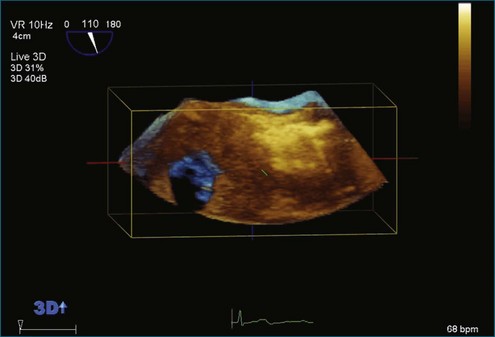
Superior Vena Cava: Transesophageal Three-Dimensional Zoom View of the Interatrial Septum
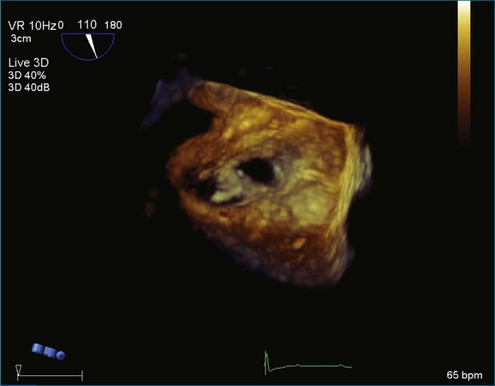
Figure 17-25 (Video 17-25) shows the starting point.
Steps
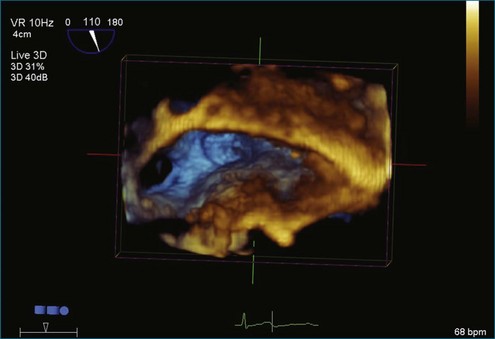
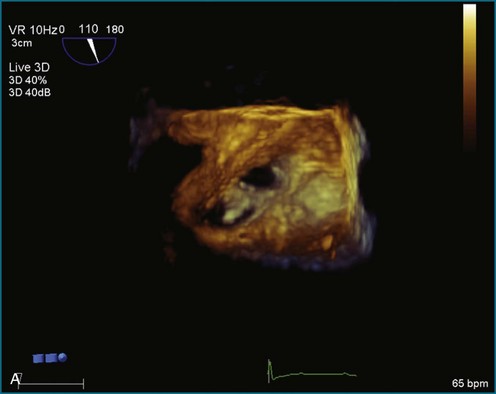
Step 1 (Figure 17-26; Video 17-26): Rotate the volume upward to view the Y plane en face.
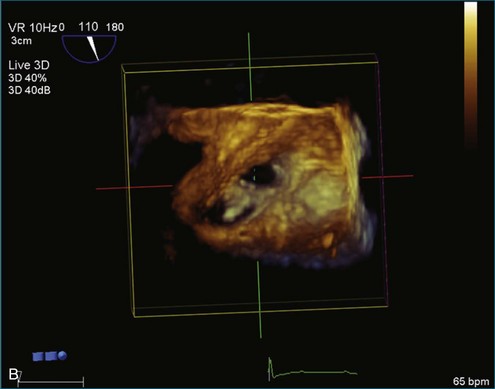
Step 2 (Figure 17-27; Video 17-27): Rotate the volume counterclockwise 90 degrees so the X plane is vertical.
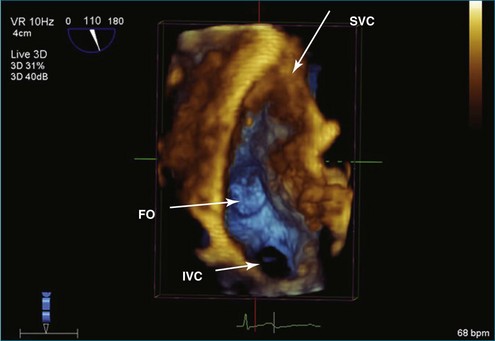
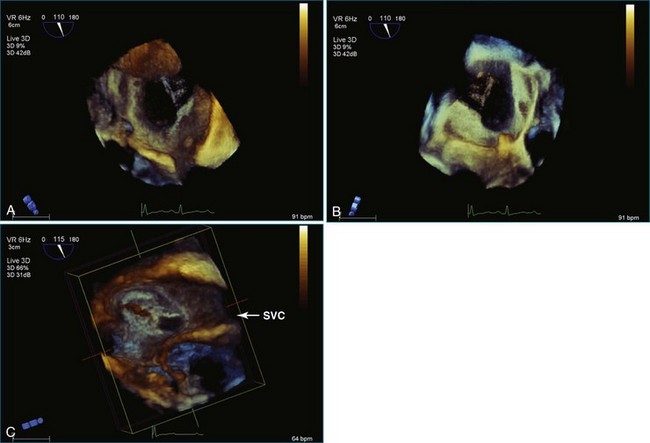
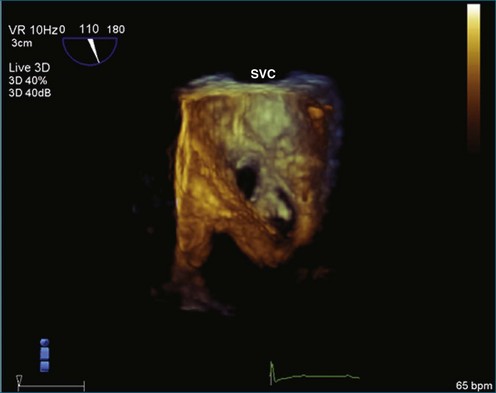
Step 3 (Figure 17-28; Video 17-28): Crop back from Y max to view the superior vena cava (SVC) (approximately halfway back), the lumen of the inferior vena cava (IVC), and the fossa ovalis.
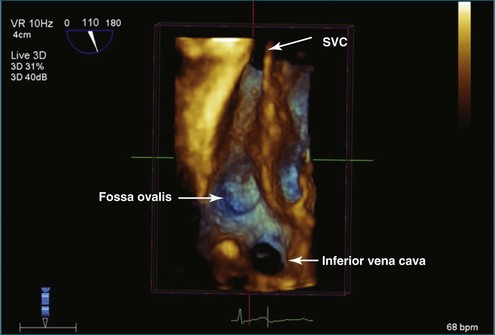
Step 4 (Figure 17-29; Video 17-29): Adjust the gains for the desired appearance of vessels.
Atrial Septal Defect Cropping
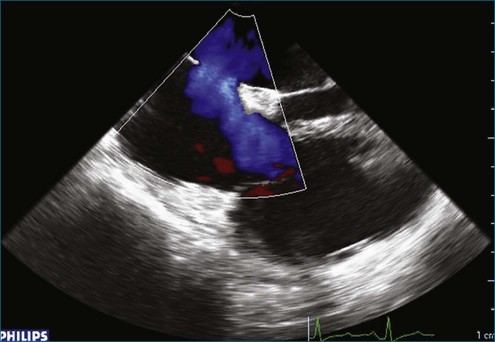
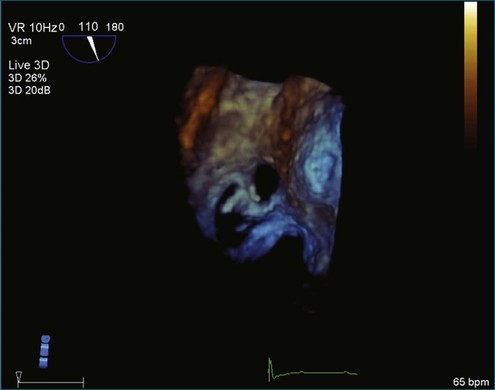
Figure 17-30 (Video 17-30) shows a 2DTEE image with color flow through the atrial septal defect (ASD) before 3D cropping.
Version 1
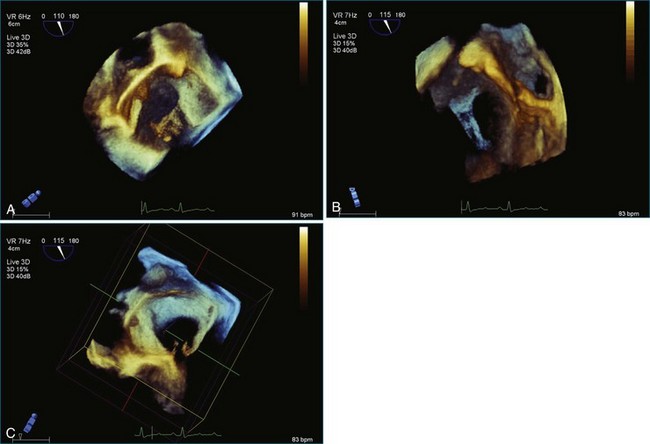
Step 1: Figure 17-31 (Video 17-31) shows the start position in original live 3D capture.
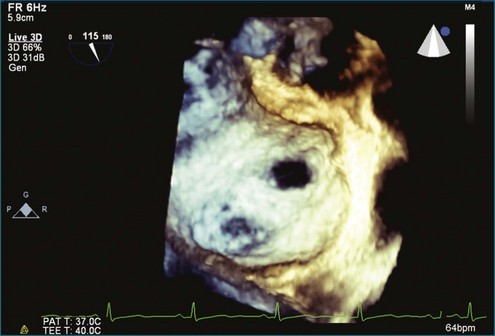
Step 2 (Figures 17-32 and 17-33; Videos 17-32 and 17-33): From the live 3D image, push the volume up to view the right atrial side of the septum. Pull the volume down to visualize the left atrial side of the septum. Maximize and minimize the Y plane to optimize the image. Note the Chiari network.
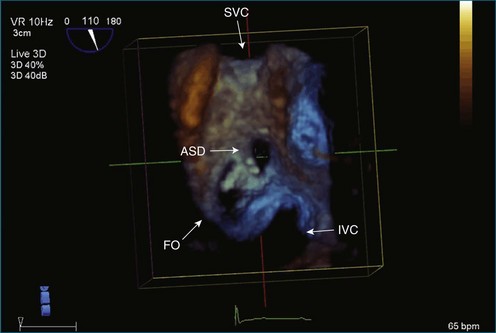
Step 3 (Figure 17-34; Video 17-34): Rotate counterclockwise 30 degrees or until the SVC and IVC are aligned vertically, with the SVC superior and the IVC inferior. This particular view is ideal for catheter deployment of closure devices. This shows the ASE and the aneurysmal or outpouching of the fossa ovalis of the septum. It also shows the anatomic correlation between the fossa ovalis and the typical secundum ASD.
Step 4 (Figure 17-35; Video 17-35): This shows the surface SVC, with Gain down.
Step 5 (Figure 17-36; Video 17-36): A grid overlay is used to show the size of the defect.

Version 2
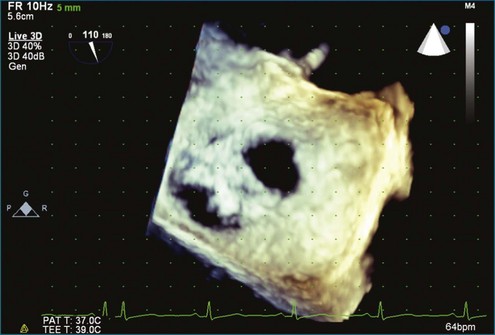
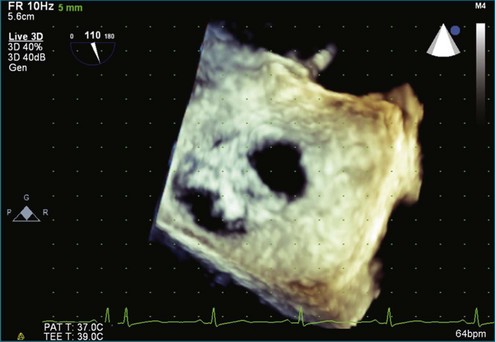
Figures 17-37 and 17-38 (Video 17-37) show 3DTEE baseline images of the ASD before any cropping.
Step 1 (Figure 17-39; Video 17-38): Rotate 90 degrees counterclockwise in the same plane (around the Y plane).
Step 2: Figure 17-40 (Video 17-38) shows the result of rotation.
Step 3: Figure 17-41 (Video 17-39) shows the crop box turned on.
Step 4 (Figure 17-42; Video 17-40): Begin clockwise rotation around the X axis, in this case halfway from the left atrial side to the right atrial side.
Step 5 (Figure 17-43; Video 17-41): Complete the rotation from the left atrial side to the right atrial side. Now view the right atrial side.
Step 6 (Figure 17-44; Video 17-42): The crop box has been turned off.
Step 7 (Figure 17-45; Video 17-43): Adjust the image slightly. Gain initially is at 40, Brightness at 40, 3D Compress at 40, and 3D Smoothing at 5. In this case, Gain has been turned down, Brightness up, Compress down, and Smoothing up. Final numbers are Gain at 26, Brightness at 46, 3D Compress at 19, and 3D Smoothing at 8.
Step 8: Figure 17-46 is an additional image of the ASD, with grid overlay showing the diameter as roughly 10 × 10 mm.
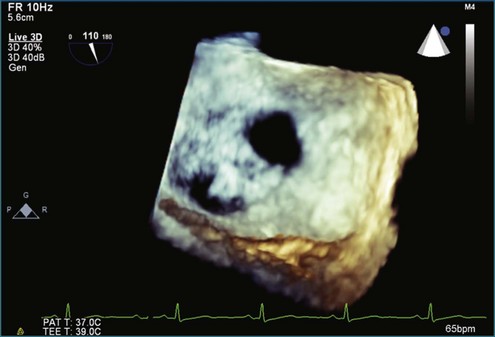
Figure 17-37 Three-dimensional transesophageal echocardiography baseline images of the atrial septal defect before any cropping.
Right Ventricular Pacemaker: Cropping to Show the Pacemaker
Steps
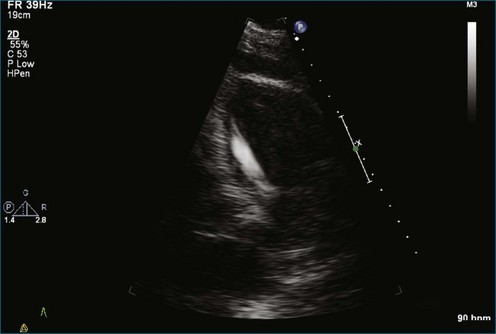
Note the 2D image of the right ventricular pacemaker lead (Figure 17-47; Video 17-44).
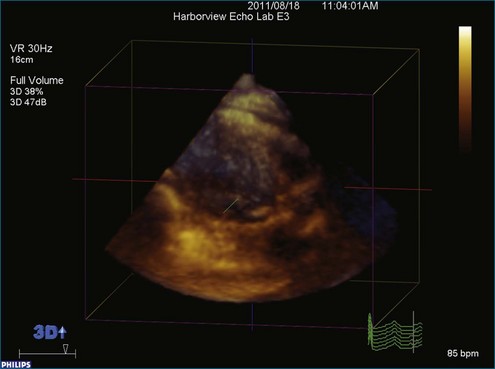
Step 1 (Figure 17-48; Video 17-45): Begin with the parasternal long-axis view and obtain a full volume.
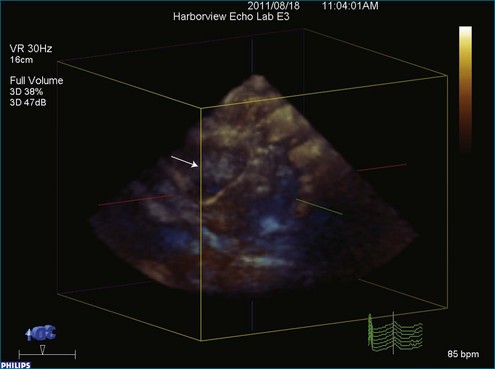
Step 2 (Figure 17-49; Video 17-46): Rotate the entire volume set to show the pacemaker. In this case, the dataset is rotated around the Y axis; counterclockwise rotation allows visualization of the pacemaker.
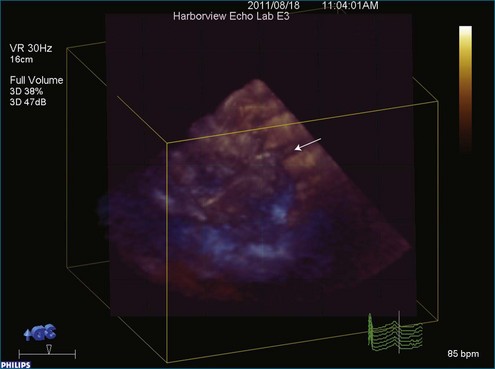
Step 3 (Figure 17-50; Video 17-47): The free plane, sometimes referred to as “any plane,” is positioned to cut diagonally into the dataset. An attempt is made to position the free plane at a diagonal angle such that when cutting into the dataset, the cut plane moves toward the pacemaker and removes “tissue” running parallel to the pacer.
Step 4 (Figure 17-51; Video 17-48): The free plane is locked into a fixed angle and advanced into the dataset toward the pacemaker. As can be seen in the image, the pacemaker is becoming more visible. Note that the tip of the pacemaker does not seem to reach the apex of the right ventricle.
Step 5 (Figure 17-52; Video 17-49): The free plane has been locked in position after moving into an optimal position. After locking the free plane so that it cannot advance further, the entire crop box can be rotated to see what degree of rotation allows optimal visualization of the pacemaker.