[level-membership-for-neurology-category]
Use of medical imaging in neurorehabilitation
ROLANDO T. LAZARO, PT, PhD, DPT, GCS and DARCY A. UMPHRED, PT, PhD, FAPTA
After reading this chapter the student or therapist will be able to:
1. Recognize the various ways the brain can be labeled according to the slice and what differences in the types of cuts help identify the slice or image.
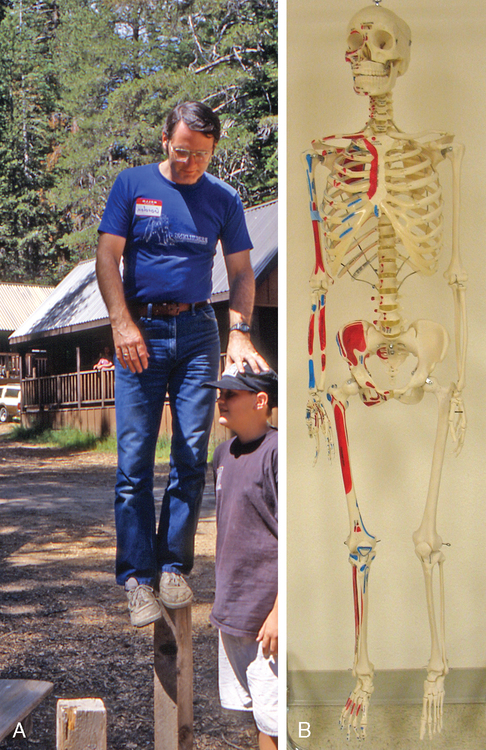
2. Transition from viewing a subject in various spatial positions to seeing the skeletal frame in that position to visually recognizing the entire nervous system when the subject is placed in the same position.
3. Recognize various slices of the central nervous system; what nuclear masses are visible in that slice; how the ventricles change from one slice to another; and how sagittal, horizontal, and coronal slices present those nuclear masses and/or ventricles differently.
4. Recognize the difference in diagnostic capabilities of radiography, computed tomography (CT), magnetic resonance imaging (MRI), and nuclear medicine scans.
5. Identify neuroradiological descriptive terminology.
6. Recognize normal and abnormal neuroanatomy on radiographs, CT scans, and MRI images.
7. Analyze information obtained from imaging of the central nervous system and integrate this information into the neurological clinical presentation and the patient’s intervention.
8. Recognize and analyze how a medical diagnosis using imaging may and may not be reflected in the movement diagnosis made by a physical or occupational therapist.
The increasingly complex role of physical and occupational therapy practitioners in health care delivery has increased the need for these clinicians to acquire knowledge and skills that will further enhance their ability to make appropriate decisions involving patient/client management. The recognition of direct access practice in many states and the increasing role of physical and occupational professionals as primary care providers have heightened the need for these clinicians to recognize and analyze how different medical tests and procedures affect movement and function. This differential analysis is critical in order for these professionals to know when to refer a client to another health care practitioner, when to refer and treat, when to merely treat, and when to neither refer nor treat (see Chapter 7).
Indeed, with the advent of doctoral education in physical and occupational therapy, entry-level knowledge of content such as pharmacology, radiology, and medical screening has become an accreditation requirement. Therapists are recognizing the value of information obtained from medical imaging studies in the appropriate delivery of physical and occupational therapy services. Orthopedic radiology is now a common part of curricula; however, content on neuroradiology, more specifically the application of neuroradiology in practice, is lacking. In a study by Little and Lazaro,1 it was found that many of the physical therapy practitioners in California use medical imaging in their practice. When looking at the types of imaging, the majority of respondents felt comfortable using results (and radiology reports) from radiographs obtained because of a musculoskeletal problem. This study showed the lack of access to and confidence in using medical images of the central nervous system (CNS).
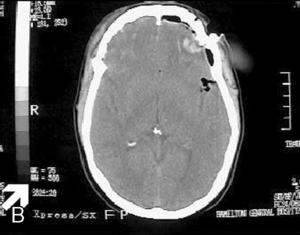
In certain instances it may be easier for therapists to recognize musculoskeletal problems when viewing medical images because the abnormality in the structure directly correlates with what is manifesting as a movement problem. When images of the CNS are viewed, these correlations may be much more complex owing to the relationship of nuclei, tract systems, ventricular balance, and basic neurochemistry. For example, when looking at a bone fracture (Figure 37-1, A) versus a vascular insult (Figure 37-1, B), it is clear that the fracture and its effects on the bone, muscle, or skin can easily be visualized and interpreted. The second image of the CNS has many surrounding structures that must be identified in relation to the vascular insult.
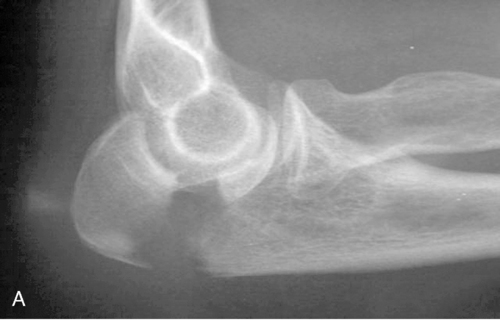
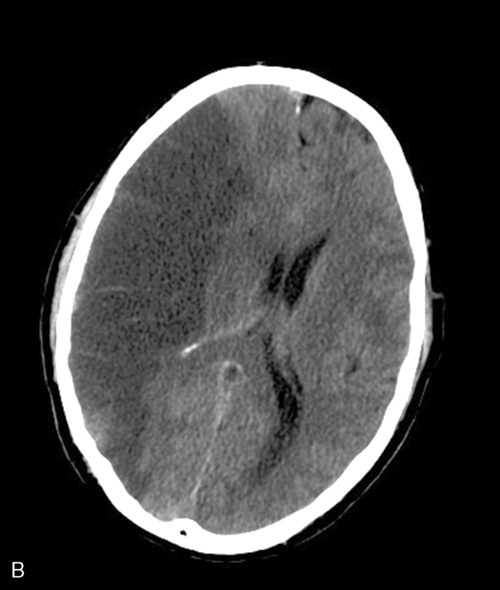
 A, Radiograph showing a fractured olecranon. B, Computed tomography scan showing an infarct of the middle cerebral artery. (B from Wikipedia. http://en.wikipedia.org/wiki/File:INFARCT.jpg.)
In 2007 the journal Physical Therapy produced a special issue on neuroradiology in physical therapy practice. It is encouraging to note that this issue offered physical therapy clinicians an opportunity to understand the modalities used in the imaging of the brain and the spinal cord (for details, see the article by Kimberley and Lewis2). However, the rest of the articles presented the application of neuroradiology in physical therapy research,3,4 and although these articles provided valuable information for the practicing clinician, the articles did not specifically give insights as to how clinicians can use knowledge of neuroradiology in their actual patient/client management.
Visualizing the central nervous system
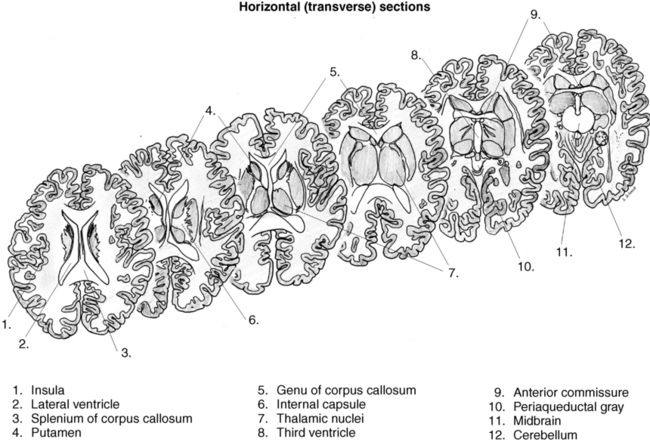
Before jumping into viewing images of the nervous system, the reader needs to be very familiar with the position and type of slices presented in those images. Figure 37-2 illustrates the three types of slices common to the nervous system. The horizontal slices shown in Figure 37-3 are cuts made horizontally through the brain beginning with a superior slice at the level of the beginning of the lateral ventricles. This individual would be lying supine if the brain were cut as shown. If a person were standing, the horizontal slice would be horizontal to the ground with the frontal lobes facing forward (toward the nose) and the occipital lobe in the back. The slices cut horizontally are always perpendicular to the brain stem and spinal cord or perpendicular to the upright position of the brain regardless of the position of the head in space. All right and left slices will look exactly the same as long as the nervous system has not sustained any insult. Figure 37-4 shows the position of an upright human and what the skeleton would look like in the same position. Can you visualize what the horizontal slices would look like? The horizontal section would be perpendicular to this upright position. When viewing radiological slices in horizontal, the slices will often be on a slight angle with the lower portion slightly forward. Most of these films are taken when individuals are supine, which places the brain off vertical so a correction is made. The film usually slices horizontally through the brain as if the head were slightly tucked, similar to the image of the adult in Figure 37-4, A. Also, some radiologists want a slightly different angle to the slice because they are looking for specific orientations. When viewing these films, try to look at the radiological slice pattern (scanogram), if shown. Figure 37-3 shows a progression of horizontal slices as if the individual were supine and the slices began anteriorly with emphasis on ventricular changes as part of the progression. Many of the medical images of the brain are viewed as horizontal (or axial) slices or views. The person is lying supine when undergoing computed tomography (CT), magnetic resonance imaging (MRI), or positron emission tomography (PET). Therefore the imaging process cuts 90 degrees off the horizontal plane of earth in order to achieve horizontal slices of the brain. Remember to look at the scanogram, if available, to identify the position of the head in relation to the cuts.
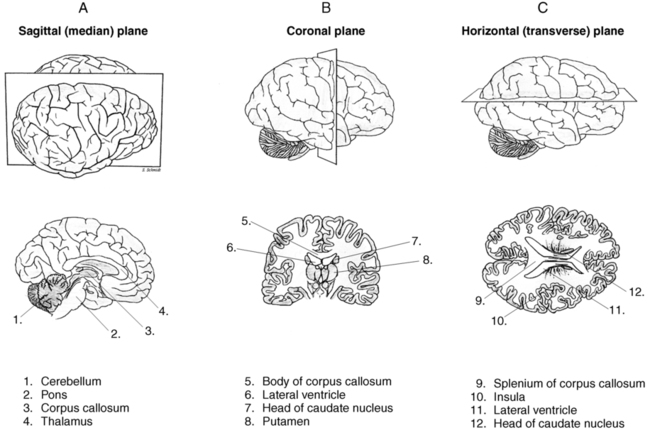


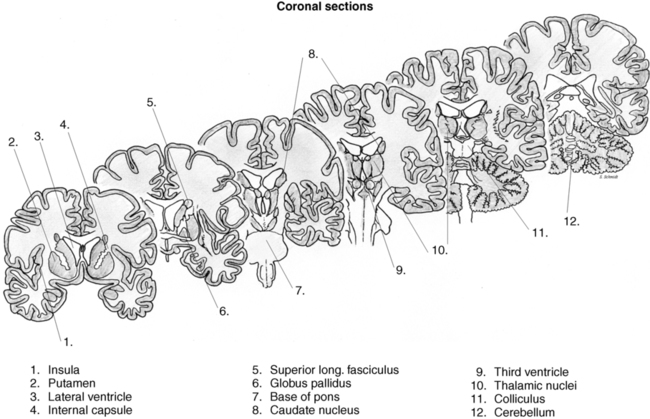
Coronal slices in the right hemisphere look similar to those in the left hemisphere except that the top of the slice will not look like the bottom on either side (see Figure 37-2). The two sides will reflect each other, with the tops being alike as well as the bottoms. Depending on where the cut is made, the result will be cortex on the outside, tracts (white matter) projecting downward, and gray matter again inferior and medial within the slices as the thalamus, basal ganglia, caudate, hippocampus, and so on are viewed. These slices begin at the top and cut down through both sides of the brain, with the slice ending on the inferior section. The progression of the slides can go from front (frontal lobe) to back (occipital lobe) or back to front. If visualized in a standing subject, the slice would begin in the superior frontal area and slice downward through the brain toward the feet, thus cutting equally on both sides. These slices can proceed in the posterior (backward) direction of the brain but always cutting from the top toward the bottom with equal distribution on each side. Figure 37-5 progresses from the front of the brain toward the back using the ventricles as a point of reference.

For sagittal cuts (see Figure 37-2), most cuts start by slicing down through the central fissure separating both sides of the brain. This cut is called a midsagittal section. Each sagittal slice proceeds outward toward the lateral aspect of the brain on each side respectively, depending on which side is being sliced. Anatomically, you begin as if you were slicing down through the middle of the face and the back of the head when a person is standing. Each sagittal slice moves from the inside outward toward the ear or laterally away from the midsagittal slice. Each slice cuts though the front and back of the brain from top to bottom and proceeds from medial to lateral. Sagittal images usually begin on either the right or the left side and continue slicing toward the middle to the midsagittal section separating the two sides of the brain, and then proceed toward the outside on the opposite side of the brain from the beginning slice.
Imaging of the central nervous system
It is beyond the scope of this chapter to discuss the physics behind the more common imaging modalities (see article by Kimberley and Lewis2 for background). The purpose of this chapter is to provide the clinician a method of systematically evaluating medical images of the CNS, and, more important, to provide examples of how clinicians can use these images to guide practice.
General guidelines for reviewing medical images
Radiodensity
Step 2
Be familiar with background information, and orient yourself correctly to the image
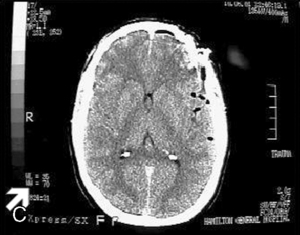
After reviewing the imaging report, the clinician then examines the actual images. The clinician must be familiar with the basic background information presented on the image. Normally the film will contain information such as the patient’s name, age, and medical record number; the date of the scan; and the name of the hospital or facility that performed the procedure (Figure 37-6). The date of the scan is particularly important when attempting to establish relationships between what can be seen on the image and the patient’s presentation. There might be a mismatch between what is shown on the image and what the patient is doing because of either resolution of the condition or worsening of the pathology. Comparing scans taken at different intervals will also assist the clinician in arriving at some general impressions on the rate or recovery (or lack thereof) or prognoses following physical rehabilitation.
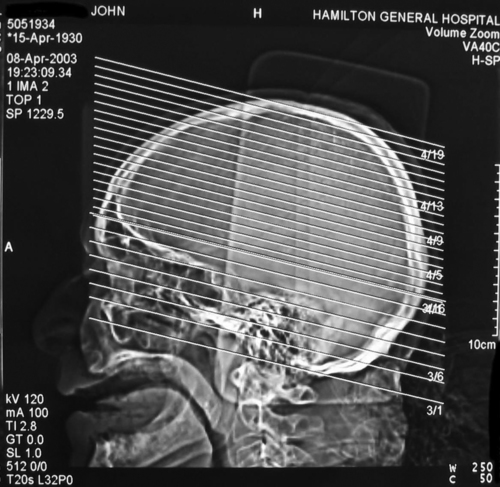
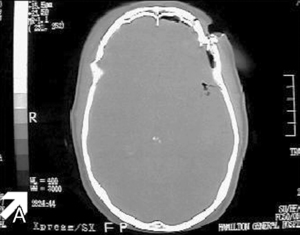
 Computed tomography scan of the brain with identifying information. (Courtesy Dr. John Wells. How to Read a CT Scan of the Brain. www.neurosurvival.ca/ComputerAssistedLearning/readingCTs/scanogram.htm.)
Certain views of the CT image can also be produced by the radiology team by manipulating certain image parameters. These “windows” are presented in Figure 37-7. A bone window shows bone the best and is helpful when a skull fracture is suspected. A brain window shows brain matter the best and is used when the suspected pathology is caused by or affects the brain matter (tumors, atrophy of the nuclear masses, or general atrophy of the brain itself). A subdural window is beneficial when suspecting the presence of subdural hematoma or swelling of the brain. With MRI, the images can also be “weighted” (for example, T1 versus T2). T1-weighted images show better gray matter–white matter contrast, whereas T2-weighted images might show edema better. As mentioned earlier, contrast may be used with either CT or MRI to improve visualization of the structures in question.

Step 3
Do a quick scan-through, then examine thoroughly
1. Examine the symmetry.5 Compare both sides of the brain as represented on the image. In orienting the images, the right side of the brain is usually shown on the left. Look for a midline shift by drawing an imaginary line from the anterior falx cerebri to the posterior falx cerebri. Identify the side of the greatest shift and measure it (in centimeters or millimeters). It would also be helpful to look for signs of mass effect (when structures on one side are “pushed” to the other side, or a possible atrophy on the structures on one side that pushes the structures on the other side across the midline). Additional structures to inspect for symmetry include the basal ganglia, thalamus, and corpus callosum.
2. Examine the size and shape of the structures.5 This is particularly helpful when looking at the integrity of the ventricles and cisterns. When filled with excessive fluid as in hydrocephalus, the ventricles enlarge disproportionately. This enlargement is seen in babies as a result of a variety of pathologies (see Chapter 15) and in children and adults after brain trauma (see Chapters 23 and 24). Likewise, in atrophy of the brain tissue the ventricles may also become enlarged; this is often seen in elderly adults as the brain loses gray matter and the ventricles enlarge to fill in the extra space (see Chapter 27). Examining the size and shape of the sulci may also be beneficial when looking at atrophy of the specific structure, thereby accounting for the abnormalities of movement being observed.
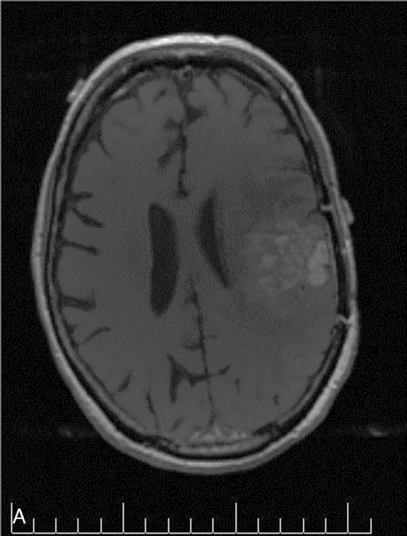
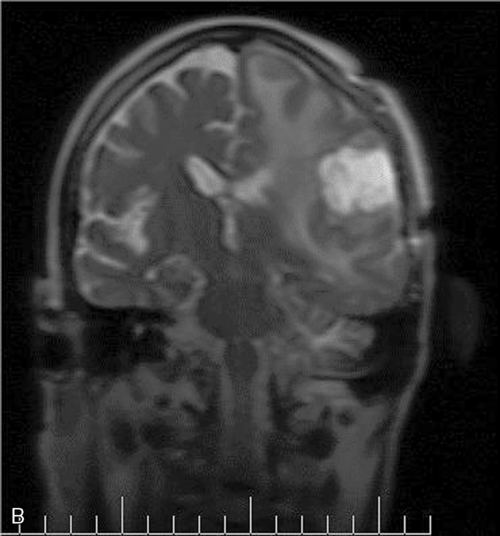
3. Look for lesions in the brain. Space-occupying lesions such as brain tumors or hematoma can be visualized (Figure 37-8). Because the brain has such a finite size to fit snugly within the cranial vault, any lesion in the brain has the potential to push brain structures to the midline or to displace the structure and create more serious pathology. Plaque formations secondary to multiple sclerosis can also be visualized as bright white spots in the gray matter (Figure 37-9).
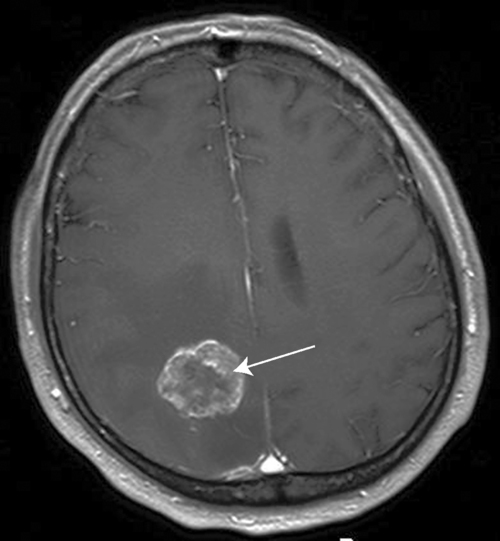
 T1-weighted magnetic resonance image with intravenous contrast showing a brain tumor. (From Wikipedia. http://en.wikipedia.org/wiki/File:Hirnmetastase_MRT-T1_KM.jpg.)
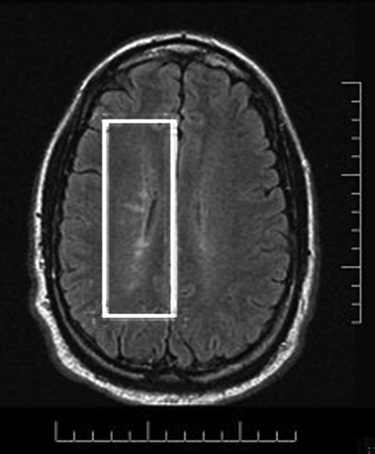
 Magnetic resonance image showing plaque formation caused by multiple sclerosis. (From Wikipedia. http://en.wikipedia.org/wiki/File:Dawsonsfingers.jpg.)
4. Examine densities.5 As mentioned previously, different tissues will have different densities, and these differences are what forms the generated images. Hyperdensities may include blood, tumors, or enhancing lesions, whereas common hypodensities include air, non-enhancing tumors, and chronic hematoma.
Step 4
Establish relationships between the structures involved and the presenting impairments, movement dysfunctions, and activity limitations
There are two possible clinical scenarios in which the medical imaging information is reviewed. First, the therapist may be reviewing the medical imaging information before seeing the patient for the initial examination or evaluation. If this is the case, the therapist is expected to use this information in relation to other medical information in the chart (from physician’s history and physical examination, nursing notes, and so on) to get an initial sense of what the patient may be able or unable to do. This will allow the therapist to plan for the appropriate tests and measures to perform during the examination (Case Study 37-1).
CASE STUDY 37-1  A PATIENT WITH A BRAIN TUMOR*
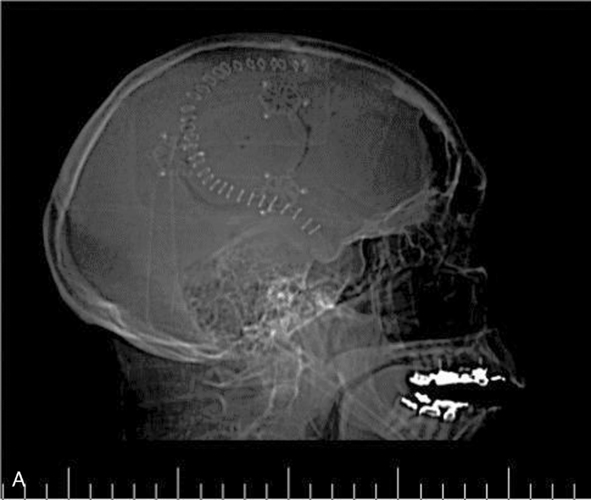
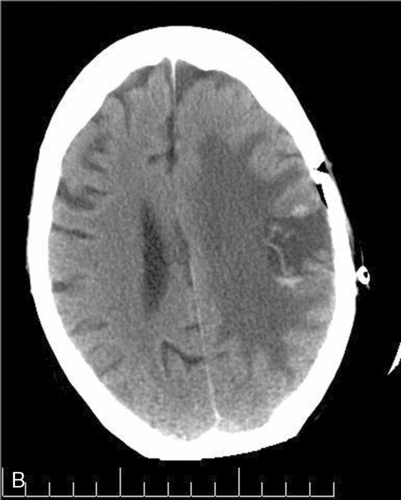
The patient was a 71-year-old woman with history of glioblastoma multiforme, the most aggressive form of brain tumor (refer to Chapter 25). It has been reported that a second recurrence of this condition is associated with a less favorable prognosis.6 The patient had previously undergone tumor resection, chemotherapy, and radiation. She had then been found to have another recurrence of the left frontal glioblastoma multiforme of 4 cm (Figure 37-10), for which she had undergone a stereotactic resection (Figure 37-11) of the tumor. After this surgery she underwent intensive inpatient rehabilitation.


The initial examination confirmed and supported all the expected movement deficits and clinical presentation of the patient. She underwent intensive occupational, physical, and speech therapy to improve her functional mobility and ambulation, self-care and activities of daily living, and also speech, swallowing, and communication. There was a concerted effort among the rehabilitation team and the patient’s family to optimize communication strategies while minimizing patient frustration. For example, more complex tasks such as transfers were broken down into smaller components and then practiced extensively as components and as whole functions. The transfer task was broken down into three steps: (1) locking the brakes, (2) removing the legrests, and (3) standing and turning to sit on the destination surface. These step-by-step instructions were written on the patient’s whiteboard; practiced during speech, physical, and occupational therapy; and communicated to the family and rehab team. Hand-over-hand guidance and facilitation were also included during instruction, as was use of mental rehearsal to remediate executive and visuomotor deficits to improve motor sequencing and problem solving while decreasing perseveration and frustration.7 The rehabilitation team worked closely together to standardize treatment techniques, increase opportunity for task carryover, and decrease the patient’s frustration with learning. Speech therapy started to integrate pictures and words representing tasks learned in physical and occupational therapies. In addition, therapy became more focused on repeated task training of three or four essential skills versus multiple activities, games, and skills.
As mentioned earlier, the complexity of the structure and function of the nervous system makes interpretation of imaging information very challenging. There may be situations in which images may not fully explain what the patient or client is able to do in terms of function and movement (as illustrated in Case Study 37-2).

[/level-membership-for-neurology-category][not-level-membership-for-neurology-category]
Use of medical imaging in neurorehabilitation
ROLANDO T. LAZARO, PT, PhD, DPT, GCS and DARCY A. UMPHRED, PT, PhD, FAPTA
After reading this chapter the student or therapist will be able to:
1. Recognize the various ways the brain can be labeled according to the slice and what differences in the types of cuts help identify the slice or image.
2. Transition from viewing a subject in various spatial positions to seeing the skeletal frame in that position to visually recognizing the entire nervous system when the subject is placed in the same position.
3. Recognize various slices of the central nervous system; what nuclear masses are visible in that slice; how the ventricles change from one slice to another; and how sagittal, horizontal, and coronal slices present those nuclear masses and/or ventricles differently.
4. Recognize the difference in diagnostic capabilities of radiography, computed tomography (CT), magnetic resonance imaging (MRI), and nuclear medicine scans.
5. Identify neuroradiological descriptive terminology.
6. Recognize normal and abnormal neuroanatomy on radiographs, CT scans, and MRI images.
7. Analyze information obtained from imaging of the central nervous system and integrate this information into the neurological clinical presentation and the patient’s intervention.
8. Recognize and analyze how a medical diagnosis using imaging may and may not be reflected in the movement diagnosis made by a physical or occupational therapist.
The increasingly complex role of physical and occupational therapy practitioners in health care delivery has increased the need for these clinicians to acquire knowledge and skills that will further enhance their ability to make appropriate decisions involving patient/client management. The recognition of direct access practice in many states and the increasing role of physical and occupational professionals as primary care providers have heightened the need for these clinicians to recognize and analyze how different medical tests and procedures affect movement and function. This differential analysis is critical in order for these professionals to know when to refer a client to another health care practitioner, when to refer and treat, when to merely treat, and when to neither refer nor treat (see Chapter 7).
Indeed, with the advent of doctoral education in physical and occupational therapy, entry-level knowledge of content such as pharmacology, radiology, and medical screening has become an accreditation requirement. Therapists are recognizing the value of information obtained from medical imaging studies in the appropriate delivery of physical and occupational therapy services. Orthopedic radiology is now a common part of curricula; however, content on neuroradiology, more specifically the application of neuroradiology in practice, is lacking. In a study by Little and Lazaro,1 it was found that many of the physical therapy practitioners in California use medical imaging in their practice. When looking at the types of imaging, the majority of respondents felt comfortable using results (and radiology reports) from radiographs obtained because of a musculoskeletal problem. This study showed the lack of access to and confidence in using medical images of the central nervous system (CNS).
In certain instances it may be easier for therapists to recognize musculoskeletal problems when viewing medical images because the abnormality in the structure directly correlates with what is manifesting as a movement problem. When images of the CNS are viewed, these correlations may be much more complex owing to the relationship of nuclei, tract systems, ventricular balance, and basic neurochemistry. For example, when looking at a bone fracture (Figure 37-1, A) versus a vascular insult (Figure 37-1, B), it is clear that the fracture and its effects on the bone, muscle, or skin can easily be visualized and interpreted. The second image of the CNS has many surrounding structures that must be identified in relation to the vascular insult.
A, Radiograph showing a fractured olecranon. B, Computed tomography scan showing an infarct of the middle cerebral artery. (B from Wikipedia. http://en.wikipedia.org/wiki/File:INFARCT.jpg.)In 2007 the journal Physical Therapy produced a special issue on neuroradiology in physical therapy practice. It is encouraging to note that this issue offered physical therapy clinicians an opportunity to understand the modalities used in the imaging of the brain and the spinal cord (for details, see the article by Kimberley and Lewis2). However, the rest of the articles presented the application of neuroradiology in physical therapy research,3,4 and although these articles provided valuable information for the practicing clinician, the articles did not specifically give insights as to how clinicians can use knowledge of neuroradiology in their actual patient/client management.
Visualizing the central nervous system
Before jumping into viewing images of the nervous system, the reader needs to be very familiar with the position and type of slices presented in those images. Figure 37-2 illustrates the three types of slices common to the nervous system. The horizontal slices shown in Figure 37-3 are cuts made horizontally through the brain beginning with a superior slice at the level of the beginning of the lateral ventricles. This individual would be lying supine if the brain were cut as shown. If a person were standing, the horizontal slice would be horizontal to the ground with the frontal lobes facing forward (toward the nose) and the occipital lobe in the back. The slices cut horizontally are always perpendicular to the brain stem and spinal cord or perpendicular to the upright position of the brain regardless of the position of the head in space. All right and left slices will look exactly the same as long as the nervous system has not sustained any insult. Figure 37-4 shows the position of an upright human and what the skeleton would look like in the same position. Can you visualize what the horizontal slices would look like? The horizontal section would be perpendicular to this upright position. When viewing radiological slices in horizontal, the slices will often be on a slight angle with the lower portion slightly forward. Most of these films are taken when individuals are supine, which places the brain off vertical so a correction is made. The film usually slices horizontally through the brain as if the head were slightly tucked, similar to the image of the adult in Figure 37-4, A. Also, some radiologists want a slightly different angle to the slice because they are looking for specific orientations. When viewing these films, try to look at the radiological slice pattern (scanogram), if shown. Figure 37-3 shows a progression of horizontal slices as if the individual were supine and the slices began anteriorly with emphasis on ventricular changes as part of the progression. Many of the medical images of the brain are viewed as horizontal (or axial) slices or views. The person is lying supine when undergoing computed tomography (CT), magnetic resonance imaging (MRI), or positron emission tomography (PET). Therefore the imaging process cuts 90 degrees off the horizontal plane of earth in order to achieve horizontal slices of the brain. Remember to look at the scanogram, if available, to identify the position of the head in relation to the cuts.
Coronal slices in the right hemisphere look similar to those in the left hemisphere except that the top of the slice will not look like the bottom on either side (see Figure 37-2). The two sides will reflect each other, with the tops being alike as well as the bottoms. Depending on where the cut is made, the result will be cortex on the outside, tracts (white matter) projecting downward, and gray matter again inferior and medial within the slices as the thalamus, basal ganglia, caudate, hippocampus, and so on are viewed. These slices begin at the top and cut down through both sides of the brain, with the slice ending on the inferior section. The progression of the slides can go from front (frontal lobe) to back (occipital lobe) or back to front. If visualized in a standing subject, the slice would begin in the superior frontal area and slice downward through the brain toward the feet, thus cutting equally on both sides. These slices can proceed in the posterior (backward) direction of the brain but always cutting from the top toward the bottom with equal distribution on each side. Figure 37-5 progresses from the front of the brain toward the back using the ventricles as a point of reference.
For sagittal cuts (see Figure 37-2), most cuts start by slicing down through the central fissure separating both sides of the brain. This cut is called a midsagittal section. Each sagittal slice proceeds outward toward the lateral aspect of the brain on each side respectively, depending on which side is being sliced. Anatomically, you begin as if you were slicing down through the middle of the face and the back of the head when a person is standing. Each sagittal slice moves from the inside outward toward the ear or laterally away from the midsagittal slice. Each slice cuts though the front and back of the brain from top to bottom and proceeds from medial to lateral. Sagittal images usually begin on either the right or the left side and continue slicing toward the middle to the midsagittal section separating the two sides of the brain, and then proceed toward the outside on the opposite side of the brain from the beginning slice.
Imaging of the central nervous system
It is beyond the scope of this chapter to discuss the physics behind the more common imaging modalities (see article by Kimberley and Lewis2
[/not-level-membership-for-neurology-category]
