Chapter 4 Understanding the Normal ECG
Please go to expertconsult.com for supplemental chapter material.
As the sample ECG in Figure 3-2 showed, the patterns in various leads can appear to be different, and even opposite of each other. For example, in some, the P waves are positive (upward); in others they are negative (downward). In some leads the QRS complexes are represented by an rS wave; in other leads they are represented by RS or qR waves. Finally, the T waves are positive in some leads and negative in others.
Three Basic “Laws” of Electrocardiography
To answer these questions, you need to understand three basic ECG “laws” (Fig. 4-1):
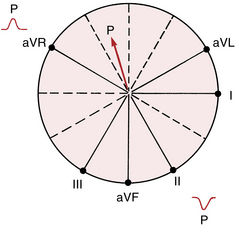
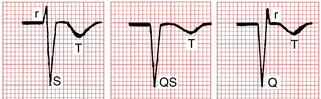
1. A positive (upward) deflection appears in any lead if the wave of depolarization spreads toward the positive pole of that lead. Thus, if the path of atrial stimulation is directed downward and to the patient’s left, toward the positive pole of lead II, a positive (upward) P wave is seen in lead II (Figs. 4-2 and 4-3). Similarly, if the ventricular stimulation path is directed to the left, a positive deflection (R wave) is seen in lead I (see Fig. 4-1A).
2. A negative (downward) deflection appears in any lead if the wave of depolarization spreads toward the negative pole of that lead (or away from the positive pole). Thus, if the atrial stimulation path spreads downward and to the left, a negative P wave is seen in lead aVR (see Figs. 4-2 and 4-3). If the ventricular stimulation path is directed entirely away from the positive pole of any lead, a negative QRS complex (QS deflection) is seen (see Fig. 4-1B).
3. If the mean depolarization path is directed at right angles (perpendicular) to any lead, a small biphasic deflection (consisting of positive and negative deflections of equal size) is usually seen. If the atrial stimulation path spreads at right angles to any lead, a biphasic P wave is seen in that lead. If the ventricular stimulation path spreads at right angles to any lead, the QRS complex is biphasic (see Fig. 4-1C). A biphasic QRS complex may consist of either an RS pattern or a QR pattern.
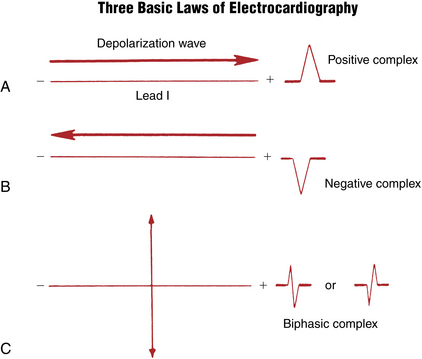

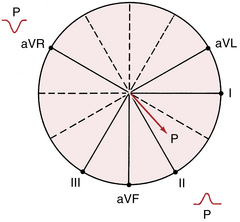
Figure 4-3 With sinus rhythm the normal P wave is negative (downward) in lead aVR and positive (upward) in lead II. Recall that with normal atrial depolarization the arrow points down toward the patient’s left (see Fig. 4-2), away from the positive pole of lead aVR and toward the positive pole of lead II.
Keeping the three ECG laws in mind, all you need to know is the general direction in which depolarization spreads through the heart at any time. Using this information, you can predict what the P waves and the QRS complexes look like in any lead.
Normal Sinus P Wave
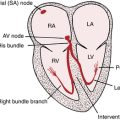
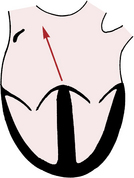
The P wave, which represents atrial depolarization, is the first waveform seen in any cycle. Atrial depolarization is initiated by spontaneous depolarization of pacemaker cells in the sinus node in the right atrium (see Fig. 1-1). The atrial depolarization path therefore spreads from right to left and downward toward the atrioventricular (AV) junction. The spread of atrial depolarization can be represented by an arrow (vector) that points downward and to the patient’s left (see Fig. 4-2).
Figure 3-7C, which shows the spatial relationship of the six frontal plane (extremity) leads, is redrawn in Figure 4-3. Notice that the positive pole of lead aVR points upward in the direction of the right shoulder. The normal path of atrial depolarization spreads downward toward the left leg (away from the positive pole of lead aVR). Therefore, with normal sinus rhythm lead aVR always shows a negative P wave. Conversely, lead II is oriented with its positive pole pointing downward in the direction of the left leg (see Fig. 4-3). Therefore, the normal atrial depolarization path is directed toward the positive pole of that lead. When sinus rhythm is present, lead II always records a positive (upward) P wave.
Four important notes about sinus rhythm:
1. Students and clinicians, when asked to define the criteria for sinus rhythm, typically mention the requirement for a P wave before each QRS complex and a QRS after every P, along with a regular rate and rhythm. However, these criteria are not necessary or sufficient. The term sinus rhythm answers the question of what pacemaker is controlling the atria. You can see sinus rhythm with any degree of heart block, including complete heart block, and even with ventricular asystole (no QRS complexes during cardiac arrest!).
2. As described later, you can also have a P wave before each QRS and not have sinus rhythm, but an ectopic atrial mechanism.
3. If you state that the rhythm is “normal sinus” and do not mention any AV node conduction abnormalities, listeners will assume that each P wave is followed by a QRS and vice versa. The more technical and physiologically pure way of stating this finding would be to say, “Sinus rhythm with 1:1 AV conduction.” Clinically, this statement is almost never used but if you try it out on a cardiology attending, she will be astounded by your erudition.
4. Sinus rhythm does not have to be strictly regular. If you feel your own pulse, during slower breathing you will note increases in heart rate with inspiration and decreases with expiration. These phasic changes are called respiratory sinus arrhythmia and are a normal variant, especially pronounced in young, healthy people with high vagal tone.
Using the same principles of analysis, can you predict what the P wave looks like in leads II and aVR when the heart is being paced not by the sinus node but by the AV junction (AV junctional rhythm)? When the AV junction (or an ectopic pacemaker in the lower part of either atrium) is pacing the heart, atrial depolarization must spread up the atria in a retrograde direction, which is just the opposite of what happens with normal sinus rhythm. Therefore, an arrow representing the spread of atrial depolarization with AV junctional rhythm points upward and to the right (Fig. 4-4), just the reverse of what happens with normal sinus rhythm. The spread of atrial depolarization upward and to the right results in a positive P wave in lead aVR, because the stimulus is spreading toward the positive pole of that lead (Fig. 4-5). Conversely, lead II shows a negative P wave.
At this point, you need not be concerned with the polarity of P waves in the other 10 leads. You can usually obtain all the clinical information you need to determine whether the sinus node is pacing the atria by simply looking at the P waves in leads II and aVR. The size and shape of these waves in other leads are important in determining whether abnormalities of the left or right atria are present (see Chapter 6).
Normal QRS Complex: General Principles
1. The first phase of ventricular depolarization is of relatively brief duration (shorter than 0.04 sec) and small amplitude. It results from spread of the stimulus through the interventricular septum. The septum is the first part of the ventricles to be stimulated. Furthermore, the left side of the septum is stimulated first (by a branch of the left bundle of His). Thus, depolarization spreads from the left ventricle to the right across the septum. Phase one of ventricular depolarization (septal stimulation) can therefore be represented by a small arrow pointing from the left septal wall to the right (Fig. 4-6A).
2. The second phase of ventricular depolarization involves simultaneous stimulation of the main mass of both the left and right ventricles from the inside (endocardium) to the outside (epicardium) of the heart muscle. In the normal heart the left ventricle is electrically predominant. In other words, it electrically overbalances the right ventricle. Therefore, an arrow representing phase two of ventricular stimulation points toward the left ventricle (Fig. 4-6B).
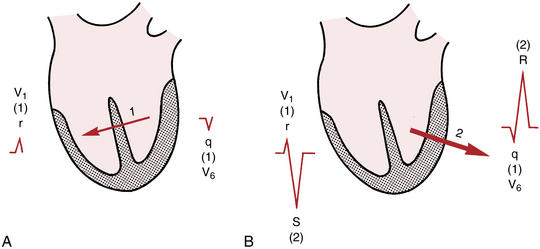
In summary, the ventricular depolarization process can be divided into two main phases: stimulation of the interventricular septum (represented by a short arrow pointing through the septum into the right ventricle) and simultaneous left and right ventricular stimulation (represented by a larger arrow pointing through the left ventricle and toward the left side of the chest).
The Normal QRS: Chest Leads
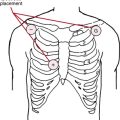
As discussed in Chapter 3, lead V1 shows voltages detected by an electrode placed on the right side of the sternum (fourth intercostal space). Lead V6, a left chest lead, shows voltages detected in the left midaxillary line (see Fig. 3-8). What does the QRS complex look like in these leads (see Fig. 4-6)? Ventricular stimulation occurs in two phases:
1. The first phase of ventricular stimulation, septal stimulation, is represented by an arrow pointing to the right, reflecting the left-to-right spread of the depolarization stimulus through the septum (see Fig. 4-6A). This small arrow points toward the positive pole of lead V1. Therefore, the spread of stimulation to the right during the first phase produces a small positive deflection (r wave) in lead V1. What does lead V6 show? The left-to-right spread of septal stimulation produces a small negative deflection (q wave) in lead V6. Thus, the same electrical event (septal stimulation) produces a small positive deflection (or r wave) in lead V1 and a small negative deflection (q wave) in a left precordial lead, like lead V6. (This situation is analogous to the one described for the P wave, which is normally positive in lead II but always negative in lead aVR.)
2. The second phase of ventricular stimulation is represented by an arrow pointing in the direction of the left ventricle (Fig. 4-6B). This arrow points away from the positive pole of lead V1 and toward the negative pole of lead V6. Therefore, the spread of stimulation to the left during the second phase results in a negative deflection in the right precordial leads and a positive deflection in the left precordial leads. Lead V1 shows a deep negative (S) wave, and lead V6 displays a tall positive (R) wave.
What happens between leads V1 and V6? The answer is that as you move across the chest (in the direction of the electrically predominant left ventricle), the R wave tends to become relatively larger and the S wave becomes relatively smaller. This increase in height of the R wave, which usually reaches a maximum around lead V4 or V5, is called normal R wave progression. Figure 4-7 shows examples of normal R wave progression.
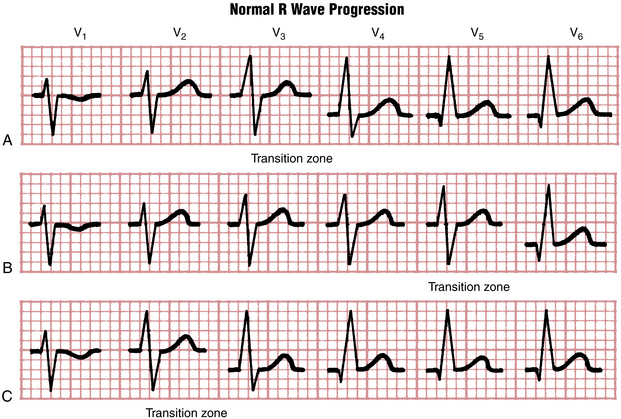
At some point, generally around the V3 or V4 position, the ratio of the R wave to the S wave becomes 1. This point, where the amplitude of the R wave equals that of the S wave, is called the transition zone (see Fig. 4-7). In the ECGs of some normal people the transition may be seen as early as lead V2. This is called early transition. In other cases the transition zone may not appear until leads V5 and V6. This is called delayed transition.
Examine the set of normal chest leads in Figure 4-8. Notice the rS complex in lead V1 and the qR complex in lead V6. The R wave tends to become gradually larger as you move toward the left chest leads. The transition zone, where the R wave and S wave are about equal, is in lead V4. In normal chest leads the R wave voltage does not have to become literally larger as you go from leads V1 and V6. However, the overall trend should show a relative increase. In Figure 4-8, for example, notice that the complexes in leads V2 and V3 are about the same and that the R wave in lead V5 is taller than the R wave in lead V6.
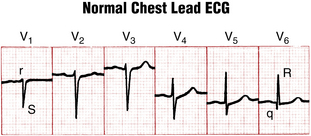
In summary, the normal chest lead ECG shows an rS-type complex in lead V1 with a steady increase in the relative size of the R wave toward the left chest and a decrease in S wave amplitude. Leads V5 and V6 generally show a qR-type complex.∗
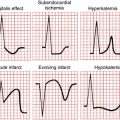
The concept of normal R wave progression is key in distinguishing normal and abnormal ECG patterns. For example, imagine the effect that an anterior wall myocardial infarction (MI) would have on normal R wave progression. Anterior wall infarction results in the death of myocardial cells and the loss of normal positive (R wave) voltages. Therefore, one major ECG sign of an anterior wall infarction is the loss of normal R wave progression in the chest leads (see Chapters 8 and 9).
An understanding of normal R wave progression in the chest leads also provides a basis for recognizing other basic ECG abnormalities. For example, consider the effect of left or right ventricular hypertrophy (enlarged muscle mass) on the chest lead patterns. As mentioned previously, the left ventricle is normally electrically predominant and left ventricular depolarization produces deep (negative) S waves in the right chest leads with tall (positive) R waves in the left chest leads. With left ventricular hypertrophy these left ventricular voltages are further increased, resulting in very tall R waves in the left chest leads and very deep S waves in the right chest leads. On the other hand, right ventricular hypertrophy shifts the balance of electrical forces to the right, producing tall positive waves (R waves) in the right chest leads (see Chapter 6).
The Normal QRS: Limb (Extremity) Leads
Of the six limb (extremity) leads (I, II, III, aVR, aVL, and aVF), lead aVR is the easiest to visualize. The positive pole of lead aVR is oriented upward and toward the right shoulder. The ventricular stimulation forces are oriented primarily toward the left ventricle. Therefore, lead aVR normally shows a predominantly negative QRS complex. Lead aVR may display any of the QRS-T complexes shown in Figure 4-9. In all cases the QRS is predominantly negative. The T wave in lead aVR is also normally negative.
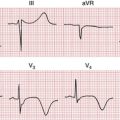
The QRS patterns in the other five extremity leads are somewhat more complicated. The reason is that the QRS patterns in the extremity leads show considerable normal variation. For example, the extremity leads in the ECGs of some normal people may show qR-type complexes in leads I and aVL and rS-type complexes in leads III and aVF (Fig. 4-10). The ECGs of other people may show just the opposite picture, with qR complexes in leads II, III, and aVF and RS complexes in lead aVL and sometimes lead I (Fig. 4-11).
What accounts for this marked normal variability in the QRS patterns shown in the extremity leads? The patterns that are seen depend on the electrical position of the heart. The term electrical position is virtually synonymous with mean QRS axis, which is described in greater detail in Chapter 5.
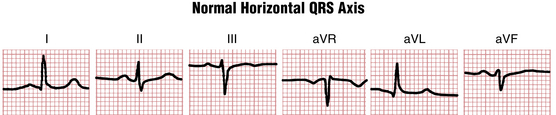
• When the heart is electrically horizontal (horizontal QRS axis), ventricular depolarization is directed mainly horizontally and to the left in the frontal plane. As the frontal plane diagram in Figure 3-10 shows, the positive poles of leads I and aVL are oriented horizontally and to the left. Therefore, when the heart is electrically horizontal, the QRS voltages are directed toward leads I and aVL. Consequently, a tall R wave (usually as part of a qR complex) is seen in these leads.
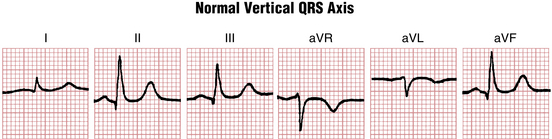
• When the heart is electrically vertical (vertical QRS axis), ventricular depolarization is directed mainly downward. In the frontal plane diagram (see Fig. 3-10), the positive poles of leads II, III, and aVF are oriented downward. Therefore, when the heart is electrically vertical, the QRS voltages are directed toward leads II, III, and aVF. This produces a relatively tall R wave (usually as part of a qR complex) in these leads.
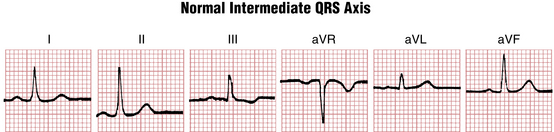
Dividing the electrical position of the heart into vertical and horizontal variants is obviously an oversimplification. In Figure 4-12, for example, leads I, II, aVL, and aVF all show positive QRS complexes. Therefore this tracing has features of both the vertical and the horizontal variants. (Sometimes this pattern is referred to as an “intermediate” heart position.)
Normal ST Segment
As noted in Chapter 2, the normal ST segment, representing the early phase of ventricular repolarization, is usually isoelectric (flat on the baseline). Slight deviations (generally less than 1 mm) may be seen normally. As described in Chapter 10, the ECGs of certain normal people show more marked ST segment elevations as a normal variant (early repolarization pattern). Finally, examine the ST segments in the right chest leads (V1 to V3) of Figures 3-2 and 6-10. Notice that they are short and the T waves appear to take off almost from the J point (junction of the QRS complex and ST segment). This pattern, a variant of normal variant early repolarization, is not an uncommon finding in normal individuals.
Normal T Wave
The T wave in the other leads may be variable. In the right chest leads (V1 and V2) the T wave may be normally negative, isoelectric, or positive but it is almost always positive by lead V3 in adults. Furthermore, if the T wave is positive in any chest lead, it must remain positive in all chest leads to the left of that lead. Otherwise, it is abnormal. For example, if the T wave is negative in leads V1 and V2 and becomes positive in lead V3, it should normally remain positive in leads V4 to V6.∗ The differential diagnosis of T wave inversions extending beyond V2 in adults is wide and includes positional and normal variants, right ventricular cardiomyopathy, and acute right ventricular overload syndromes, as well as anterior ischemia.
∗ You should be aware that normal chest lead patterns may show slight variation from the patterns discussed thus far. For example, in some normal ECGs, lead V1 shows a QS pattern, not an rS pattern. In other normal chest lead patterns the septal q wave in the left side of the chest leads may not be seen; thus, leads V5 and V6 show an R wave and not a qR complex. On still other normal ECGs, leads V5 and V6 may show a narrow qRs complex as a normal variant (see Fig. 3-2, lead V4) and lead V1 may show a narrow rSr′.
∗ In children and in some normal adults, a downward T wave may extend as far left as lead V3 or other leads with an rS- or RS-type complex. This normal variant is known as the juvenile T wave pattern.