Chapter 13 Ultrasound of the liver, biliary tract, and pancreas
Ultrasound Technology
Ultrasound is a high-resolution, low-cost imaging technique that uses no ionizing radiation. Its versatility and real-time imaging capability are also major advantages. Another unique advantage is Doppler ultrasound, which allows visualization of blood flow and assessment of flow dynamics. Ultrasound units are now smaller and more portable, so they are widely used in multiple medical settings, including the bedside, operative suite, emergency room, and in diagnostic and interventional radiology suites. Miniaturized high-resolution transducers also facilitate laparoscopic and endoscopic procedures (Berber et al, 2004; Machi et al, 2004).
Principles of Ultrasound Interpretation
Gray-scale sonography employs a pulse-echo technique to generate a two-dimensional display of the backscattered signal from insonated tissue. The intensity of the received echoes is recorded as brightness in the image. The strength of the echo at a tissue boundary is determined by acoustic impedence, defined as the product of tissue density and the speed of sound in the tissue. Sonographic scanners assume a uniform velocity of sound (1540 m/s) to compute the depth from which the received echo originated. Higher frequency sound has a shorter wavelength and therefore better spatial resolution, but a high-frequency sound beam attenuates more and has less tissue penetration. For this reason, lower frequency transducers are used to image structures deep within the abdomen, and higher frequencies are used to image more superficial structures (Zagzebski, 1996).
Gray-Scale Ultrasound Terminology and Artifacts
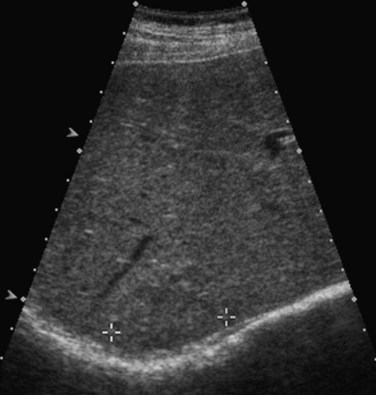
Lesions that appear dark relative to the background tissue are termed hypoechoic; those that are brighter than background are hyperechoic or echogenic (Fig. 13.1). Spaces that contain fluid do not contain internal interfaces, so no sound is reflected from within them; they appear uniformly black or anechoic. The ultrasound scanner normally compensates for the attenuation of sound that occurs with increasing depth within the tissue by amplifying echoes that return later from the far field. This is called time-gain compensation (TGC) or depth-gain compensation. TGC results in needless amplification of echoes from areas deep to pure fluid structures, because the acoustic pulse is attenuated to a lesser extent by fluid than by tissue. Such artificially bright areas beyond the fluid represent increased through transmission, or acoustic enhancement (Fig. 13.2). Although technically an artifact, acoustic enhancement is useful to characterize structures as cystic if they also lack internal flow on color Doppler.
Several other ultrasound artifacts also are used for diagnosis. At boundaries with large acoustic impedance mismatches, such as between tissue and air or tissue and bone, nearly all the energy in the incident beam is reflected; because none is transmitted, areas beyond the interface will not be visualized. A black acoustic shadow is thereby produced behind the object in the image (Fig. 13.3). Shadowing is characteristic of virtually all gallstones and greatly aids in distinction of gallstones from gallbladder polyps.
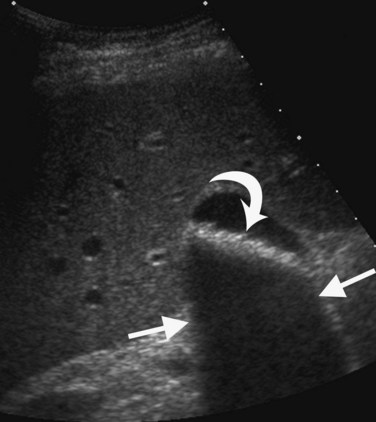
FIGURE 13.3 Gallstones (curved arrow) layering in the gallbladder produce an acoustic shadow (straight arrows).
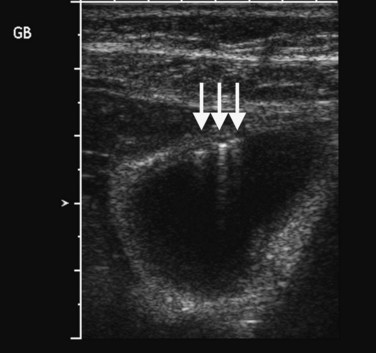
Within fluid-filled structures such as the gallbladder, faint echoes are often seen paralleling the anterior surface. These echoes represent reverberation artifact, which occurs as the sound is repeatedly reflected between the highly echogenic anterior gallbladder wall and the transducer. Reverberation also accounts for comet tail artifact, a streak of tiny, bright, parallel bands tapering behind a punctate crystalline reflector, generated by sound echoing within the crystal itself. Comet tail artifact is a feature of adenomyomatosis of the gallbladder and emanates from cholesterol crystals trapped in dilated Rokitansky-Aschoff sinuses in the gallbladder wall (Fig. 13.4). Fluid-filled structures may also have artifactual echoes along the dependent wall that originate from off-axis portions of the ultrasound beam. This is termed side lobe artifact and may be distinguished from true debris by changing the angle of insonation or repositioning the patient (Feldman et al, 2009; Zagzebski, 1996).
Doppler Ultrasound
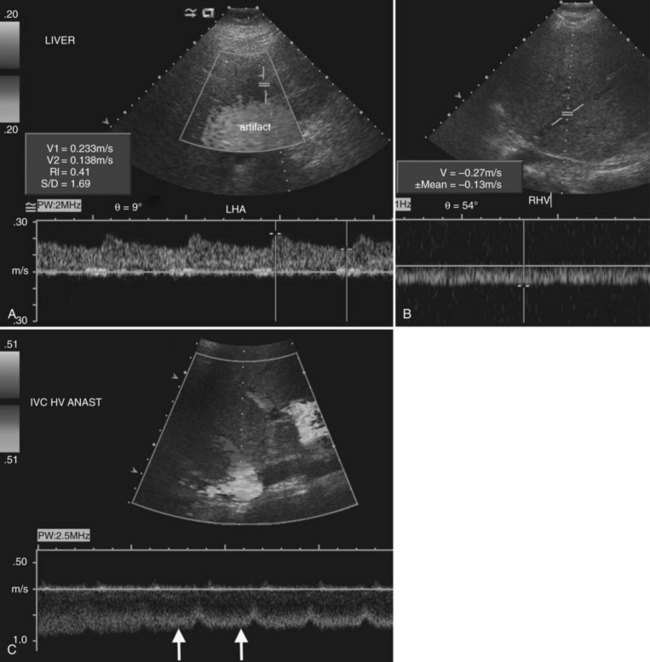
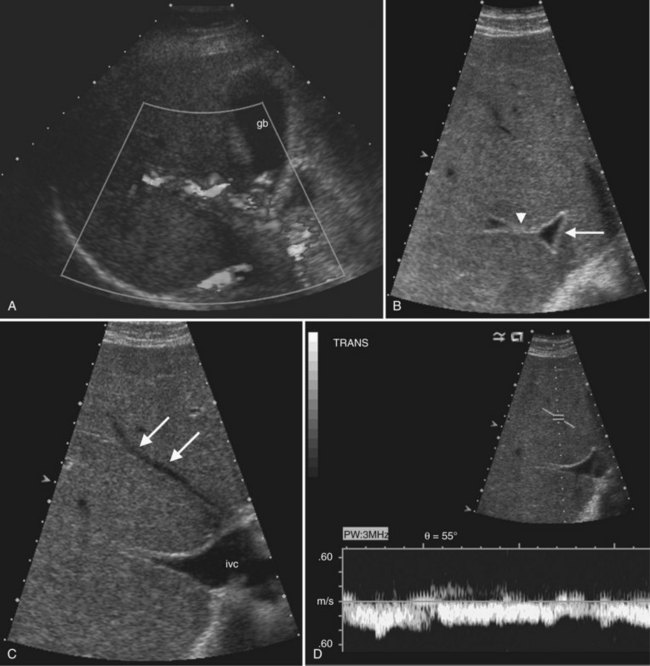
Three different Doppler displays are available (Fig. 13.5). Color Doppler displays show flow velocity and direction of flow toward or away from the transducer. A graphic or bar on the color Doppler image indicates the colors designated for flow toward and away from the transducer and the range of displayed velocities. Focal areas of high velocity that exceed the highest value on the Doppler setting produce a disorganized color signal; this is an artifact termed color aliasing that is useful to identify high-velocity flow, which may indicate vascular stenosis or encasement. Power Doppler displays amplitude of flow but not flow direction, and the signal is not dependent on the angle of insonation. Power Doppler is most useful to show areas of low flow and to demonstrate intralesional vascular patterns.
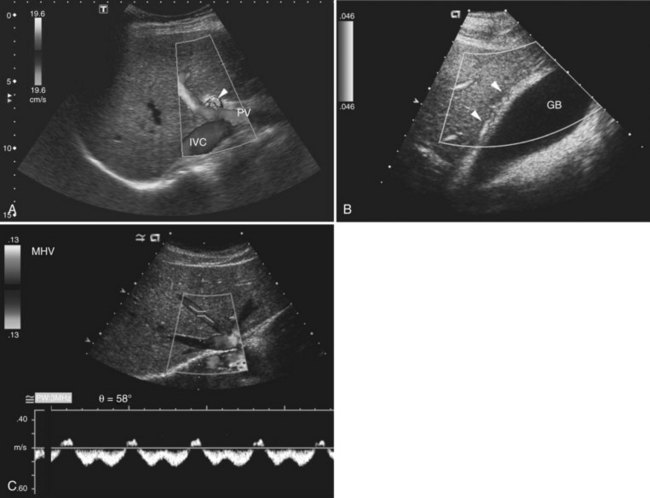
Spectral Doppler displays a graph of the entire range of velocities over time, rather than the mean velocity, as in a color Doppler image. When combined with gray-scale and/or color Doppler imaging in real time, it is possible to sample flow in specific blood vessels. For arterial flow, the peak systolic velocity and end-diastolic velocity indicate the strength of the inflow pressure and the downstream resistance. A useful metric for arterial waveform evaluation is the resistive index, defined as the difference between the peak systolic and end-diastolic velocities divided by the peak systolic velocity. A resistive index close to 1 implies nearly absent diastolic flow and high-resistance downstream. A lower than normal resistive index generally results from decreased systolic velocity and indicates impaired inflow to the region of interest. Hepatic venous waveform is usually phasic, with transmitted cardiac pulsation (see Fig. 13.5). When the hepatic veins or inferior vena cava (IVC) are narrowed, the waveform becomes flattened; this is a sensitive sign for venous compromise. Normal portal venous flow also has a phasic pattern that is decreased in conditions such cirrhosis and fatty infiltration (Colli et al, 1994).
Recent Technologic Advances
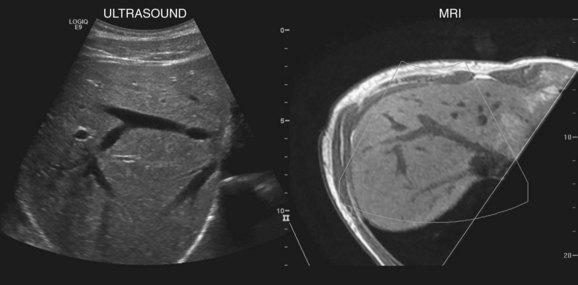
New techniques have been developed to coregister ultrasound, CT, and MRI images to facilitate lesion localization and to guide intervention or biopsy. Electromagnetic sensors placed near the scanning area and sensors attached to the ultrasound probe allow tracking of transducer position and orientation. Anatomic landmarks are identified on initial scanning and with navigation software, and these landmarks are coregistered with CT or MR images that have been downloaded into the ultrasound unit (Ewertsen et al, 2008). As the ultrasound scan is being performed in real time, the CT or MR images are reconstructed into a similar orientation plane (Fig. 13.6). Images may be displayed side by side or in a blended, overlapped format. In a study of contrast-enhanced ultrasound fused real time with CT, Jung and colleagues found that more lesions were identified with image fusion than with CT alone (Jung et al, 2009). Similar instrumentation allows global positioning system (GPS) navigation for needle tracking and volume acquisition. Acoustic force imaging to assess liver stiffness is another recent advance in development (see Songraphy of Diffuse Liver Disease below), and contrast-enhanced ultrasound is discussed in various sections on liver masses, detection, and characterization that follow.
Liver Ultrasound
Normal Liver Anatomy
The normal liver (see Chapter 1B) has a smooth surface and is uniform in echogenicity. Compared to adjacent organs, the liver is similar to or more echogenic than the kidneys and less echogenic than the spleen and pancreas. The superior aspect of the liver may have thin, linear indentations from diaphragmatic leaflets. Hepatic shape is variable. For example, a Riedel lobe may cause tonguelike inferior extension of the right lobe that may present as a palpable mass. Estimates of hepatic volume may be done with volumetric analysis (Treece et al, 2001; Wilson et al, 2009), but liver size is most commonly determined by a longitudinal image in the right midaxillary line. Normal liver length is reported to be less than 15.5 cm (Gosink et al, 1981). Others have used the right midclavicular longitudinal measurement with normal mean length of 10 cm (Niederau et al, 1983).
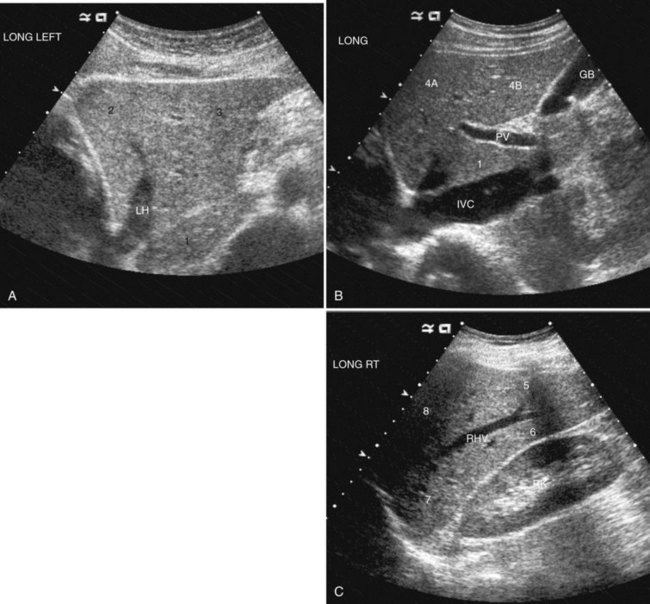
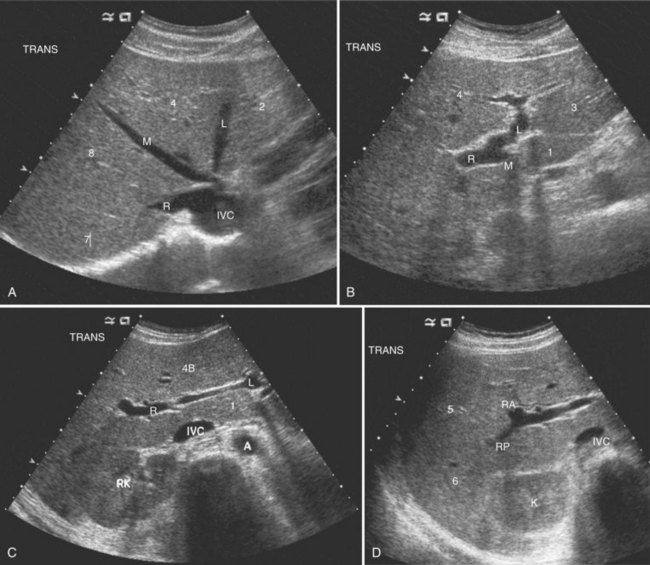
The Couinaud segmental anatomy of the liver is shown in Figures 13.7 and 13.8 (Couinaud, 1957; see Chapter 1B). Ultrasound images are obtained through available acoustic windows that avoid bone and air; this may vary the appearance of the liver compared with the standard axial, sagittal, and coronal planes of CT and MR, but the vascular landmarks that define the Couinaud segmental anatomy are well seen by ultrasound (Lafortune et al, 1991; Soyer et al, 1994). The hepatic veins and portal vein bifurcation are visualized with a subcostal transverse view; longitudinal images of the main portal vein, portal bifurcation, and hepatic artery are obtained best by intercostal approach, with the patient in the left lateral decubitus position. Transverse images of the portal confluence show the right portal vein and its bifurcation. The left portal vein in this plane courses transversely in the hilar plate for 3 to 4 cm before it extends into the umbilical fissure and gives off branches to the left hepatic segments. It is important to note that the horizontal portion of the left portal vein is extrahepatic and more readily available to the surgeon than the right portal vein.
Detection and Characterization of Focal Liver Masses
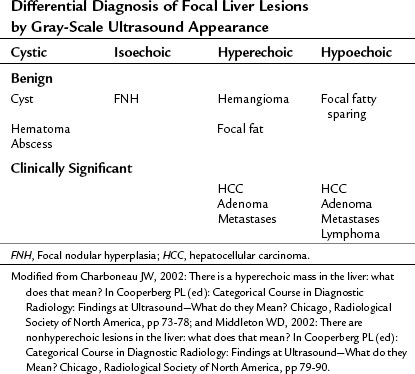
Gray-Scale Ultrasound of Focal Liver Masses
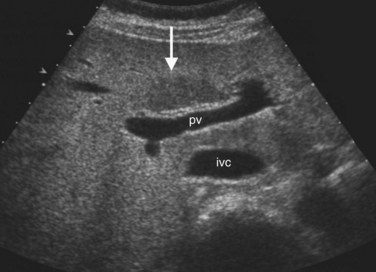
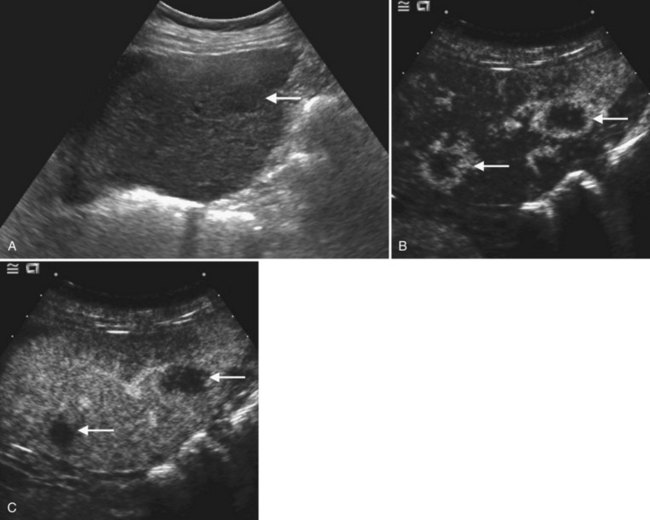
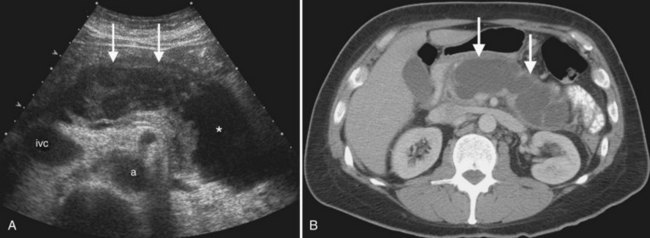
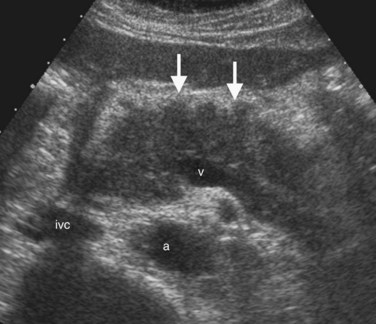
Conspicuity of liver lesions by gray-scale ultrasound is determined by lesion echogenicity relative to the liver. Small, markedly hypoechoic or hyperechoic lesions may be readily detected and characterized by ultrasound (Eberhardt et al, 2003), but masses that have echogenicity similar to adjacent liver may be more difficult to appreciate. On gray-scale ultrasound, liver masses are differentiated by internal architecture and are described as cystic, hypoechoic, and hyperechoic relative to the liver. Table 13.1 shows the common differential diagnoses within each of these categories (Charboneau, 2002; Middleton, 2002). The majority of cystic masses are benign, whereas most hypoechoic masses, with the exception of focal fatty sparing, are suspicious for neoplasm and require further evaluation, as they are clinically significant. Focal sparing often has geographic margins, typically is located in segment IV anterior to the portal bifurcation or adjacent to the gallbladder, and vessels are undisturbed. These distinctive features allow confident diagnosis (Fig. 13.9).
Hyperechoic masses include benign hemangioma, focal fat, and hepatic neoplasms such as hepatocellular carcinoma (HCC), adenoma, and metastases. Hemangiomas are brightly echogenic in the majority of cases and are sharply circumscribed. This appearance differs from malignant hyperechoic masses, which often have a hypoechoic halo. Any liver mass with a hypoechoic halo is suspicious for malignancy, and this sign has 86% positive predictive value and 89% negative predictive value for diagnosis of malignancy (Wernecke et al, 1992b).
Ultrasound Microbubble Contrast Agents for Evaluation of Liver Masses
Ultrasound microbubble contrast agents improve both detection and characterization of focal liver masses (Albrecht et al, 2003, 2004; Blomley et al, 1999; Bryant et al, 2004; Harvey et al, 2000; Quaia et al, 2004). First-generation contrast agents, such as SHU 508A (Levovist; Schering, Berlin), remain within the Kupffer cells after the vascular phase; when high mechanical index is applied to burst the bubbles, the liver enhances brightly, but metastases and other lesions without Kupffer cells appear dark. A multicenter study showed improved detection of individual metastases from 71% to 87%, and in seven of 80 patients, contrast-enhanced ultrasound showed more metastases than CT (Albrecht et al, 2003).
More recently, second-generation contrast agents and low mechanical index (LMI) scanning techniques have become available. At LMI settings, the microbubbles emit acoustic signals as they expand and contract in response to the ultrasound pulse, but they do not burst. Because the microbubbles stay in circulation, it is possible to image throughout arterial and portal phases. With LMI scanning, hypervascular tumors that enhance in the arterial phase are more easily detected. Lesion detection is also improved in the portal phase, because hepatic malignancies are hypoechoic during this phase (Wilson et al, 2006).
Contrast-enhanced ultrasound with second-generation contrast agents and LMI techniques allow assessment of vascular morphology, arterial enhancement relative to the liver, and duration of enhancement or “washout” during the portal venous phase (Wilson et al, 2006). These patterns of enhancement can be used to differentiate benign from malignant focal hepatic lesions as shown in the algorithm presented in Figure 13.10 (Brannigan et al, 2004; Ding et al, 2005; Wilson et al, 2006). Washout during the portal venous phase is highly correlated with malignant histology (von Herbay et al, 2009). In the portal phase, metastases and HCC are unenhanced relative to the liver, whereas benign hemangiomas and focal nodular hyperplasia (FNH) have sustained enhancement equal to or greater than the liver (Wilson et al, 2009; Quaia et al, 2004; Brannigan et al, 2004).
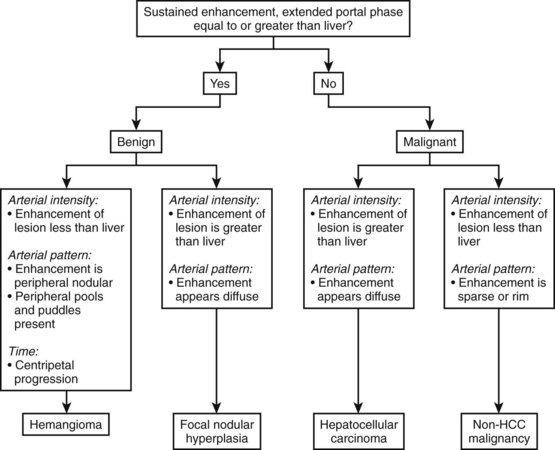
(Modified from Wilson SR, et al, 2006: An algorithm for the diagnosis of focal liver masses using microbubble contrast-enhanced pulse-inversion sonography. Am J Roentgenol 186:1401-1412.)
In a study of 452 liver lesions, contrast-enhanced ultrasound improved diagnostic accuracy for two readers from 49% to 85% and from 51% to 88%, and diagnostic confidence was increased from 0.82 to 0.97 and from 0.83 to 0.98, respectively (Quaia et al, 2004). A multiinstitutional study of 1349 patients with hepatic masses found that contrast-enhanced ultrasound had a diagnostic accuracy of 83% for all benign lesions, 82% for hemangiomas, and 87% for FNH. Diagnostic accuracy for malignant lesions was 96% overall, 91% for hepatic metastases, and 85% for HCC (Strobel et al, 2009).
Diagnostic performance of contrast-enhanced ultrasound has been compared to that of CT and MRI in several studies. There is high concordance for appearance in arterial phase imaging but less so in the portal phase, probably due to the fact the ultrasound contrast remains intravascular, but CT and MR contrast agents diffuse into the interstitium (Wilson et al, 2006). A multicenter study of 134 patients found that in comparison to CT and MRI, contrast-enhanced ultrasound was 30% more sensitive in recognition of malignancy, 16% more specific in exclusion of malignancy, and 23% more accurate (Trillaud et al, 2009).
Benign Liver Lesions
Cystic Masses
Benign hepatic cysts have smooth, thin walls, posterior acoustic enhancement, and no internal echoes (see Fig. 13.2). A partial, thin septum or puckered wall may be present. A confident diagnosis of simple hepatic cyst can be made on gray-scale ultrasound, and no further evaluation is required. Blood vessels and arteriovenous fistulas or aneurysms may appear cystic on gray-scale ultrasound, but these can be differentiated from simple cysts, because they will have internal flow on Doppler imaging. Lymphoma, which is very hypoechoic, may mimic a cyst rarely, but internal vascularity will be present on Doppler imaging. When cysts are innumerable and also present in the kidneys or pancreas, polycystic disease should be considered (see Chapter 69B).
Complex masses that contain fluid have internal echoes within the fluid, irregular or thickened walls, mural nodularity, and solid areas or calcification (Middleton, 2002). Hemorrhage, infection, and neoplasm should be considered in the differential diagnosis. Hemorrhagic cysts may have internal solid components, septations, and or debris layering in the dependent portion of the cyst, but on Doppler imaging, no internal vascularity is evident. Hepatic hematomas from trauma have variable appearance in the acute phase but become hypoechoic and cystic as they evolve (Korner et al, 2008; McGahan et al, 2006).
Abscess may be solid in appearance initially, but it then becomes cystic with debris; the wall is usually vascular (Fig. 13.11). Echinococcal cysts have variable appearance; they may be simple fluid-filled cysts, they may have undulated membranes from a rupture and detached endocyst, they may contain daughter cysts and/or echogenic material, and they may show calcification (Lewall et al, 1985). When hydatid cysts are infected, they lose their characteristic sonographic appearance and become diffusely hyperechoic.
Cavernous Hemangioma
Typical cavernous hemangioma, seen in 80% of cases, is a brightly echogenic homogeneous mass with a sharp margin (Fig. 13.12). Approximately 10% to 20% of hemangiomas are multiple (Charboneau, 2002). Multiple vascular interfaces within hemangiomas cause the increased echogenicity; the margins are well demarcated because histopathologically, only one cell layer is present at the junction with adjacent liver (Charboneau, 2002). Although hemangiomas are vascular, flow is extremely slow, and usually no Doppler signals are evident. Atypical hemangiomas, seen in 20% of cases, may have a thin echogenic rim and a lacy or granular central appearance from foci of collagen (see Fig. 13.12). Hemangiomas are often smaller than 3 cm, but some are giant hemangiomas that become symptomatic as a result of mass effect. Giant hemangiomas, those greater than 5 cm, often lack the characteristic ultrasound features because of central fibrosis, necrosis, and myxomatous degeneration. When the background liver becomes hyperechoic as a result of fatty infiltration, hemangiomas also may appear atypical and less echogenic than the liver. In such cases, contrast-enhanced ultrasound or CT may be useful (Bartolotta et al, 2007; Liu et al, 2009; see Chapter 79A).
With ultrasound contrast imaging at LMI settings, hemangiomas have sustained enhancement in the portal phase and on the arterial phase, enhancement intensity is usually less than the liver, and the pattern of enhancement is peripheral and nodular with puddling of contrast and centripetal progression, similar to CT (Wilson et al, 2006; Quaia et al, 2004; Brannigan et al, 2004; Fig. 13.13).
If the ultrasound shows the classic appearance of hemangioma, and the patient has no history of underlying liver disease or malignancy, then no further investigation is required (Leifer et al, 2000). A study of 213 patients with ultrasounds that showed a typical hemangioma appearance and without risk for hepatic malignancy found only one patient with malignancy on long-term follow-up and concluded that typical hemangiomas in low-risk patients do not require follow-up. This rule does not apply to patients with cirrhosis, hepatitis, or chronic liver disease who are at increased risk for HCC, nor does it apply to patients who already have malignancies. In a study of 2000 patients with cirrhosis, 44 had hemangioma-like lesions; on follow-up, half of these proved to be HCCs, and half were hemangiomas (Caturelli et al, 2001). Thus, in patients at risk for HCC, any echogenic lesion merits further evaluation and follow-up.
Focal Nodular Hyperplasia
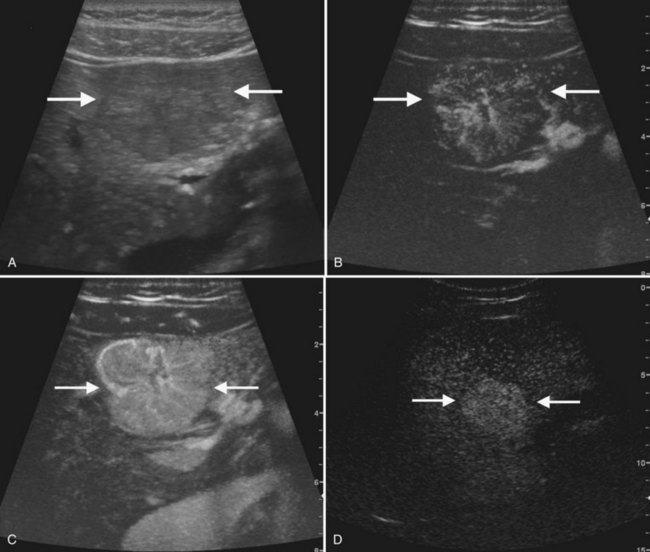
The second most common benign hepatic neoplasm, FNH may be difficult to detect on gray-scale ultrasound, because it often has similar echogenicity to the liver, but subtle vascular displacement or contour abnormalities may draw attention to the lesion (Buetow et al, 1996; Hussain et al, 2004; Wilson et al, 2005; Fig. 13.14). FNH typically occurs in asymptomatic patients and is more common in women. Approximately 20% are multiple, and they may occur in association with hemangiomas (Nguyen et al, 1999; see Chapter 79A). FNH contains Kupffer cells, hepatocytes, and biliary structures but without portal triads and central veins found in normal hepatic lobules (Hussain et al, 2004). FNH is considered to be secondary to vascular malformation; fibrous septa radiate from a central scar, and tortuous feeding arteries are present.
On gray-scale ultrasound, FNH has variable echogenicity and lobulated smooth contour (see Fig. 13.14). A central scar may be evident, but it is usually better depicted on CT, MRI, or contrast-enhanced ultrasound. A key to ultrasound diagnosis of FNH is the characteristic power Doppler appearance of the tortuous feeding artery and spoke-wheel vascularity within the lesion. With ultrasound contrast imaging, the central scar is better seen, and the vascular pattern can be diagnostic. FNH is hypervascular on early arterial phase imaging with diffuse enhancement that is sustained into the early portal phase (Wilson et al, 2006; Kamaya et al, 2009; Dietrich et al, 2005; Ungermann et al, 2007; Brannigan et al, 2004; Quaia et al, 2004). Persistent portal phase enhancement differentiates FNH from malignant liver lesions (Kim et al, 2009; von Herbay et al, 2009; Fig. 13.15)
Hepatic Adenoma
Hepatic adenomas are rare benign tumors that usually occur in young women with a history of oral contraceptive use, but they can also be seen in men using anabolic steroids (see Chapter 79A). They are usually solitary (80%) but can be multiple in patients with type 1 glycogen storage disease or liver adenomatosis. Adenomas lack portal venous supply and bile ductules; they have disorganized plates of cells separated by dilated sinusoids that are perfused by arterial pressure, which predisposes to hemorrhage (Grazioli et al, 2001). On gray-scale ultrasound, adenomas appear echogenic, because adenoma cells have a high lipid content. Internal hemorrhage within adenomas may produce cystic areas, and calcification may also be present (Grazioli et al, 2001). Spectral Doppler flow may have a continuous waveform (Golli et al, 1994; Bartolozzi et al, 1997). Contrast ultrasound of hepatic adenomas more often shows centripetal or mixed filling during the arterial phase; this pattern differs from FNH, which has spoke-wheel vascularity. On portal phase imaging, adenomas are variable, but most commonly they are isoechoic or slightly hypoechoic relative to the liver (Bartolotta et al, 2007; Kim et al, 2006, 2008; Ricci et al, 2008).
Malignant Liver Neoplasms
Hepatocellular Carcinoma
HCC (see Chapter 80), one of the most common malignancies worldwide, usually arises in the background of cirrhosis and has poor survival (Collier et al, 1998; El-Serag et al, 1999). Chronic hepatitis B and C infection accounts for the high prevalence of HCC in Southeast Asia, sub-Saharan Africa, and the Mediterranean, and the increased prevalence of these viral infections has contributed to rising incidence of HCC in the United States (Caturelli et al, 2003; El-Serag et al, 1999).
Ultrasound in combination with serum α-fetoprotein (AFP) is used to screen for HCC in high-risk patients, and ultrasound-guided biopsy can be used for diagnosis with 90% accuracy (Caturelli et al, 2004; Collier et al, 1998; Sato et al, 2009; Tong et al, 2001). In patients with elevated AFP, ultrasound was found to have 86% sensitivity, 82% specificity, 55% positive predictive value, and a false-negative rate of only 4% (Mok et al, 2004). A study comparing screened versus unscreened patients with cirrhosis showed improved median survival (17 months vs. 12 months) and improved survival rates at 1, 3, and 5 years for HCC arising in the screened Child-Pugh class B patients, but not in the class C patients (Trevisani et al, 2007). Chan and colleagues (2008) compared survival of HCC arising in screened versus unscreened groups during two different 7-year time periods ending in 1997 and 2004. Long-term survival was better in the screened group and, as a result of improved surgical treatment, the proportion of patients undergoing curative resection increased from 51% to 68% in those two time periods.
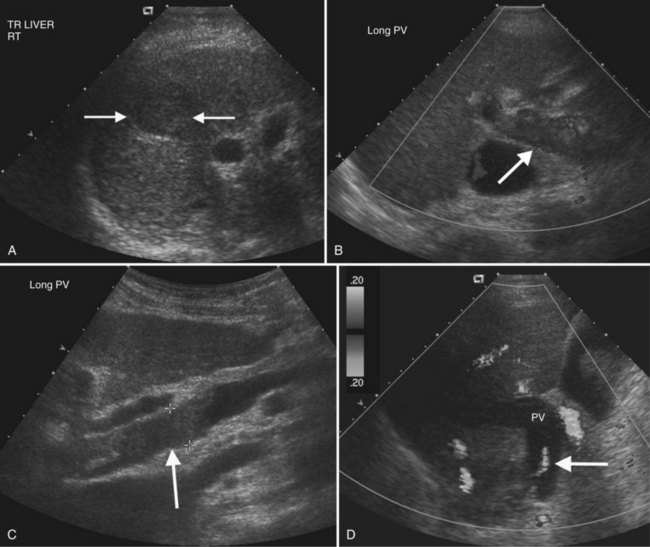
On gray-scale ultrasound, HCC may be solitary, multiple, or diffuse, and it has a propensity for venous and bile duct involvement (Wilson et al, 2005). Small HCC tumors (<5 cm) are often hypoechoic but may be hyperechoic from fatty metamorphosis (Choi et al, 1993; Caturelli et al, 2001). Larger HCC tumors are often inhomogeneous because of liquefaction necrosis and fibrosis (Tanaka et al, 1983), and sonographic depiction of HCC may be limited in the setting of severe cirrhosis (Bennett et al, 2002). Thrombosis of portal and/or hepatic veins is frequent, seen in 30% to 60% of patients (Wilson et al, 2005; Fig. 13.16). Tumor thrombus usually expands the vein, and Doppler interrogation may reveal hepatofugal arterial flow within the thrombus, a pathognomonic finding (Shah et al, 2007; Lencioni et al, 1995; Giorgio et al, 2004; Tanaka et al, 1993). HCC may also extend into the bile ducts and cause biliary obstruction or hemobilia (Kojiro et al, 1982).
HCC is hypervascular with dysmorphic arteries and high-velocity flow on Doppler imaging (Koito et al, 1998; Tanaka et al, 1990). Microbubble ultrasound contrast imaging improves HCC characterization and is highly concordant with CT findings, but contrast-enhanced ultrasound is best at identifying lesions greater than 2 cm (Quaia et al, 2007; Giorgio et al, 2004; Inoue et al, 2009; Jang et al, 2008). Moderately differentiated HCC is hypervascular in the arterial phase, whereas well-differentiated and poorly differentiated HCC may have a more variable appearance. Observation during the portal phase should be extended, as many HCCs have delayed washout for up to 300 seconds (Jang et al, 2007; Fig. 13.17)
Fibrolamellar Carcinoma
Fibrolamellar HCC, a variant of HCC with better prognosis, characteristically presents as a large solitary mass in an adolescent or young adult without liver disease, and AFP levels are usually normal. On ultrasound, fibrolamellar HCC is well defined, lobulated, and has variable echogenicity. Calcification may also be present (Chung et al, 2009). A central scar may be visible on gray-scale ultrasound in a third to two thirds of patients, but scars are better seen with contrast-enhanced ultrasound (Smith et al, 2008; McLarney et al, 1999). Regional lymphadenopathy is common.
Liver Metastases
Liver metastases (see Chapter 81C) are multiple in 98% of patients and are found in up to 50% of cancer patients at autopsy (Wilson et al, 2005; Middleton, 2002). Liver metastases are frequently detected by gray-scale ultrasound, but CT is the preferred modality to determine extent of disease, number of hepatic lesions, and extrahepatic disease. Response to therapy is also better evaluated by CT, because treatment-related fatty infiltration may obscure lesions that have diminished in size or changed echogenicity as a result of chemotherapy.
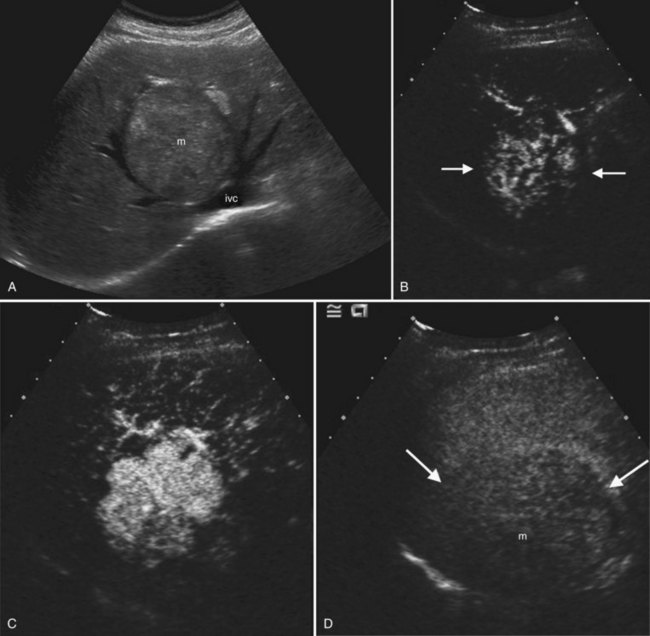
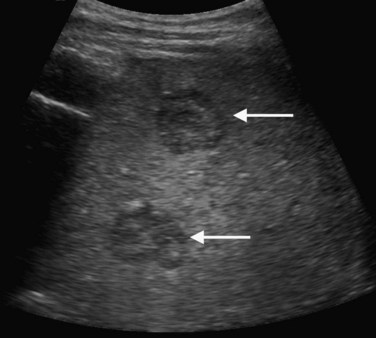
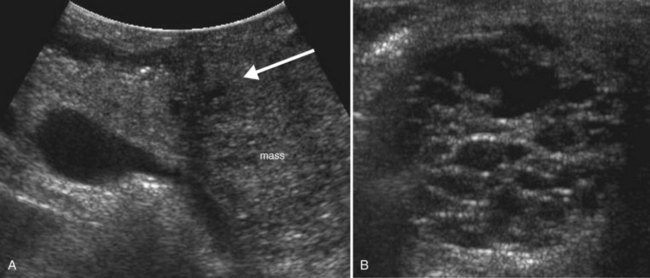
On ultrasound, hepatic metastases frequently have a hypoechoic halo that corresponds to fibrosis, compressed sinusoids, and tumor neovascularity surrounding the metastatic deposit (Wernecke et al, 1992a; Kruskal et al, 2000; Fig. 13.18). Uniformly hypoechoic lesions are the second most frequent sonographic appearance of metastases (Middleton, 2002; Fig. 13.19) Hypoechoic appearance and hypoechoic halo are highly suggestive of malignancy. In addition to metastases, lymphoma and HCC should be considered in the differential diagnosis. Contrast-enhanced ultrasound improves detection of individual metastases compared with gray-scale ultrasound, and in some cases, contrast-enhanced ultrasound may reveal more lesions than are evident on CT (Albrecht et al, 2003; see Fig. 13.19).
The ultrasound appearance of metastases may vary according to the primary origin. Echogenic lesions tend to arise from HCC or gastrointestinal primaries. Vascular metastases, such as those from renal cell carcinoma, islet cell tumors, carcinoids, and choriocarcinoma, also are typically hyperechoic (Tanaka et al, 1990; Marchal et al, 1985; Rubaltelli et al, 1980). Hypoechoic metastases are commonly due to untreated metastatic breast, lung, pancreatic, gastric, and esophageal carcinoma. Lymphoma, which is also hypoechoic because of its uniform cellularity, may be diffusely infiltrative or may have multiple masses; this latter pattern is more common in non-Hodgkin lymphoma or AIDS-related lymphoma (Townsend et al, 1989). Calcified metastases may be found with mucinous adenocarcinoma of the colon as well as other primaries. Cystic hepatic metastases are seen in ovarian and pancreatic cystadenocarcinomas and mucinous colon carcinomas. Metastases undergoing central necrosis, such as sarcomas, also may appear cystic, but the thick surrounding tumor wall is usually evident. When metastases are diffusely infiltrative, such as in breast or lung carcinoma, it can be difficult to detect individual lesions, and the liver may have a pseudocirrhotic appearance (Fennessy et al, 2004; Young et al, 1994).
Sonography of Diffuse Liver Disease
Steatohepatitis
Fatty liver (see Chapter 65) is commonly encountered incidentally on sonograms of the liver and in patients referred for imaging evaluation of abnormal values on liver function tests. The fat deposition within hepatocytes results in increased echogenicity of the liver relative to the kidney and in decreased acoustic penetration (Fig. 13.20). Because echogenicity is not a quantitative measure, one useful objective sign of fatty infiltration is loss of the echogenic borders of the portal vessels. To reduce subjectivity in fatty liver diagnosis, some investigators advocate comparing the relative echogenicity between the liver and right kidney to that between the spleen and left kidney. Because the normal spleen is more echogenic than liver, if the difference in echogenicity between the liver and right kidney is greater than the difference between the left kidney and spleen, then the liver is abnormally echogenic (Tchelepi et al, 2002).
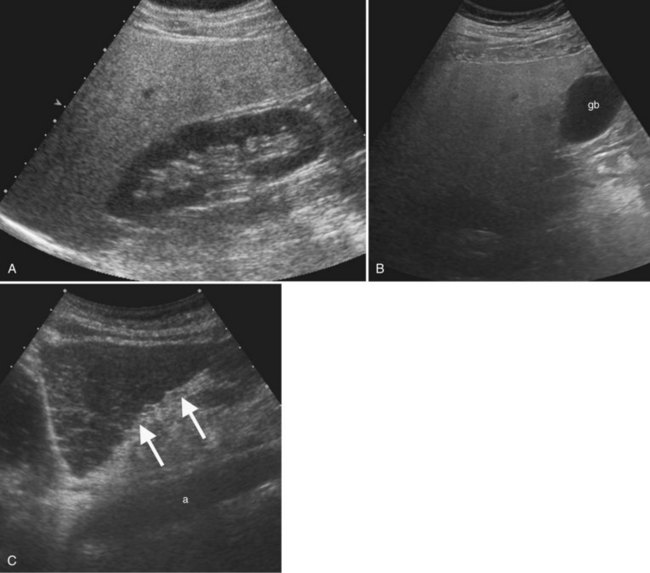
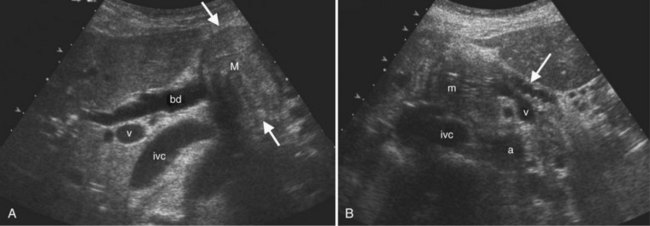
A fatty liver may be diffuse and uniform, patchy, or focal. Areas of focal fat deposition are commonly wedge-shaped and echogenic and occur in characteristic locations, such as along the ventral surface of segment IV and adjacent to the falciform ligament. Focal fat deposition may also be lobar, rounded, and masslike or perivascular in distribution. In the latter two cases, magnetic resonance imaging (MRI) with in-phase and opposed-phase sequences is highly useful to confirm that the focal abnormality truly represents intracellular fat deposition and not a mass lesion. Focal fat deposition should not have mass effect, and therefore intrahepatic vessels should traverse these areas of increased echogenicity without displacement. However, this finding is not entirely specific, as occasionally some mass lesions may likewise fail to displace vessels. Finally, within the diffusely fatty liver, certain regions may be spared (see Fig. 13.9). These are typically areas of nonportal venous inflow, such as around the gallbladder (cystic veins) and in the region of the porta hepatis.
Acute Hepatitis
Most imaging modalities, including sonography, are neither sensitive nor specific for the diagnosis of acute hepatitis. Definitive diagnosis of hepatitis is usually made based on clinical and laboratory grounds, with imaging useful for excluding other diagnoses, such as biliary obstruction or hepatic mass lesions (Mortele et al, 2001). The most common sonographic abnormality in hepatitis is hepatomegaly. Periportal edema may be appreciated sonographically, but it is better seen on CT or MRI. Occasionally, sonography may demonstrate very low hepatic parenchymal echogenicity, producing an appearance known as the “starry night” liver for the striking prominence of the periportal echoes against the abnormally dark background liver (Mortele et al, 2001; Tchelepi et al, 2002). Hepatitis may also produce secondary changes in the gallbladder, with irregular lamellated thickening of the gallbladder wall noted, especially in hepatitis A (Tchelepi et al, 2002).
Cirrhosis
Cirrhosis (see Chapter 70A) is a diagnosed histologically by the presence of bridging fibrosis and regenerative nodule formation. Although sonographic findings are neither sensitive nor specific for the diagnosis, certain findings may suggest that cirrhosis is present (Tchelepi et al, 2002). Surface nodularity is the most reliable sign of cirrhosis, and nodularity along the deep surfaces of the liver has been found to be a more sensitive sign of cirrhosis than superficial nodularity (Filly et al, 2002; Fig. 13.20). Surface nodularity may be better appreciated in the presence of ascites. Other sonographic features of cirrhosis include coarsening and inhomogeneity of the parenchymal echo texture and volume loss in the right lobe with relative hypertrophy of the left lobe and caudate.
Stigmata of portal hypertension—such as splenomegaly, ascites, reversal of portal venous flow direction, and varices—indicate that severe parenchymal disease is present. The portal vein diameter may exceed 13 mm, although this is not invariably the case. Enlarged, tortuous hepatic arteries are often present in cirrhotic livers and should not be mistaken for dilated bile ducts or venous collaterals; color and spectral Doppler are useful for making this distinction. Although not widely used, a scoring system has been developed for cirrhosis based on four ultrasound criteria: 1) surface appearance, either normal, irregular, undulated; 2) parenchymal echo texture, either normal, heterogeneous, or coarse; 3) intrahepatic vessel caliber, either normal, obscure, or narrowed; and 4) spleen size, which has been proposed with scores above 7 or 8 having relatively high sensitivity and specificity (Lin et al, 1993).
Elastography is a relative new sonographic technique that has shown great promise for noninvasive quantification of hepatic fibrosis in patients with cirrhosis or chronic hepatitis. Two primary methods for performing elastography with ultrasound have been devised. Transient elastography (TE, FibroScan) uses an ultrasound transducer mounted on the axis of a vibrator. A vibration sent into the tissue induces an elastic shear wave, the velocity of which is directly related to tissue stiffness. The harder the tissue, the faster the shear wave propagates. The TE technique is rapid, operator independent, feasible with nonfasting patients, and it yields results that are reproducible and immediately available (Goyal et al, 2009). A recent trial of the technique in 711 patients with chronic liver disease found that a cutoff value of 17.6 kPa for liver stiffness had 90% positive and negative predictive values for the presence of cirrhosis (Foucher et al, 2006). More recently, the technique of real-time elastography was studied in 79 patients with chronic viral hepatitis and known fibrosis and in 20 healthy, normal volunteers. Unlike TE, real-time elastography uses conventional ultrasound probes and can be performed with modified conventional real-time sonography equipment. Results were promising, with areas under the receiver operating characteristic curve 0.75 for significant fibrosis, 0.73 for severe fibrosis, and 0.69 for cirrhosis (Friedrich-Rust et al, 2007).
Liver Transplantation (see Chapter 100)
Ultrasound is the modality of choice for the evaluation of the postoperative liver transplant recipient. Both gray-scale and Doppler imaging modes are required—the former for evaluation of the biliary tree and posttransplant fluid collections and the latter for evaluation of the status of the hepatic vasculature. Early detection of transplant complications is essential for preservation of graft function; therefore sonographic expertise must be readily available in any transplant setting (see Chapter 100). The frequency of sonographic surveillance varies by institution, although initial assessment of vascular patency is generally performed in the immediate (<24 hours) posttransplant period.
The overall incidence of vascular complications following liver transplantation is approximately 9% (Caiado et al, 2007; Quiroga et al, 2001), and Doppler ultrasound is the mainstay of evaluation. Among vascular complications, hepatic arterial thrombosis is the most feared, because it impairs the viability of the transplant bile ducts. In the native liver, arterial collaterals, primarily from the phrenic arteries, can sustain bile ducts following hepatic artery ligation (Bekker et al, 2009), but in the transplanted liver, such collaterals are initially absent, requiring at least 2 weeks to develop. Therefore in the early posttransplant period, bile ducts are supplied solely by the hepatic artery.
The frequency of early hepatic arterial thrombosis is higher in children (see Chapter 98C) than adults and has been decreasing over the past two decades with improvements in perioperative care. A recent review of 71 clinical studies of early hepatic arterial thrombosis published between 1990 and 2007 found an overall incidence of 4.4%, with a rate of 8.3% in children and 2.9% in adults (Bekker et al, 2009). Causes of hepatic arterial thrombosis include technical surgical problems (kinking, stenotic anastomosis) and nonsurgical causes such as immunologic factors, clotting abnormalities, and infections, especially cytomegalovirus (Pastacaldi et al, 2001). The median time to detection of hepatic arterial thrombosis is approximately 7 days (Bekker et al, 2009). Most cases of hepatic artery thrombosis are identified through routine sonographic surveillance, when patients are either asymptomatic or have only mild elevation of values on liver function tests. Fulminant hepatic necrosis is decidedly unusual. More commonly, undiagnosed bile duct ischemia as a result of hepatic artery thrombosis results in recurrent cholangitis, intrahepatic abscess, bile duct stenosis, or bile leak (Garcia-Criado et al, 2002).
Stenosis of the hepatic artery occurs in an estimated 5% to 11% of transplant recipients and usually develops at the anastomotic site within 3 months of transplantation (Caiado et al, 2007). If the anastomotic site can be visualized directly, color Doppler may show focal aliasing, and spectral Doppler will demonstrate elevated velocities. More commonly, though, the hepatic artery can only be visualized in the porta hepatis downstream of the anastomosis. With anastomotic stenosis, there will be a tardus-parvus waveform in the downstream proper hepatic and intrahepatic arteries (Fig. 13.21). This waveform is characterized by a blunted, delayed peak systolic velocity with resistive index below 0.5 and a prolonged acceleration time in excess of 0.08 seconds (Caiado et al, 2007; Tamsel et al, 2007). Occasionally a tardus-parvus waveform may be present in the intrahepatic arteries in the setting of chronic hepatic artery thrombosis. This implies that a collateral arterial supply has developed, and its dampened flow resembles the waveform seen in hepatic artery stenosis (Caiado et al, 2007). Therefore both the main hepatic artery in the porta hepatis and the intrahepatic right and left hepatic arteries must be interrogated on all Doppler studies of transplanted livers. In the early postoperative period, the hepatic artery resistive index may be elevated, but this finding is generally of no clinical consequence and is often associated with an older donor age or prolonged cold ischemia time (Caiado et al, 2007; Shaw et al, 2003).
On the venous side, portal and hepatic vein transplant complications are relatively rare (see Fig. 13.21). Portal vein stenosis and thrombosis each have an incidence of approximately 1% to 2% (Caiado et al, 2007; Tamsel et al, 2007). Portal vein thrombosis may result from technical problems at surgery, previous portal vein thrombosis, increased downstream resistance from hepatic venous outflow impairment, sluggish portal vein inflow, or hypercoagulable states. Diagnosis is made when flow is absent in the various Doppler modes, or an echogenic thrombus is visualized on gray-scale ultrasound. Very slow flow may be undetected by sonography; so, suspected thrombosis should be confirmed with another modality, such as CT or MRI.
Vascular Disorders of the Liver
Portal Vein Thrombosis and Cavernous Transformation
Portal vein thrombosis may be caused by hypercoagulable states; inflammatory diseases; sepsis; myeloproliferative disorders; neoplasms, especially HCC; and most commonly, portal hypertension (Rossi et al, 2006; Wilson, 2005). Gray-scale findings include solid material within the portal vein lumen that may be anechoic, hypoechoic, isoechoic, or hyperechoic. The portal vein diameter may be normal, or it may be expanded. Doppler imaging may show absent color flow or areas in the vessel that do not fill with color completely. Tumor thrombus may be distinguished from bland thrombus by the presence of arterial waveforms within the thrombus, a finding that is specific but not very sensitive (Rossi et al, 2006; see Fig. 13.16). Recent work with microbubble sonographic contrast media suggests that contrast administration improves both detection and characterization of thrombi in the portal system (Rossi et al, 2006). Very slow flow in the portal venous system may result in a false-positive sonographic diagnosis; therefore CT or MRI can be useful for confirmation, especially in the evaluation of patients prior to liver transplantation.
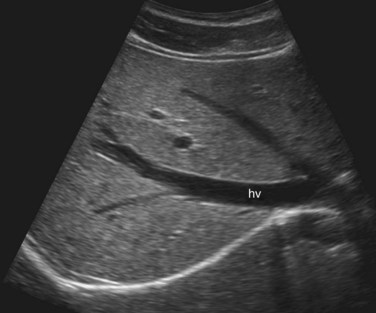
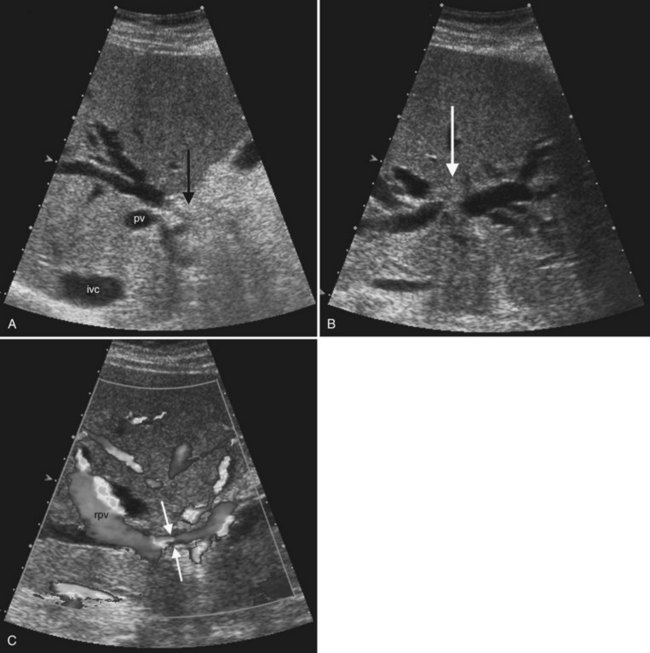
In the setting of long-standing portal vein thrombosis, a collateral hepatopetal venous circulation develops in the hepatic hilum through recanalization of the thrombus and enlargement of collateral veins (de Groen et al, 1999). This phenomenon is known as cavernous transformation of the portal vein, and it manifests on sonography as numerous serpiginous vessels in the periportal region and nonvisualization of the main portal trunk (Wilson, 2005; Fig. 13.22) In patients with cirrhosis, spectral Doppler should be used to confirm the venous character of the varicosities, because enlarged and tortuous hepatic arteries may have a similar appearance on color Doppler. In chronic portal vein thrombosis and cavernous transformation, the morphology of the liver may become distorted, with enlargement of the caudate lobe and segment IV and atrophy of the left lateral segment and/or periphery of the liver (Vilgrain, 2001; Vilgrain et al, 2006; Tublin et al, 2008).
Transjugular Intrahepatic Portosystemic Shunt Evaluation
Transjugular intrahepatic portosystemic shunts (TIPS; see Chapter 76E) are often placed for management of the complications of portal hypertension, such as variceal bleeding, or as a bridge to liver transplantation. Color and spectral Doppler ultrasound is essential for evaluation of these shunts, which typically extend from the right portal vein to the right hepatic vein. In normally functioning TIPS, flow in the portal veins should be directed toward the TIPS rather than antegrade into the liver parenchyma. Color Doppler should therefore show reversed flow direction in the left and right portal veins. The flow velocity within the mid and distal segments of the shunt should range from 90 to 200 cm/s (Abbitt, 2002; Tchelepi et al, 2002). TIPS evaluation with ultrasound is usually performed immediately after shunt placement to obtain baseline velocity values and at 3-month intervals thereafter to monitor for dysfunction that could indicate developing stenosis. Absent flow on color and spectral Doppler is 100% sensitive and 96% specific for shunt thrombosis (Abbitt, 2002). Doppler sonography can also detect stenosis of the hepatic vein receiving the shunt. An angle-corrected peak velocity below 50 cm/s or reversal of flow in the proximal portion of the hepatic vein suggests stenosis (Abbitt, 2002; Dodd et al, 1995). Other authors have found that an increase or decrease in peak stent velocity of more than 50 cm/s compared with baseline is 93% sensitive and 77% specific for shunt stenosis (Dodd et al, 1995).
Budd-Chiari Syndrome and Venoocclusive Disease (See Chapter 77)
Hepatic venous outflow obstruction may be secondary to obstruction of the inferior vena cava, hepatic veins, or hepatic venules. Etiologies include venous thrombosis, venous webs, venous obstruction by intrahepatic tumor, or injury to hepatic venules from irradiation and chemotherapy (Cura et al, 2009). The liver becomes enlarged and heterogeneous in echogenicity, but the caudate is typically spared and hypertrophied because of its unique venous drainage (Bargallo et al, 2003). Venous obstruction and ascites are key features of Budd-Chiari syndrome in the acute phase; in the more chronic phase, intrahepatic venous collaterals and regenerating nodules are also present (Brancatelli et al, 2002, 2007).
Ultrasound is a primary imaging method for evaluation of Budd-Chiari syndrome (Kane & Eustace, 1995). Gray-scale imaging of the hepatic vein confluence may show narrowed hepatic veins, tumor encasement, or intraluminal thrombus. On color Doppler imaging the hepatic vein flow alterations and venous collaterals are readily evident, and spectral Doppler analysis shows flattened waveforms or areas of high velocity flow because of the more central venous obstruction (Grant et al, 1989; Ralls et al, 1992; see Fig. 13.22).
Ultrasound of the Gallbladder and Bile Ducts
Normal Anatomy of the Gallbladder and Bile Ducts (See Chapter 1B)
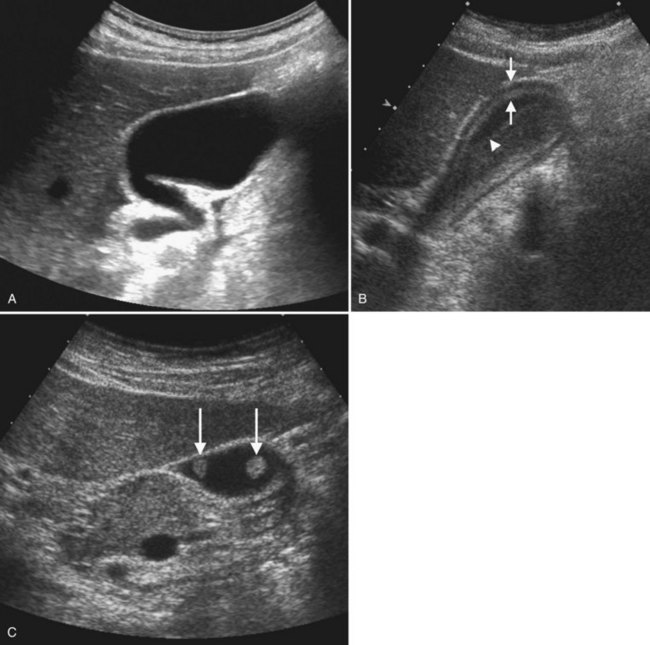
The gallbladder lies on the undersurface of the liver in the plane between the right and left lobes as defined by the middle hepatic vein superiorly and inferiorly by the interlobar fissure, which extends from the right portal vein to the gallbladder fossa. The fundus, body, and neck of the gallbladder are best visualized sonographically from the right intercostal approach with the patient in the left posterior oblique position (Fig. 13.23). At the junction with the cystic duct, the spiral valves of Heister are often visualized. The gallbladder may fold upon itself or may have a phrygian cap appearance at the fundus.
The main bile duct is demarcated into two sections defined by the cystic duct insertion: the common hepatic duct is above; the common bile duct, which traverses the pancreas and enters the duodenum via the sphincter of Oddi, is below the cystic duct insertion. The common bile duct, best seen from the right intercostal approach, normally measures 6 mm in diameter or less. There may be no change or only a slight increase in diameter after cholecystectomy (Mueller et al, 1981; Abbitt, 2002; Feng et al, 1995). The effect of age is controversial, but even in the elderly, the common duct diameter usually does not exceed 7 mm. (Bachar et al, 2003; Horrow et al, 2001; Perret et al, 2000). The right and left main bile ducts are anterior to the portal vein confluence and are best visualized on transverse subcostal ultrasound images. Second order branches may also be seen adjacent to the segmental portal vein branches. The several variant patterns of biliary branching are described in Chapter 1B.
Gallbladder
Cholelithiasis (See Chapter 30)
Ultrasound is the procedure of choice for detection of gallstones, which are highly echogenic and have posterior acoustic shadowing because of the difference in the acoustic impedance between stones and bile (Fig. 13.24; also see Fig. 13.3). It is important to scan patients in different positions, as gallstones are mobile, whereas polyps are fixed. Tumefactive sludge or thick bile may also change with positional variation, but sludge is thick and moves slowly, whereas gallstones roll quickly on real-time ultrasound. Stones in the gallbladder neck may be difficult to visualize, but when the patient is examined in the left lateral decubitus position, they may roll into the gallbladder body or fundus. Fixed stones impacted in the gallbladder neck are frequently associated with cholecystitis. There may be little surrounding bile if large stones or multiple stones fill the entire gallbladder lumen; when this occurs, gallstones are diagnosed by the “wall echo shadow” sign produced by echoes from the anterior gallbladder wall, anterior surface of the stone, and posterior acoustic shadowing.
Cholecystitis (See Chapter 31)
Acute cholecystitis is associated with cystic duct or gallbladder neck obstruction from cholelithiasis in approximately 90% to 95% of cases (Bennett et al, 2003). Ultrasound has 80% to 100% sensitivity, 60% to 100% specificity, and positive predictive value of 94% for the diagnosis (Harvey et al, 1999; Ralls et al, 1985; van Breda Vriesman et al, 2007). Ultrasound findings include gallstones, gallbladder wall thickening greater than 3 mm, pericholecystic fluid, and a positive sonographic Murphy sign (Smith et al, 2009; Teefey et al, 1991; Fig. 13.25).
Gangrenous cholecystitis occurs more often in patients with diabetes mellitus or a white blood cell count greater than 15,000 cells/mL (Fagan et al, 2003). Ultrasound features include floating intraluminal membranes from sloughed mucosa, shadowing foci from air in the gallbladder wall, disrupted gallbladder wall, and pericholecystic abscess formation ( Jeffrey et al, 1983). When emphysematous cholecystitis is present, air in the gallbladder wall produces acoustic shadowing and reverberation artifact. This may be diagnosed sonographically, but CT is more sensitive for the presence of air in the gallbladder wall (Gill et al, 1997).
Gallbladder Polyps and Adenomyomatosis (See Chapter 48)
The spectrum of hyperplastic cholecystosis includes benign cholesterol polyps and adenomyomatosis. Cholesterol polyps are usually numerous, small (2 to 10 mm), nonshadowing, and fixed in position (see Fig. 13.23). These are benign with no malignant potential (Ito et al, 2009; Levy et al, 2002). Adenomyomatosis results from hypertrophy of the smooth muscle in the gallbladder wall with prominent Rokitansky-Aschoff sinuses, which may appear as cystic spaces in the gallbladder wall with a characteristic ring-down or comet tail artifact (see Fig. 13.4). The gallbladder wall thickening may be focal, segmental, or diffuse. Focal thickening is most often seen in the fundus, but when it occurs in the middle region, it produces an hourglass-shaped gallbladder.
Gallbladder Carcinoma
Carcinoma of the gallbladder (see Chapter 49) may appear as a focal mass, thickened gallbladder wall, or infiltrative mass that fills the gallbladder lumen and extends into the adjacent liver and bile ducts (Wibbenmeyer et al, 1995; see Fig. 13.24). When the mass occupies the gallbladder lumen, it can result in a displaced or “trapped” stone that is fixed in position because of an intraluminal tumor (Khalili & Wilson, 2005). Mucosal plaque and wall irregularity of gallbladder carcinoma can be differentiated from other causes of gallbladder wall thickening when tumor vessels are demonstrated on Doppler imaging. Contiguous hepatic involvement in segments IV and V is common. Gallbladder carcinoma also frequently extends into the hepatic hilus and causes biliary obstruction secondary to direct involvement of the common hepatic duct. Adjacent adenopathy may also be present. Ultrasound performs well for detection of the gallbladder primary and local tumor spread, but CT is necessary to more accurately determine resectability, distant disease spread, and peritoneal metastases (Bach et al, 1998).
In the era of laparoscopic surgery for gallstone disease, it is especially important to assess the gallbladder carefully on preoperative ultrasound to exclude occult gallbladder cancer and to plan an appropriate surgical approach. Unfortunately, approximately 47% of gallbladder carcinomas are detected incidentally at laparoscopic cholecystectomy (Duffy et al, 2008). For these patients, reexploration with definitive resection to clear disease and reexcision of laparoscopic port sites is required (D’Angelica et al, 2009; Duffy et al, 2008; Winston et al, 1999).
Biliary Ducts
Congenital Anomalies
Choledochal cysts (see Chapter 46) are classified according to the location of the dilated ductal segment: type 1 is fusiform common duct dilation, type II is diverticulum of the duct, type III is a choledochocele from a dilated terminal portion of the common bile duct, and type IV is multifocal dilation (Todani et al, 1977). The cysts may be large, and the connection with the bile duct is not always evident sonographically (Khalili & Wilson, 2005). Caroli disease is cystic bile duct malformation that results in multiple diverticulum-like outpouchings from the intrahepatic ducts. On imaging, it is important to demonstrate the connection with the bile ducts to differentiate this condition from polycystic disease. Arterial signals from the fibrovascular bundle at the margin of the saccules may also aid in diagnosis (Miller et al, 1995).
Biliary Obstruction
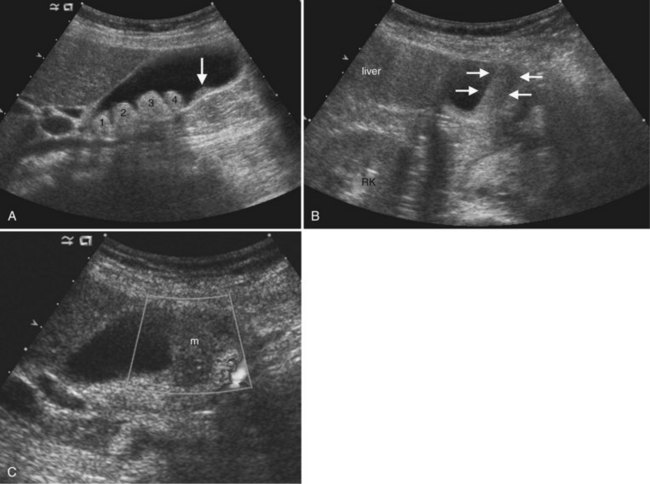
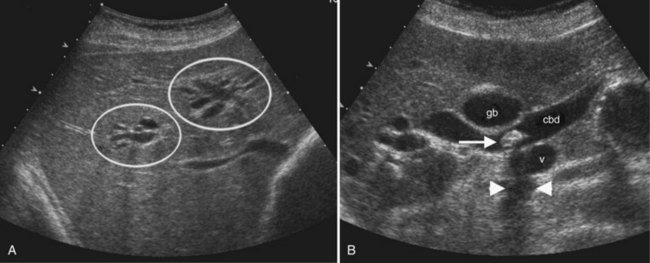
Ultrasound is the preferred initial imaging study to diagnose biliary obstruction and to determine the level of obstruction (Gibson et al, 1986). Signs of intrahepatic biliary obstruction include the “double track” sign and the “too many tubes” sign caused by dilated bile ducts parallel to the portal vein branches (Fig. 13.26). Bile duct dilation is best appreciated in transverse images of the left hepatic lobe. The pattern of bile duct dilation should be assessed to determine whether it is symmetric in both lobes or localized to one portion of the liver. To determine the level of obstruction, the left and right main ducts are followed transversely to their junction, and transverse views of the common hepatic and common bile ducts are obtained. With this approach it is possible to differentiate intrahepatic from extrahepatic obstruction, and usually the etiology of the obstruction can be determined (Fig. 13.27).
Bile duct calculi (see Chapters 35 and 39) appear as intraluminal filling defects (see Fig. 13.26). Because there is little bile surrounding the ductal calculi, acoustic shadowing may not always be elicited. Debris or thick bile within the ducts may cause internal echoes within ducts and fluid levels, but debris does not shadow, and it shifts with positional variation. Hemobilia (see Chapter 105) may layer or appear echogenic and masslike if the clot is organized. Intraductal tumor from colorectal metastases or HCC may also appear as an intraductal mass, but tumor often expands the duct, and it does not produce acoustic shadowing (Ghittoni et al, 2009; Jhaveri et al, 2009). Obstruction as a result of biliary ascariasis is associated with tubular structures within the bile duct, and movement of the worms is pathognomonic (Lim, 1990; see Chapter 45).
The pattern of biliary obstruction and the appearance of the duct wall are also useful for diagnosis. Recurrent pyogenic cholangitis (see Chapter 44) is evidenced by dilated ducts with intraductal calculi, but dilation is often segmental, frequently in the left lobe. Lobar atrophy may also be present. Primary sclerosing cholangitis (see Chapter 41) causes a beaded appearance of the ducts with wall thickening, strictures, and discontinuous areas of dilation. Mural thickening of the ducts also is seen with AIDS-associated cholangitis. For tumors adjacent to the umbilical portion of the left portal vein, subtle bile duct dilation or wall thickening may be a clue to biliary ductal involvement.
In patients with biliary obstruction who are being considered for surgical resection or palliative biliary drainage, the distribution of biliary ductal dilation should be carefully evaluated to determine management. For example, if surgery is being considered for a mass or vascular or biliary ductal involvement in one lobe, and main biliary duct obstruction is in a contralateral lobe, the disease is not resectable (Jarnagin et al, 2001). Any isolated biliary ductal segments that do not communicate with the main ducts should be noted, as isolated segments may alter surgical approach, and biliary drainage may require placement of multiple catheters.
Primary Bile Duct Neoplasms
Intrahepatic Cholangiocarcinoma.
Cholangiocarcinoma is the second most common primary hepatic neoplasm after HCC. The peripheral intrahepatic form arises from the intralobular ducts and presents as a focal hepatic mass that is usually solitary, but satellites may occur. Intrahepatic cholangiocarcinoma (see Chapter 50A) has associated peripheral biliary ductal dilation in 25%, may have capsular retraction, and lacks venous thrombosis; these features help differentiate peripheral cholangiocarcinoma from HCC (Soyer et al, 1995; Chung et al, 2009).
Hilar and Distal Cholangiocarcinoma.
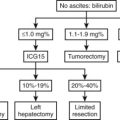
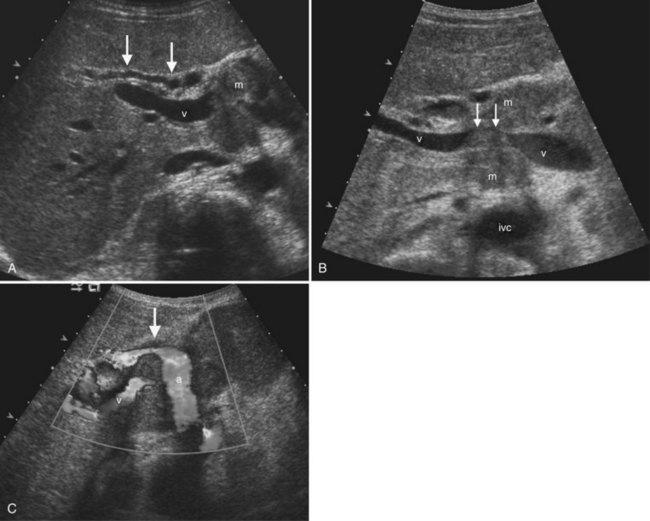
Hilar cholangiocarcinoma or Klatskin tumor (see Chapter 50C), occurs at the biliary confluence. It is best evaluated by ultrasound prior to placement of biliary drainage catheters, as pneumobilia or stent artifact may obscure tumor margins, and the pattern of biliary obstruction may not be evident after decompression. Hilar cholangiocarcinoma is classified by extent of tumor along the duct, and some staging systems also include the status of the portal vein, because direct encasement of the adjacent vessels is common; surgical approach is determined by both portal vein status and ductal spread (de Groen et al, 1999; Jarnagin et al, 2001; Fig. 13.28).
On ultrasound, extrahepatic cholangiocarcinoma (see Chapter 50B) may be infiltrating, nodular, or papillary (Hann et al, 1997). The papillary form, which is expansile, has a better prognosis and surgical outcome (Jarnagin et al, 2005). With experienced operators, ultrasound can correctly identify 96% of extrahepatic cholangiocarcinomas and can demonstrate tumor infiltration along the duct wall ( Lim, 2003; Robledo et al, 1996). Ultrasound contrast agents aid diagnosis and staging (Lim et al, 2006). Khalili and colleagues (2003) reported that correct prediction of resectability improved from 69% on noncontrast ultrasound to 96% after contrast.
Ultrasound of the Pancreas
Anatomy and Technique
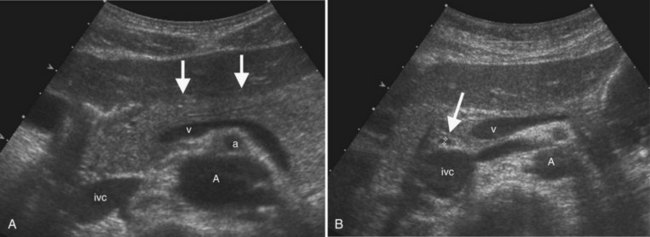
The pancreas is oriented transversely in the epigastrium (see Chapter 1A, Chapter 1B ) and is situated immediately ventral to the splenic vein (Fig. 13.29). The latter serves as a useful landmark for locating the pancreas because the organ may sometimes appear isoechoic with the surrounding fat. The splenic vein unites with the superior mesenteric vein (SMV) just posterior to the neck of the pancreas, so that the SMV is a useful anatomic landmark that separates the head from the neck of the pancreas. Normal pancreas is homogeneously echogenic and generally of higher echogenicity than the normal liver. In thin patients, the normal pancreatic duct may be visible as an anechoic tubular structure oriented along the long axis of the pancreas. The normal pancreatic duct in young patients should measure no larger than 2 mm in diameter. On transverse images, the common bile duct can usually be visualized in cross section in the posterior aspect of the head of the pancreas (see Fig. 13.29). The gastroduodenal artery can often be seen in cross section along the right anterior aspect of the pancreatic head.
Because of its midline and posterior location, the pancreas is often partially obscured by overlying gas in the stomach. Therefore when primary pancreatic pathology is suspected, CT is the preferred imaging modality (see Chapter 16). Nevertheless, routine abdominal sonograms should include the pancreas, and when sonography is performed for biliary colic or suspected biliary dilation, every attempt must be made to visualize at least the pancreatic head. It is usually best to begin scans of the abdomen by obtaining images of the pancreas, because the deep inspiratory scans used to image the liver lead to aerophagia and diminish the likelihood of pancreatic visualization. Positional maneuvers, such as sitting the patient upright to displace the stomach gas into the fundus, may help with pancreatic visualization if overlying gas is present in the supine position.
Pancreatitis
Acute pancreatitis (see Chapters 52 and 53) is a common cause of abdominal pain and is usually diagnosed clinically and with laboratory examination findings. Although CT is the preferred technique for gauging the severity and extent of acute pancreatitis, sonography in this setting is useful to determine whether the disease was triggered by gallstones, because the sensitivity of CT for detection of gallstones has been reported to be as low as 25% (Chan et al, 2006). Direct visualization of the pancreas itself on ultrasound may be impaired by gas from an overlying paralytic ileus at initial presentation. In mild pancreatitis, no sonographic abnormalities may be appreciable. If the inflammation is diffuse and more severe, the pancreas may be uniformly hypoechoic. The presence of pancreatic necrosis or hemorrhage cannot be determined reliably with ultrasound; CT is therefore necessary for accurate evaluation.
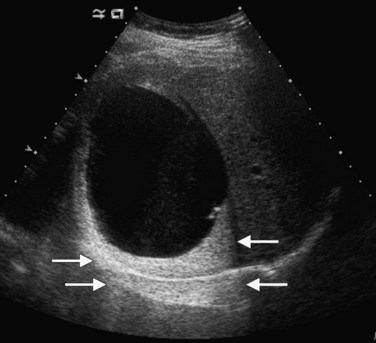
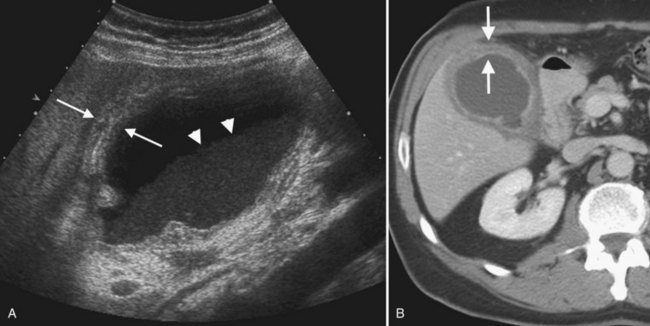
Other complications of acute pancreatitis, such as extrapancreatic and intrapancreatic fluid collections and pseudocysts, may be readily seen with sonography (see Chapter 54). Pseudocysts form in approximately 10% to 20% of patients with acute pancreatitis (Atri & Finnegan, 2005). They are loculated fluid collections contained within a wall of collagen and granulation tissue, and they generally take 4 to 6 weeks to form following an acute episode of pancreatitis (Atri & Finnegan, 2005; Balthazar, 2002). On sonography, pseudocysts are typically well-marginated ovoid or spherical anechoic masses with posterior acoustic enhancement (Fig. 13.30). Internal echoes representing hemorrhage or debris may be present in the early stages, and calcification of the pseudocyst wall may occur. Color Doppler should always be used to evaluate any epigastric cystic mass, including those seen in the setting of pancreatitis, to distinguish these fluid collections from other complications of pancreatitis such as pseudoaneurysms. Color Doppler will also enable detection of splenic vein thrombosis, which occurs in 1% to 3% of patients following acute pancreatitis (Balthazar, 2002).
With repeated episodes of mild acute or subclinical pancreatitis, chronic inflammation with scarring and destruction of pancreatic parenchyma occurs. The changes of chronic pancreatitis seen on sonography include dilation and irregularity of the main pancreatic duct, intraductal calcifications, and focal inflammatory masses (Atri & Finnegan, 2005; see Chapter 55A). The latter may be especially problematic, because these hypoechoic focal regions mimic the ultrasound appearance of pancreatic carcinoma. The finding of calcifications within a hypoechoic focal mass is helpful for differentiating the two entities and suggests chronic pancreatitis, rather than carcinoma, as the etiology. Common duct dilation can be seen in 5% to 10% of patients with chronic pancreatitis (Bolondi et al, 1989), although again, other etiologies—including a downstream obstructing adenocarcinoma or intraductal papillary mucinous neoplasm—should also be considered in the differential diagnosis of main pancreatic duct dilation. Again, calcification visible within the pancreas makes chronic pancreatitis more likely.
Autoimmune lymphoplasmacytic pancreatitis is an unusual type of chronic pancreatitis characterized by fibrotic change with lymphocytic infiltration (Fig. 13.31). On imaging studies, the gland is diffusely or focally swollen, and the main duct is irregularly narrowed (Araki et al, 2006; Sahani et al, 2004). This type of pancreatitis is highly responsive to steroids, and recent studies of contrast-enhanced sonography suggest that the degree of vascularity evident following contrast injection correlates directly with the pathologic grade of inflammation and inversely with the grade of fibrosis (Numata et al, 2004).
Pancreatic Neoplasms
Solid Neoplasms of the Pancreas
Although best staged by CT, adenocarcinoma of the pancreatic head is often detected on sonography, because ultrasound is typically the initial imaging study for evaluation of jaundice, right upper quadrant pain, and epigastric pain (see Chapter 58B). The typical pancreatic adenocarcinoma is an ill-defined hypoechoic mass associated with abrupt dilation of the upstream pancreatic duct and atrophy of the more distal pancreas (Fig. 13.32). Carcinomas of the pancreatic head typically also cause biliary dilation and a “Courvoisier gallbladder.” Dilation of both the pancreatic duct and common bile duct, the “double-duct sign,” is always a suspicious imaging finding for pancreatic adenocarcinoma, with any imaging modality. Adenocarcinoma in the body or tail of the pancreas is inconsistently visualized on sonography because of variables such as patient body habitus and overlying gastric or bowel gas. Color Doppler sonography typically does not show increased vascularity within pancreatic adenocarcinoma. Nevertheless, this mode can be useful to visualize the peripancreatic vasculature, such as the celiac axis and superior mesenteric vessels, which are often encased in locally advanced disease (Atri & Finnegan, 2005).
In contrast to adenocarcinomas, neuroendocrine tumors of the pancreas are commonly hypervascular masses (see Chapter 61). They are typically more hypoechoic than adenocarcinomas and may be well defined and smoothly marginated. Intraoperative ultrasound is often a useful adjunct to surgery for pancreatic neuroendocrine tumors, because many are localized and can be safely enucleated. In patients with multiple endocrine neoplasia type I (MEN-I), real-time intraoperative scanning can also help identify additional subcentimeter neuroendocrine tumors that may escape CT detection (Shin et al, 2009).
Cystic Neoplasms of the Pancreas
Cystic pancreatic neoplasms (see Chapter 57) fall into two major categories: serous (microcystic) neoplasms and mucinous (macrocystic) neoplasms. The two should be distinguished on imaging, because serous tumors are always benign, but mucinous tumors have malignant potential. Differentiation can be made on imaging studies based on the internal architecture and size of the cysts. Serous tumors have cysts ranging in size from less than 1 mm to 2 cm in size, and the internal architecture is often described as having a honeycomb appearance (Fig. 13.33). However, these tumors can vary considerably in sonographic appearance based on the sizes of the internal cysts they comprise. Serous tumors composed of relatively larger cysts will appear as partially solid cystic masses on sonography. As the cysts in a serous tumor get smaller, the less likely it is that the individual cyst cavities and walls will be resolvable on ultrasound; instead, the numerous interfaces created by the walls of the cysts will confer an overall echogenic appearance to the mass. A central stellate scar is a characteristic feature of many serous cystadenomas and may be visible as an echogenic or frankly calcified focus with shadowing (Atri & Finnegan, 2005; Hutchins et al, 2009).
Endoscopic ultrasound is very useful in evaluation of cystic pancreatic neoplasms, because the internal architecture of the lesions is much better demonstrated. The lesions can also be aspirated under endoscopic ultrasound, and the fluid can be evaluated for the presence of glycogen (serous tumors), mucin (mucinous tumors), and tumor markers such as carcinoembryonic antigen (Hutchins et al, 2009).
Abbitt PL. Ultrasonography of the liver: an update on new applications. Clin Liv Dis. 2002;6:17-28.
Albrecht T, et al. Improved detection of hepatic metastases with pulse-inversion US during the liver-specific phase of SHU 508A: multicenter study. Radiology. 2003;227:361-370.
Albrecht T, et al. Guidelines for the use of contrast agents in ultrasound. Ultraschall Med. 2004;25:249-256.
Araki J, et al. Natural course of autoimmune pancreatitis without steroid therapy showing hypoechoic masses in the uncinate process and tail of the pancreas on ultrasonography. J Ultrasound Med. 2006;25:1063-1067.
Atri M, Finnegan PW. The pancreas. In: Rumack, C, Wilson, S, Charboneau, J. Diagnostic Ultrasound. 3rd ed. St Louis: Mosby; 2005:213-267.
Bach AM, et al. Gallbladder cancer: can ultrasonography evaluate extent of disease? J Ultrasound Med. 1998;17:303-309.
Bachar GN, et al. Effect of aging on the adult extrahepatic bile duct: a sonographic study. J Ultrasound Med. 2003;22:879-882.
Balthazar EJ. Complications of acute pancreatitis: clinical and CT evaluation. Radiol Clin North Am. 2002;40:1211-1227.
Bargallo X, et al. Sonography of the caudate vein: value in diagnosing Budd-Chiari syndrome. Am J Roentgenol. 2003;181:1641-1645.
Bartolotta TV, et al. Characterization of benign hepatic tumors arising in fatty liver with SonoVue and pulse inversion US. Abdom Imaging. 2007;32:84-91.
Bartolozzi C, et al. Differentiation of hepatocellular adenoma and focal nodular hyperplasia of the liver: comparison of power Doppler imaging and conventional color Doppler sonography. Eur Radiol. 1997;7:1410-1415.
Bekker J, et al. Early hepatic artery thrombosis after liver transplantation: a systematic review of the incidence, outcome and risk factors. Am J Transplant. 2009;9:746-757.
Bennett GL, et al. Sonographic detection of hepatocellular carcinoma and dysplastic nodules in cirrhosis: correlation of pretransplantation sonography and liver explant pathology in 200 patients. Am J Roentgenol. 2002;179:75-80.
Bennett GL, et al. Ultrasound and CT evaluation of emergent gallbladder pathology. Radiol Clin North Am. 2003;41:1203-1216.
Berber E, et al. Laparoscopic ultrasound. Surg Clin North Am. 2004;84:1061-1084.
Blomley MJ, et al. Improved imaging of liver metastases with stimulated acoustic emission in the late phase of enhancement with the US contrast agent SH U 508A: early experience. Radiology. 1999;210:409-416.
Bolondi L, et al. Sonography of chronic pancreatitis. Radiol Clin North Am. 1989;27:815-833.
Brancatelli G, et al. Benign regenerative nodules in Budd-Chiari syndrome and other vascular disorders of the liver: radiologic–pathologic and clinical correlation. Radiographics. 2002;22:847-862.
Brancatelli G, et al. Budd-Chiari syndrome: spectrum of imaging findings. Am J Roentgenol. 2007;188:W168-W176.
Brannigan M, et al. Blood flow patterns in focal liver lesions at microbubble-enhanced US. Radiographics. 2004;24:921-935.
Bryant TH, et al. Improved characterization of liver lesions with liver-phase uptake of liver-specific microbubbles: prospective multicenter study. Radiology. 2004;232:799-809.
Buetow PC, et al. Focal nodular hyperplasia of the liver: radiologic–pathologic correlation. Radiographics. 1996;16:369-388.
Caiado AH, et al. Complications of liver transplantation: multimodality imaging approach. Radiographics. 2007;27:1401-1417.
Caturelli E, et al. Hemangioma-like lesions in chronic liver disease: diagnostic evaluation in patients. Radiology. 2001;220:337-342.
Caturelli E, et al. Coarse nodular US pattern in hepatic cirrhosis: risk for hepatocellular carcinoma. Radiology. 2003;226:691-697.
Caturelli E, et al. Ultrasound-guided fine needle biopsy of early hepatocellular carcinoma complicating liver cirrhosis: a multicentre study. Gut. 2004;53:1356-1362.
Chan AC, et al. Changing paradigm in the management of hepatocellular carcinoma improves the survival benefit of early detection by screening. Ann Surg. 2008;247:666-673.
Chan WC, et al. Gallstone detection at CT in vitro: effect of peak voltage setting. Radiology. 2006;241:546-553.
. There is a hyperechoic mass in the liver: what does that mean?, Categorical Course in Diagnostic Radiology: Findings at Ultrasound—What do they Mean, Charboneau, JW, editor. Cooperberg PL. Chicago: Radiological Society of North America. 2002:73-78.
Choi BI, et al. Small hepatocellular carcinomas and associated nodular lesions of the liver: pathology, pathogenesis, and imaging findings. Am J Roentgenol. 1993;160:1177-1187.
Chung YE, et al. Hepatocellular carcinoma variants: radiologic–pathologic correlation. Am J Roentgenol. 2009;193:W7-W13.
Colli A, et al. Abnormalities of Doppler waveform of the hepatic veins in patients with chronic liver disease: correlation with histologic findings. Am J Roentgenol. 1994;162:833-837.
Collier J, et al. Screening for hepatocellular carcinoma. Hepatology. 1998;27:273-278.
Couinaud C. Études Anatomiques et Chirurgicales. Paris: Masson; 1957.
Cura M, et al. Diagnostic and interventional radiology for Budd-Chiari syndrome. Radiographics. 2009;29:669-681.
D’Angelica M, et al. Analysis of the extent of resection for adenocarcinoma of the gallbladder. Ann Surg Oncol. 2009;16:806-816.
de Groen PC, et al. Biliary tract cancers. N Engl J Med. 1999;341:1368-1378.
Dietrich CF, et al. Differentiation of focal nodular hyperplasia and hepatocellular adenoma by contrast-enhanced ultrasound. Br J Radiol. 2005;78:704-707.
Ding H, et al. Imaging of focal liver lesions: low-mechanical-index real-time ultrasonography with SonoVue. J Ultrasound Med. 2005;24:285-297.
Dodd GD, et al. Detection of transjugular intrahepatic portosystemic shunt dysfunction: value of duplex Doppler sonography. Am J Roentgenol. 1995;164:1119-1124.
Duffy A, et al. Gallbladder cancer (GBC): 10-year experience at Memorial Sloan–Kettering Cancer Centre (MSKCC). J Surg Oncol. 2008;98:485-489.
Eberhardt SC, et al. Utility of sonography for small hepatic lesions found on computed tomography in patients with cancer. J Ultrasound Med. 2003;22:335-343.
El-Serag HB, et al. Rising incidence of hepatocellular carcinoma in the United States. N Engl J Med. 1999;340:745-750.
Ewertsen C, et al. Biopsy guided by real-time sonography fused with MRI: a phantom study. Am J Roentgenol. 2008;190:1671-1674.
Fagan SP, et al. Prognostic factors for the development of gangrenous cholecystitis. Am J Surg. 2003;186:481-485.
Feldman MK, et al. US artifacts. Radiographics. 2009;29:1179-1189.
Feng B, et al. Does the common bile duct dilate after cholecystectomy? Sonographic evaluation in 234 patients. Am J Roentgenol. 1995;165:859-861.
Fennessy FM, et al. Hepatic capsular retraction in metastatic carcinoma of the breast occurring with increase or decrease in size of subjacent metastasis. Am J Roentgenol. 2004;182:651-655.
Filly RA, et al. Sonographic evaluation of liver nodularity: inspection of deep versus superficial surfaces of the liver. J Clin Ultrasound. 2002;30:399-407.
Foucher J, et al. Diagnosis of cirrhosis by transient elastography (FibroScan): a prospective study. Gut. 2006;55:403-408.
Friedrich-Rust M, et al. Real-time elastography for noninvasive assessment of liver fibrosis in chronic viral hepatitis. Am J Roentgenol. 2007;188:758-764.
Garcia-Criado A, et al. Radiology in liver transplantation. Semin Ultrasound CT MR. 2002;23:114-129.
Ghittoni G, et al. Intrabile duct metastasis from colonic adenocarcinoma without liver parenchyma involvement: contrast-enhanced ultrasonography detection. Abdom Imaging. 2010;35(3):346-348.
Gibson RN, et al. Bile duct obstruction: radiologic evaluation of level, cause, and tumor resectability. Radiology. 1986;160:43-47.
Gill KS, et al. The changing face of emphysematous cholecystitis. Br J Radiol. 1997;70:986-991.
Giorgio A, et al. Contrast-enhanced sonographic appearance of hepatocellular carcinoma in patients with cirrhosis: comparison with contrast-enhanced helical CT appearance. Am J Roentgenol. 2004;183:1319-1326.
Golli M, et al. Hepatocellular adenoma: color Doppler US and pathologic correlations. Radiology. 1994;190:741-744.
Gosink BB, et al. Ultrasonic determination of hepatomegaly. J Clin Ultrasound. 1981;9:37-44.
Goyal N, et al. Non-invasive evaluation of liver cirrhosis using ultrasound. Clin Radiol. 2009;64:1056-1066.
Grant EG, et al. Budd-Chiari syndrome: the results of duplex and color Doppler imaging. Am J Roentgenol. 1989;152:377-381.
Grazioli L, et al. Hepatic adenomas: imaging and pathologic findings. Radiographics. 2001;21:877-892.
Hann LE, et al. Cholangiocarcinoma at the hepatic hilus: sonographic findings. Am J Roentgenol. 1997;168:985-989.
Harvey CJ, et al. Hepatic malignancies: improved detection with pulse-inversion US in late phase of enhancement with SH U 508A: early experience. Radiology. 2000;216:903-908.
Harvey RT, et al. Acute biliary disease: initial CT and follow-up US versus initial US and follow-up CT. Radiology. 1999;213:831-836.
Horrow MM, et al. Is age associated with size of adult extrahepatic bile duct?: sonographic study. Radiology. 2001;221:411-414.
Hussain SM, et al. Focal nodular hyperplasia: findings at state-of-the-art MR imaging, US, CT, and pathologic analysis. Radiographics. 2004;24:3-17.
Hutchins GF, et al. Cystic neoplasms of the pancreas: a diagnostic challenge. World J Gastroenterol. 2009;15:48-54.
Inoue T, et al. Value of liver parenchymal phase contrast-enhanced sonography to diagnose premalignant and borderline lesions and overt hepatocellular carcinoma. Am J Roentgenol. 2009;192:698-705.
Ito H, et al. Polypoid lesions of the gallbladder: diagnosis and follow up. J Am Coll Surg. 2009;208:570-575.
Jang HJ, et al. Enhancement patterns of hepatocellular carcinoma at contrast-enhanced US: comparison with histologic differentiation. Radiology. 2007;244:898-906.
Jang HJ, et al. Small nodules (1-2 cm) in liver cirrhosis: characterization with contrast-enhanced ultrasound. Eur J Radiol. 2008;72(3):418-424.
Jarnagin WR, et al. Staging, resectability, and outcome in 225 patients with hilar cholangiocarcinoma. Ann Surg. 2001;234:507-517. discussion 517-509
Jarnagin WR, et al. Papillary phenotype confers improved survival after resection of hilar cholangiocarcinoma. Ann Surg. 2005;241(5):703-712.
Jeffrey RB, et al. Gangrenous cholecystitis: diagnosis by ultrasound. Radiology. 1983;148:219-221.
Jhaveri KS, et al. Intrahepatic bile duct dilation due to liver metastases from colorectal carcinoma. Am J Roentgenol. 2009;193:752-756.
Jung EM, et al. New real-time image fusion technique for characterization of tumor vascularisation and tumor perfusion of liver tumors with contrast-enhanced ultrasound, spiral CT or MRI: first results. Clin Hemorheol Microcirc. 2009;43:57-69.
Kamaya A, et al. Hypervascular liver lesions. Semin Ultrasound CT MR. 2009;30:387-407.
Kane R, Eustace S. Diagnosis of Budd-Chiari syndrome: comparison between sonography and MR angiography. Radiology. 1995;195(1):117-121.
Khalili K, Wilson SR. The biliary tree and gallbladder. In: Rumack CM, Wilson SR, Charboneau JW, editors. Diagnostic Ultrasound, vol 1. St Louis: Mosby Elsevier; 2005:171-211.
Khalili K, et al. Hilar biliary obstruction: preliminary results with Levovist-enhanced sonography. Am J Roentgenol. 2003;180:687-693.
Kim T, et al. Liver masses with central or eccentric scar. Semin Ultrasound CT MR. 2009;30:418-425.
Kim TK, et al. Benign liver masses: imaging with microbubble contrast agents. Ultrasound. 2006;22:31-39.
Kim TK, et al. Focal nodular hyperplasia and hepatic adenoma: differentiation with low-mechanical-index contrast-enhanced sonography. Am J Roentgenol. 2008;190:58-66.
Koito K, et al. Differential diagnosis of small hepatocellular carcinoma and adenomatous hyperplasia with power Doppler sonography. Am J Roentgenol. 1998;170:157-161.
Kojiro M, et al. Hepatocellular carcinoma presenting as intra-bile duct tumor growth: a clinicopathologic study of 24 cases. Cancer. 1982;49:2144-2147.
Korner M, et al. Current role of emergency US in patients with major trauma. Radiographics. 2008;28:225-242.
Kruskal JB, et al. Hepatic colon cancer metastases in mice: dynamic in vivo correlation with hypoechoic rims visible at US. Radiology. 2000;215:852-857.
Lafortune M, et al. Segmental anatomy of the liver: a sonographic approach to the Couinaud nomenclature. Radiology. 1991;181:443-448.
Leifer DM, et al. Follow-up of patients at low risk for hepatic malignancy with a characteristic hemangioma at US. Radiology. 2000;214:167-172.
Lencioni R, et al. Portal vein thrombosis after percutaneous ethanol injection for hepatocellular carcinoma: value of color Doppler sonography in distinguishing chemical and tumor thrombi. Am J Roentgenol. 1995;164:1125-1130.
Levy AD, et al. Benign tumors and tumorlike lesions of the gallbladder and extrahepatic bile ducts: radiologic–pathologic correlation. From the archives of the Armed Forces Institute of Pathology. Radiographics. 2002;22:387-413.
Lewall DB, et al. Hepatic echinococcal cysts: sonographic appearance and classification. Radiology. 1985;155:773-775.
Lim JH. Radiologic findings of clonorchiasis. Am J Roentgenol. 1990;155:1001-1008.
Lim JH. Cholangiocarcinoma: morphologic classification according to growth pattern and imaging findings. Am J Roentgenol. 2003;181:819-827.
Lim JH, et al. Early bile duct carcinoma: comparison of imaging features with pathologic findings. Radiology. 2006;238:542-548.
Lin DY, et al. Ultrasonographic changes of early liver cirrhosis in chronic hepatitis B: a longitudinal study. J Clin Ultrasound. 1993;21:303-308.
Liu LP, et al. Focal hypoechoic tumors of fatty liver: characterization of conventional and contrast-enhanced ultrasonography. J Ultrasound Med. 2009;28:1133-1142.
Machi J, et al. Intraoperative ultrasound. Surg Clin North Am. 2004;84:1085-1111.
Marchal G, et al. Correlation of sonographic patterns in liver metastases with histology and microangiography. Invest Radiol. 1985;20:79-84.
McGahan JP, et al. Appearance of solid organ injury with contrast-enhanced sonography in blunt abdominal trauma: preliminary experience. Am J Roentgenol. 2006;187:658-666.
McLarney JK, et al. Fibrolamellar carcinoma of the liver: radiologic–pathologic correlation. Radiographics. 1999;19:453-471.
Middleton WD. There are nonhyperechoic lesions in the liver: what does that mean? In: Cooperberg, PL, editor. Categorical Course in Diagnostic Radiology: Findings at Ultrasound—What do they Mean. Chicago: Radiological Society of North America; 2002:79-90.
Miller WJ, et al. Imaging findings in Caroli’s disease. Am J Roentgenol. 1995;165:333-337.
Mok TS, et al. False-negative rate of abdominal sonography for detecting hepatocellular carcinoma in patients with hepatitis B and elevated serum alpha-fetoprotein levels. Am J Roentgenol. 2004;183:453-458.
Mortele KJ, et al. Imaging of diffuse liver disease. Semin Liver Dis. 2001;21:195-212.
Mueller PR, et al. Postcholecystectomy bile duct dilatation: myth or reality? Am J Roentgenol. 1981;136:355-358.
Nguyen BN, et al. Focal nodular hyperplasia of the liver: a comprehensive pathologic study of 305 lesions and recognition of new histologic forms. Am J Surg Pathol. 1999;23:1441-1454.
Niederau C, et al. Sonographic measurements of the normal liver, spleen, pancreas, and portal vein. Radiology. 1983;149:537-540.
Numata K, et al. Contrast-enhanced sonography of autoimmune pancreatitis: comparison with pathologic findings. J Ultrasound Med. 2004;23:199-206.
Pastacaldi S, et al. Hepatic artery thrombosis after orthotopic liver transplantation: a review of nonsurgical causes. Liver Transpl. 2001;7:75-81.
Perret RS, et al. Common bile duct measurements in an elderly population. J Ultrasound Med. 2000;19:727-730. quiz 731
Quaia E, et al. Characterization of focal liver lesions with contrast-specific US modes and a sulfur hexafluoride–filled microbubble contrast agent: diagnostic performance and confidence. Radiology. 2004;232:420-430.
Quaia E, et al. Diagnostic value of hepatocellular nodule vascularity after microbubble injection for characterizing malignancy in patients with cirrhosis. Am J Roentgenol. 2007;189:1474-1483.
Quiroga S, et al. Complications of orthotopic liver transplantation: spectrum of findings with helical CT. Radiographics. 2001;21:1085-1102.
Ralls PW, et al. Real-time sonography in suspected acute cholecystitis. Prospective evaluation of primary and secondary signs. Radiology. 1985;155:767-771.
Ralls PW, et al. Budd-Chiari syndrome: detection with color Doppler sonography. Am J Roentgenol. 1992;159:113-116.
Ricci P, et al. Behavior of hepatocellular adenoma on real-time low-mechanical index contrast-enhanced ultrasonography with a second-generation contrast agent. J Ultrasound Med. 2008;27:1719-1726.
Robledo R, et al. Extrahepatic bile duct carcinoma: US characteristics and accuracy in demonstration of tumors. Radiology. 1996;198:869-873.
Rossi S, et al. Contrast-enhanced versus conventional and color Doppler sonography for the detection of thrombosis of the portal and hepatic venous systems. Am J Roentgenol. 2006;186:763-773.
Rubaltelli L, et al. The role of vascularization in the formation of echographic patterns of hepatic metastases: microangiographic and echographic study. Br J Radiol. 1980;53:1166-1168.
Sahani DV, et al. Autoimmune pancreatitis: imaging features. Radiology. 2004;233:345-352.
Sato T, et al. Ultrasound surveillance for early detection of hepatocellular carcinoma among patients with chronic hepatitis C. Hepatol Int. 2009;3(4):544-550.
Shah ZK, et al. Enhancing and expansile portal vein thrombosis: value in the diagnosis of hepatocellular carcinoma in patients with multiple hepatic lesions. Am J Roentgenol. 2007;188:1320-1323.
Shaw AS, et al. Ultrasound of non-vascular complications in the post liver transplant patient. Clin Radiol. 2003;58:672-680.
Shin LK, et al. Intraoperative ultrasound of the pancreas. Ultrasound. 2009;25:39-48.
Smith EA, et al. Cross-sectional imaging of acute and chronic gallbladder inflammatory disease. Am J Roentgenol. 2009;192:188-196.
Smith MT, et al. Best cases from the AFIP: fibrolamellar hepatocellular carcinoma. Radiographics. 2008;28:609-613.
Soyer P, et al. Surgical segmental anatomy of the liver: demonstration with spiral CT during arterial portography and multiplanar reconstruction. Am J Roentgenol. 1994;163:99-103.
Soyer P, et al. Imaging of intrahepatic cholangiocarcinoma: 1. Peripheral cholangiocarcinoma. Am J Roentgenol. 1995;165:1427-1431.
Strobel D, et al. Tumor-specific vascularization pattern of liver metastasis, hepatocellular carcinoma, hemangioma and focal nodular hyperplasia in the differential diagnosis of 1,349 liver lesions in contrast-enhanced ultrasound (CEUS). Ultraschall Med. 2009;30:376-382.
Tamsel S, et al. Vascular complications after liver transplantation: evaluation with Doppler US. Abdom Imaging. 2007;32:339-347.
Tanaka K, et al. Diagnosis of portal vein thrombosis in patients with hepatocellular carcinoma: efficacy of color Doppler sonography compared with angiography. Am J Roentgenol. 1993;160:1279-1283.
Tanaka S, et al. Hepatocellular carcinoma: sonographic and histologic correlation. Am J Roentgenol. 1983;140:701-707.
Tanaka S, et al. Color Doppler flow imaging of liver tumors. Am J Roentgenol. 1990;154:509-514.
Tchelepi H, et al. Sonography of diffuse liver disease. J Ultrasound Med. 2002;21:1023-1032. quiz 1033-1024
Teefey SA, et al. Sonography of the gallbladder: significance of striated (layered) thickening of the gallbladder wall. Am J Roentgenol. 1991;156:945-947.
Todani T, et al. Congenital bile duct cysts: classification, operative procedures, and review of thirty-seven cases including cancer arising from choledochal cyst. Am J Surg. 1977;134:263-269.
Tong MJ, et al. Surveillance for hepatocellular carcinoma in patients with chronic viral hepatitis in the United States of America. J Gastroenterol Hepatol. 2001;16:553-559.
Townsend RR, et al. Abdominal lymphoma in AIDS: evaluation with US. Radiology. 1989;171:719-724.
Treece G, et al. 3D ultrasound measurement of large organ volume. Med Image Anal. 2001;5:41-54.
Trevisani F, et al. Surveillance for early diagnosis of hepatocellular carcinoma: is it effective in intermediate/advanced cirrhosis? Am J Gastroenterol. 2007;102:2448-2457.
Trillaud H, et al. Characterization of focal liver lesions with SonoVue-enhanced sonography: international multicenter-study in comparison to CT and MRI. World J Gastroenterol. 2009;15:3748-3756.
Tublin ME, et al. Altered liver morphology after portal vein thrombosis: not always cirrhosis. Dig Dis Sci. 2008;53:2784-2788.
Ungermann L, et al. Focal nodular hyperplasia: spoke-wheel arterial pattern and other signs on dynamic contrast-enhanced ultrasonography. Eur J Radiol. 2007;63:290-294.
van Breda Vriesman AC, et al. Diffuse gallbladder wall thickening: differential diagnosis. Am J Roentgenol. 2007;188:495-501.
Vilgrain V. Ultrasound of diffuse liver disease and portal hypertension. Eur Radiol. 2001;11:1563-1577.
Vilgrain V, et al. Atrophy–hypertrophy complex in patients with cavernous transformation of the portal vein: CT evaluation. Radiology. 2006;241:149-155.
von Herbay A, et al. Contrast-enhanced ultrasound with SonoVue: differentiation between benign and malignant focal liver lesions in 317 patients. J Clin Ultrasound. 2010;38(1):1-9.
Wernecke K, et al. Pathologic explanation for hypoechoic halo seen on sonograms of malignant liver tumors: an in vitro correlative study. Am J Roentgenol. 1992;159:1011-1016.
Wernecke K, et al. The distinction between benign and malignant liver tumors on sonography: value of a hypoechoic halo. Am J Roentgenol. 1992;159:1005-1009.
Wibbenmeyer LA, et al. Sonographic diagnosis of unsuspected gallbladder cancer: imaging findings in comparison with benign gallbladder conditions. Am J Roentgenol. 1995;165:1169-1174.
Wilson SR, et al. The liver. In: Rumack CM, Wilson SR, Charboneau JW, editors. Diagnostic Ultrasound, vol 1. St Louis: Mosby Elsevier; 2005:77-145.
Wilson SR, et al. An algorithm for the diagnosis of focal liver masses using microbubble contrast-enhanced pulse-inversion sonography. Am J Roentgenol. 2006;186:1401-1412.
Wilson SR, et al. Volume imaging in the abdomen with ultrasound: how we do it. Am J Roentgenol. 2009;193:79-85.
Winston CB, et al. Recurrent gallbladder carcinoma along laparoscopic cholecystectomy port tracks: CT demonstration. Radiology. 1999;212:439-444.
Young ST, et al. CT of the liver in patients with metastatic breast carcinoma treated by chemotherapy: findings simulating cirrhosis. Am J Roentgenol. 1994;163:1385-1388.
Zagzebski JA. Essentials of Ultrasound Physics. St Louis: Mosby Year–Book; 1996.