Chapter 10 Ultrasound of Muscular Dystrophies, Myopathies, and Muscle Pathology
 Video 10.1
 Video 10.2
 Video 10.3
Ultrasound is a noninvasive, painless technique used to identify skeletal muscle pathology. Its use in evaluation of neuromuscular disease was pioneered by Heckmatt and Dubowitz in the early 1980s.1–3 These early studies focused on ultrasonic features of skeletal muscle in males with Duchenne’s muscular dystrophy. Since then, ongoing work has expanded the role of diagnostic imaging with ultrasound to myopathies of various etiologies. Ultrasound offers several advantages compared with other ancillary tests in the evaluation of muscle pathology. It is painless, inexpensive, and allows the examiner to screen large areas of muscle quickly. This can be of great assistance when considering biopsy or can direct a limited electromyographic examination to key muscle groups. Because it can be performed at the bedside, ultrasound examination of skeletal muscle provides a practical and effective supplement to the physical examination. This chapter describes the techniques of qualitative and quantitative ultrasound in the assessment and diagnosis of skeletal muscle pathologies.
The Normal Examination
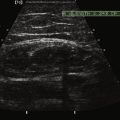
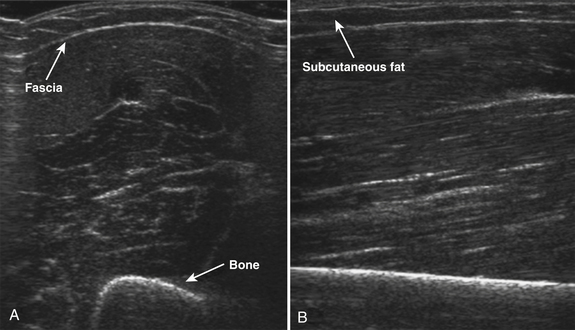
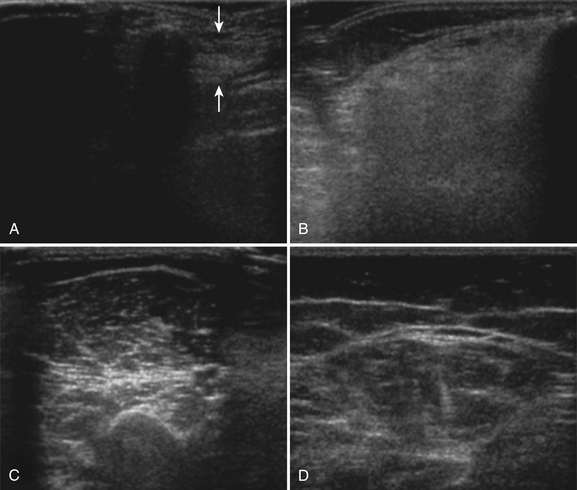
Normal muscle has low echogenicity (dark signal) interspersed with well-defined brighter punctate or curvilinear fibroadipose septa and tendinous fibrils (Fig. 10.1). Individual muscles are generally well defined by their surrounding bright fascia, which is thicker than the fibrous tissue in the muscle belly. At higher magnification there are multiple low-signal, dark areas separated by thin, medium-intensity, almost honeycombed structures. These structures have the appearance of individual muscle fibers; however, ultrasound has insufficient resolution to visualize individual muscle fibers. Rather, these echo-dark areas are likely bundles of muscle fibers with surrounding, brighter fibroadipose tissue. Bone is highly echogenic (bright signal) with a deep shadow beneath the bright, well-defined, crisp edge. Subcutaneous fat is typically of similar echogenicity to muscle and is interspersed with brighter, poorly organized ribbons of connective tissue. Near the myotendinous junction, the myofascial fibrils coalesce, resulting in increased echogenicity and higher anisotropy. It is best to consider these areas too variable for routine diagnostic screening and to focus on the bulk of the muscle belly.
The normal appearance of skeletal muscle varies with age, muscle group, and degree of fitness. In infants, muscle is particularly hypoechoic, with few myofascial planes in the muscle parenchyma. By 2 to 3 years of age, more myofascial planes develop, and they are generally homogeneously noted throughout the muscle parenchyma by 5 years of age.4 Muscle echogenicity increases more gradually, if at all, in early childhood and adulthood. No differences in echogenicity with gender are noted until the second decade, at which point men have slightly darker-appearing muscles than women.5 In later life, at about 60 years of age, muscle echogenicity increases more rapidly with advancing age.5,6 These changes vary with muscle group and are most pronounced in the biceps brachii and quadriceps muscles, particularly in men.5
Muscle bulk, which can be measured using calipers, cross-sectional area, or using three-dimensional (3D) volumetric reconstructions, also changes in complex ways throughout the life span with variations dependent on age, gender, and muscle group.7–9 Muscle thickness increases greatly in the first 20 years of life, with greater muscle thickness in men seen beginning in the early teenage years.10 Muscle thickness remains relatively stable in both genders for the next 20 years, with men having larger muscle thickness in the biceps, forearm flexors, and quadriceps. In older adults, muscle thickness in some muscles declines considerably. Between ages 40 and 90, muscle thickness decreases in the quadriceps by 30% in women and 50% in men; similar but less severe declines (20% to 30%) are seen in the biceps brachii. In contrast, in the sternocleidomastoid, tibialis anterior, and, in women, the forearm flexors, muscle thickness in adults remains more stable throughout the life span.
In addition to measuring muscle thickness, muscle atrophy can be assessed qualitatively by comparison of the thickness of muscle with subcutaneous fat, which is typically approximately 2:1 (Fig. 10.2).11,12 This method is helpful as a quick screening tool. However, the muscle-to-subcutaneous-fat ratio can be misleading in obese patients and in infants because the thickness of the subcutaneous fat changes rapidly through the first year of life.9,13 Thus, both quantitative and qualitative assessment of muscle thickness must be interpreted using norms adjusted for patient characteristics, especially age and body habitus.
Quantitative Ultrasound of Skeletal Muscle
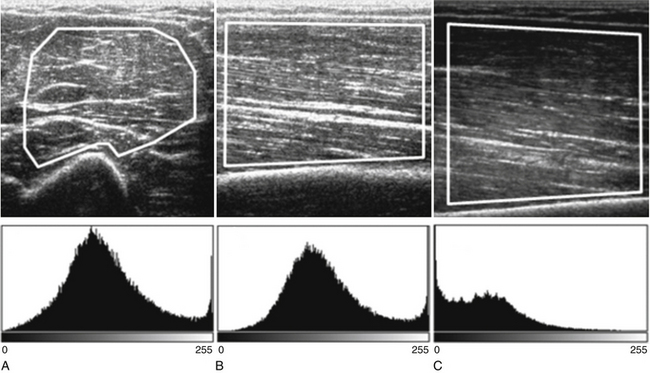
Both qualitative and quantitative assessments of skeletal muscle ultrasound can be used to identify skeletal muscle pathologies.14–16 One study of qualitative ultrasound assessment in children showed sensitivities and specificities for neuromuscular pathology as high as 81% and 96%, respectively.16 A limitation of qualitative ultrasound analysis is that the accuracy of assessment depends on the experience of the examiner. Quantitative assessment of skeletal muscle using ultrasound is simple to perform, does not rely on subjective interpretation, and can be reproduced reliably between examiners.17,18 One technique, described by Pillen and colleagues, is to analyze gray scale pixel values, among other measurements, of the ultrasound signal.19 The ultrasound image is imported into an image analysis software program, and a region of interest is drawn within the imaged muscle. Many properties of the image can be measured, including the mean pixel value on the gray scale from black (0) to white (255). Using this technique, Pillen and colleagues have devised protocols for discriminating between children with and without neuromuscular disease, with positive and negative predictive values of 91% and 86%, respectively.14 This technique does not rely on the expertise of the examiner and allows for greater differentiation of mildly abnormal echo patterns than qualitative assessment.20
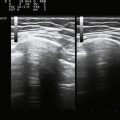
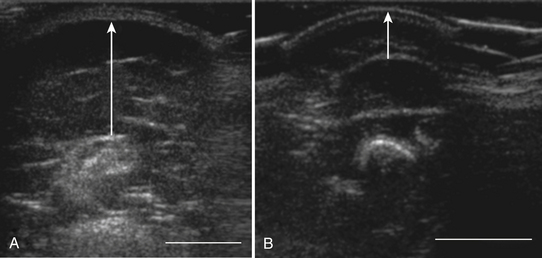
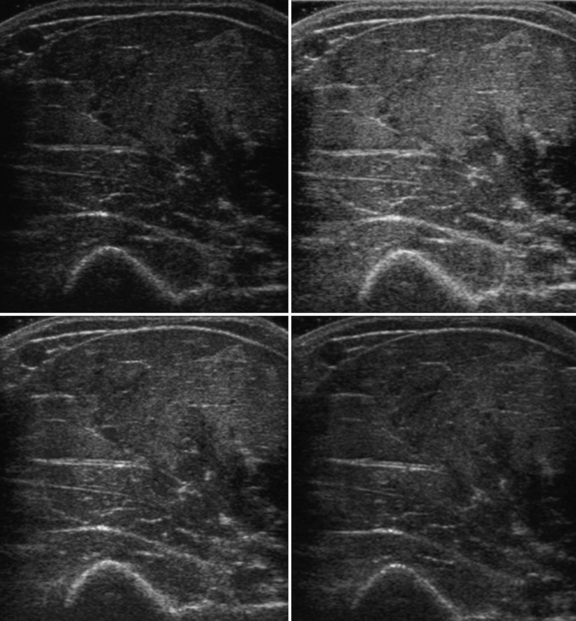
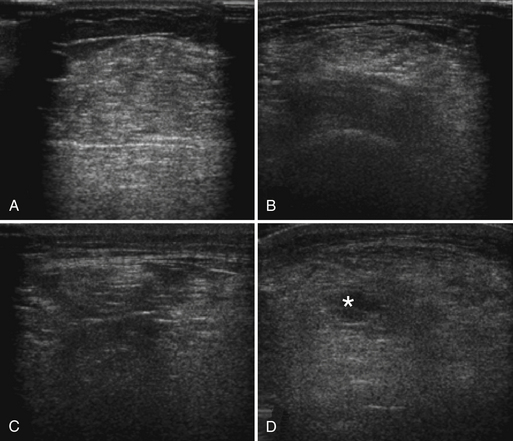
Several factors are essential to minimizing additional variation because of machine-dependent factors. Machine settings must be held constant with each image, because the gray scale pixel value will vary with changes in gain, probe frequency, and compression settings (Fig. 10.3). In addition, it is important to configure the ultrasound system to provide an approximately linear relationship between the received backscatter values and the displayed gray scale values.21 Otherwise, a change in the displayed gray scale value may not consistently reflect an equivalent degree of change in the received backscatter. This can be done by selecting the most linear compression curve when choosing the display settings. Very black or very white images may not fall within the linear portion of the compression curve. If possible, the limits of the linear range relating gray scale values to received backscatter should be identified and the gain should be adjusted so that images fall within this range. In practice, because muscle is generally very dark, the author has found that when quantifying images, a high gain setting is often needed to produce an image of the muscle with an average gray scale value that is not dominated by black (0) gray scale pixel values (Fig. 10.4).
With advances in ultrasound image processing techniques, including the use of differential gain amplification that is often hidden from the user, standardizing the ultrasound system and identifying a linear compression curve to quantify gray scale signal is more challenging. Additional techniques, such as backscatter analysis, require more advanced processing, but are promising for identification and quantification of pathology. Backscatter analysis of skeletal muscle is a quantitative assessment related to gray scale analysis that estimates the intensity of the received backscatter signal from the displayed gray scale pixel value.21 Backscatter analysis measures the estimated received signal amplitude in decibels. Ultrasound systems can be configured to estimate the backscatter value from the displayed gray scale21 or in some ultrasound systems can be measured using proprietary software. This approach has been used in the analysis of cardiac muscle and is reproducible between machines if specific imaging system configurations and a common reference are known.22–24
In addition to gray scale and backscatter levels, other ultrasonic properties of skeletal muscle can be measured. Analysis of entropy and fractal dimension measures the shape and pattern of the ultrasound waveform and can detect differences between healthy and myopathic skeletal muscle.25,26 Entropy measurements also distinguished between prednisolone-treated and untreated groups of muscular dystrophy mice.27 Measurement of pennation angle and muscle fiber length quantify details in the structural architecture of the muscle and are related to muscle strength and function.28,29 These techniques may provide further insights into the associated structural changes of muscle pathologies.
Technical Considerations in Skeletal Muscle Ultrasound
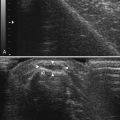
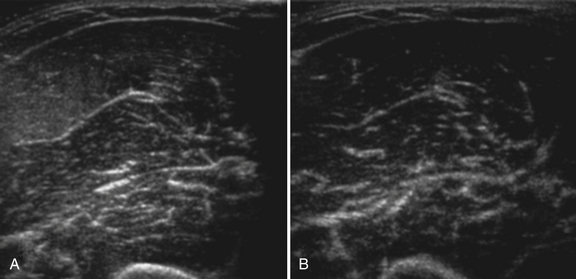
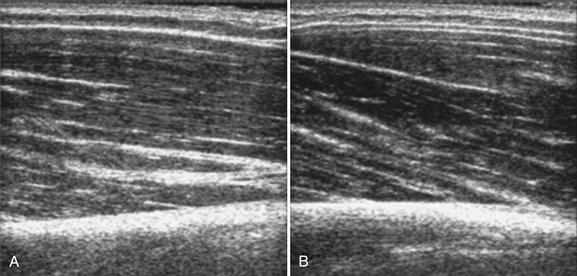
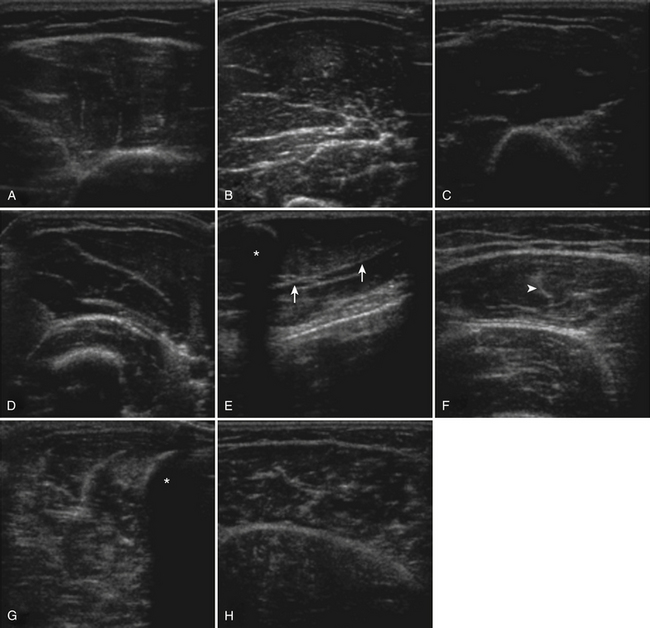
The probe orientation and muscle position can also drastically alter the image appearance. The ultrasonographic brightness of the muscle is critically dependent on anisotropy, or the relationship between the angle of the probe and the underlying pennation angle of the myofascial bands (Fig. 10.5). Thus, in a bipennate muscle such as the tibialis anterior, the superficial and deep portions of the muscle will alternately appear bright or dark as the probe angle is adjusted. Optimal positioning for transverse images of the muscle is to maintain a probe angle that is perpendicular to the bone. This yields an image of the bone with a crisp and bright reflection. The effect of anisotropy on different layers can also be minimized by imaging the muscle in the longitudinal plan, with the probe in line with the muscle fiber orientation. Imaging muscles in both transverse and longitudinal planes is thus recommended. Muscle position (flexed or extended) affects pennation angle and therefore also affects muscle appearance on ultrasound. Flexed muscle is slightly darker than extended muscle (Fig. 10.6).21 When evaluating the ultrasound appearance of muscle, it is important to account for these geometric considerations.
Protocol for Skeletal Muscle Evaluation of Neuromuscular Disease
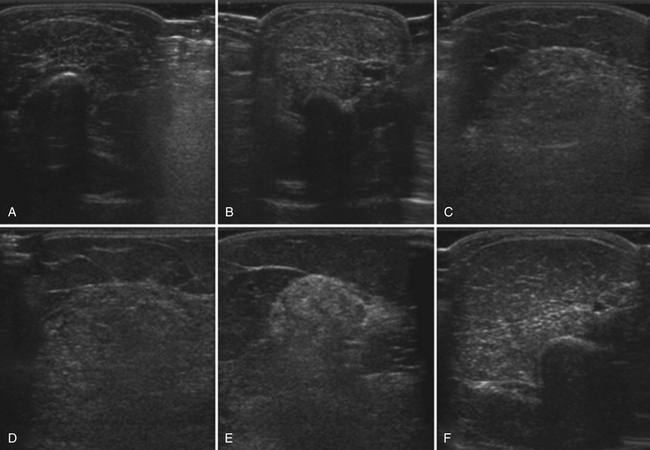
The approach to the ultrasound evaluation of the patient with a suspected neuromuscular disease should focus on the static and dynamic appearance of the muscle parenchyma, fascia, and blood flow. The pattern of muscle involvement, with comparison of muscles side to side, distal to proximal, and with surrounding tissue, should also be examined. The protocol the author uses includes muscles that are typically hypoechoic and relatively easy to visualize. This helps improve the identification of subtle increases in echogenicity. The author typically images the deltoid, elbow flexors (biceps brachii and brachialis), triceps brachii, extensor carpi radialis and brachioradialis, flexor digitorum superficialis and profundus, first dorsal interosseous, rectus femoris, tibialis anterior, and the medial and lateral gastrocnemius (Fig. 10.7). Several details of each muscle warrant mention. The normal deltoid can appear very echogenic, especially in older women, and its appearance varies greatly with positioning of the probe along its length. Similarly, the vastus intermedius is often brighter compared with the lateralis, medialis, and rectus femoris. For this reason the author avoids attributing moderately bright echoes in the deltoid and vastus intermedius, when seen in isolation, to pathology. The brachialis is often brighter than the biceps brachii, which in turn is slightly brighter than the triceps brachii. The extensor carpi radialis and the brachioradialis are closely approximated and can appear only partially divided by an incomplete fascia. The first dorsal interosseous is typically brighter in the deeper portion of the muscle. The rectus femoris in the proximal one half of the muscle is bisected in the superficial aspect by a single fascial plane (the central fascia), which should be well delineated in normal muscle. In some normal individuals the lateral gastrocnemius can be slightly more echogenic than the medial gastrocnemius. Finally, the tibialis anterior, like the gastrocnemius, is relatively fibrous and therefore somewhat echogenic. The tibialis anterior typically is rounded as it attaches along the tibia. Subtle atrophy can appear as a flattening of this area.
Imaging modalities should include transverse and longitudinal orientations, M-mode for evaluation of muscle movements, and power Doppler imaging to assess blood flow. To minimize the effect of anisotropy, this author commonly evaluates at least the biceps brachii and rectus femoris in the transverse and longitudinal planes and if muscle movements are seen, includes M-mode evaluation to better characterize the size and frequency of the movements.
Muscle Pathology Seen with Ultrasound in Neuromuscular Disease
Ultrasound of skeletal muscle can detect pathology, characterize the pattern of muscle involvement, and assist in the selection of biopsy sites. Muscle pathology generally appears as increased echogenicity in the muscle parenchyma.2,11 Normal muscle has low echogenicity interspersed with brighter, more echogenic, connective tissues. In neuromuscular diseases the muscle is brighter (more echogenic). When assessing for subtle pathology in muscle, focus on the appearance of the muscle parenchyma between the connective tissue—in normal muscle this should still appear dark. Attenuation also increases with pathology, resulting in a decreased bony reflection and poorer visualization of deep tissues.3,30 The degree of muscle abnormality on ultrasound can be graded qualitatively using Heckmatt’s criteria (Table 10.1).3 As muscle signal increases, the underlying bone echo becomes less crisp and bright and, in more prominent pathologies, cannot be seen at all. The increase in muscle echogenicity is likely because of increases in the fat18,30,31 and fibrous32 content of the muscle. Thus, ultrasound is particularly sensitive for identifying pathology characterized by increases in fat and fibrosis, such as in the dystrophinopathies.11,16,19 Decreased echogenicity is uncommonly seen and likely represents edema or increased blood flow in the muscle.
Table 10.1 Heckmatt’s Visual Rating Scale of Skeletal Muscle Ultrasound
| Grade | Description |
|---|---|
| I | Normal |
| II | Increased muscle signal with preserved, distinct bone echo |
| III | Marked increase in muscle signal with reduced bone echo |
| IV | Very increased muscle signal and complete loss of bone echo |
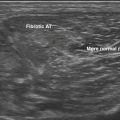
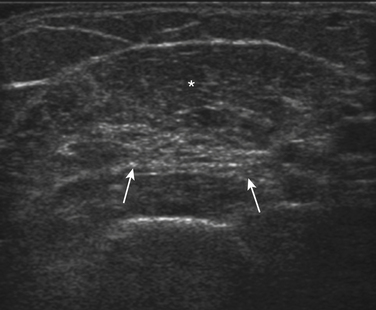
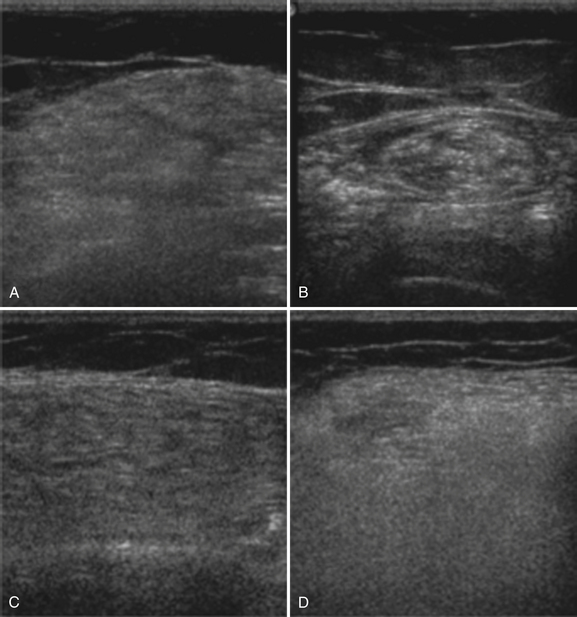
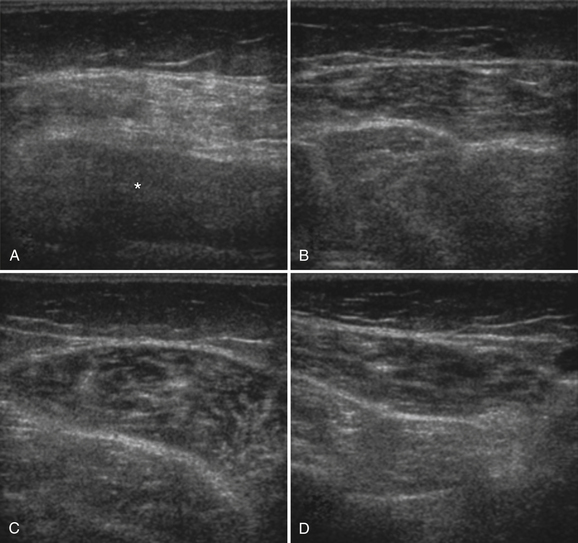
Myogenic pathology has features on ultrasound that distinguish it from neuropathy. Myopathic muscle parenchyma has grainy-appearing increased echoes. The muscle appears as if it has been smudged with a pencil eraser, rather than the normal dark muscle fibers interspersed with crisp, bright echoes from the fibroadipose tissue. The echoes in myopathies are most often homogeneously increased throughout the muscle (Fig. 10.8).11,12,15 In contrast, neuropathic changes appear as heterogeneous involvement within the muscle, with areas of affected and spared regions (Fig. 10.9).12,15,33 Neuropathic changes in muscle result in increased echoes in a streaky, linear pattern against a more normal, dark background. Rather than appearing smudged, as in myopathy, the increased echoes in neuropathic muscle look like streaks on a glass window.
Despite these characteristics, in this author’s experience distinguishing myopathic from neuropathic changes based only on the pattern of echoes within the muscle is challenging, especially in very mild or severe pathologies. The pattern of proximal and distal muscle involvement can assist in differentiating myopathic and neuropathic conditions. Coincident with the typical patterns of weakness, abnormalities on ultrasound in myopathy are often symmetric and most severe in the proximal muscles (Fig. 10.10), whereas in neuropathy, the distal muscles show greater echogenicity and decreased thickness.14,33 Exceptions to these patterns can be seen in patients with distal myopathy (Fig. 10.11) or neuropathies that are not length dependent (Fig. 10.12). Neuropathic muscle is often more atrophic, whereas muscle bulk is generally preserved in myopathic disorders.34,35 Muscle size alone, however, does not distinguish between patients with and without neuromuscular disorders.14 Muscle atrophy in isolation, without other abnormal ultrasound findings, is therefore not specific for neuromuscular pathology.
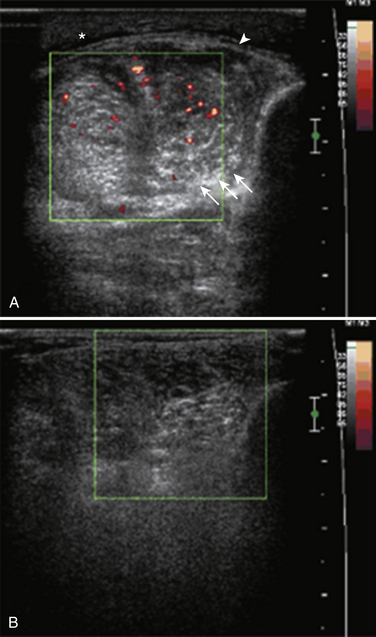
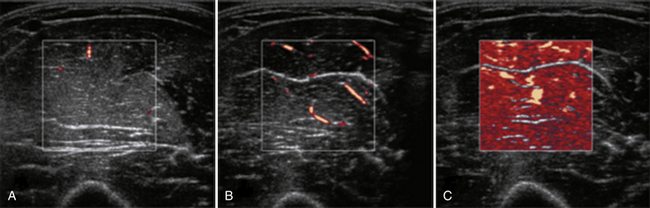
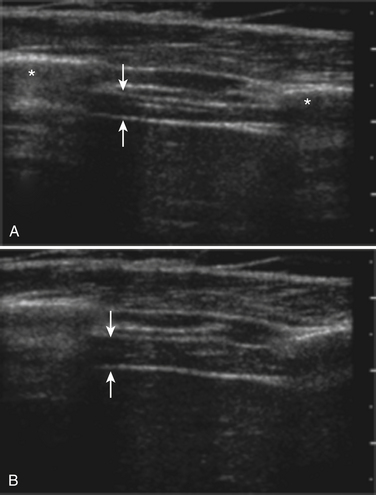
In addition to evaluating the muscle parenchyma, a complete muscle ultrasound examination should also assess for abnormalities in the fascia and blood flow. Thickening and increased blood flow in the fascia have been reported in fasciitis,36 and preferential involvement of the muscle near the fascia is associated with collagen VI disorders.37 Blood flow in suspected myopathies is best assessed using power Doppler imaging and can be increased in myositis (Fig. 10.13).18,33,38 Power Doppler is a sensitive technique for evaluating slow blood flow as well as movement. Caution is warranted when interpreting the power Doppler image, because changes can occur following muscle activity or incorrectly calibrated Doppler sensitivities (Fig. 10.14). Blood flow on power Doppler in muscle increases rapidly and dramatically following even minimal exercise; therefore, the muscle must be examined when relaxed and well rested. If the Doppler sensitivity is too high, the entire image will be “washed out” with signal that fills the image rather than revealing defined areas of increased blood flow. Contrast-enhanced ultrasound can also be used to visualize and quantify blood flow in muscles. Measurement of blood flow using contrast-enhanced ultrasound detects changes in microcirculation of skeletal muscle in response to exercise and vasculopathies39–41 and shows increased perfusion in patients with dermatomyositis and polymyositis.42,43
Dynamic Imaging in the Evaluation of Muscle Pathology
Observation of voluntary and involuntary muscle movements both at rest and with active contraction using ultrasound can provide additional information when evaluating for pathology. Ultrasound is particularly useful in the identification of fasciculations. Ultrasound detects fasciculations with higher sensitivity than electromyography (EMG) or the clinical examination.44–46 Fasciculations are detectable as rapid (0.2 to 0.5 second) contractions of focal areas of muscle that deform the surrounding areas. Fasciculations can repeat in one area of muscle, but more commonly occur at random intervals and areas (Video 10.1). In healthy patients, occasional fasciculations (≥1 per 10-second observation) are detectable on ultrasound in as many as 8% to 43% of healthy subjects and are more common in older patients.44,47 However, fasciculations in muscles above the knee are actually relatively uncommon, occurring in one study in only 3 of 58 healthy subjects.47 Fasciculations are more frequent and widespread in patients with neuromuscular disorders.44,48 Fasciculations were seen in 85 of 92 (92%) subjects with spinal muscular atrophy (SMA), Charcot-Marie-Tooth (CMT), or motor lumbar radiculopathies46 and in 24 of 25 (96%) subjects with early amyotrophic lateral sclerosis (ALS).48 Most patients with ALS in this study had on average of more than four fasciculations per 10 seconds. In this author’s experience, patients with hyperexcitability syndromes (neuromyotonia, cramp-fasciculation syndrome) also show more frequent and widespread fasciculations than healthy subjects. This author screens for fasciculations for 10 seconds in each imaged muscle.
In addition to fasciculations, many other large- and small-amplitude movements of skeletal muscle can be seen. Tremor appears as a rhythmic, coordinated, brief contraction of the entire muscle. The frequency and regularity of the tremor can be quantified using M-mode ultrasound.45,49 M-mode displays a single line of B-mode over time. Thus, the amplitude, duration, and frequency of the tremor and other muscle movements can be measured. Rippling muscle disease appears as a wave of contraction that spreads across the muscle, perpendicular to the direction of the muscle fibers (Video 10.2). Muscle movement with contraction can also be observed. Normal muscle contraction is smooth and graded, with equal activation of all portions of the muscle belly simultaneously. Irregular contraction patterns of large, fluctuating, irregular movements within the muscle may be seen following nerve injury. A contraction tremor can be seen during muscle activation. This is an irregular high-frequency tremor of the muscle that can be seen as well as felt during the ultrasound examination. Contraction tremor is most common when the muscle is held slightly flexed or during slow extension of a fatigued muscle. Cramps appear similar to a normal contraction, except they can involve an isolated portion of the muscle. The frequency of contraction often increases and decreases coincident with the intensity of the cramp (Video 10.3).
Two studies report the use of ultrasound for the detection of small-amplitude muscle movements.50,51 These studies showed that muscle fibrillations can be detected using ultrasound. Fibrillations appear as small-amplitude, irregularly recurring movements within the muscle without other movement of the muscle or surrounding tissues.51 Detection of fibrillations requires a high frame rate, which can be easily achieved by using the zoom function. Several pitfalls can mimic the small-amplitude movements seen from fibrillations. Movement of tissue as a result of nearby arterial blood flow is small amplitude, rhythmic, and coincides with the pulse rate. Artifact can also appear as small-amplitude movement. This is usually encountered along the lateral edge of the image or at a tissue to bone interface, thus the appearance of small-amplitude movement in these areas should not be interpreted as fibrillation.
Quantification of changes in muscle with movement can detect underlying pathologies. In a study of nine patients with myositis, the rectus femoris thickened less with contraction and generated less strength than in age-matched controls.52 Healthy muscle is less echogenic (darker) in the flexed than the extended arm. In myopathic muscle there is less variation between flexed and extended muscle.21 Myopathic changes thus affect the orientation and/or morphometry of muscle fibers with contraction, and these changes can be quantified using ultrasound.
Changes in the position and appearance of the diaphragm can also be observed and measured during respiration using ultrasound. The diaphragm can be identified using either transverse or longitudinal probe orientations between the eighth and tenth ribs in the mid- to anterior axillary line. The diaphragm is deep to the intercostal muscles between the two bright parallel lines of the pleura and peritoneal membranes (Fig. 10.15). During inspiration the diaphragm can be seen to slide caudally, whereas the overlying intercostal muscles do not. This technique has practical ramifications for assisting in performing ultrasound-guided needle EMG.53 Pathology of the diaphragm can also be detected and quantified using ultrasound. Diaphragmatic excursion can be measured using M-mode ultrasonography. Both the excursion and the amount of thickening of the diaphragm during respiration alter with pathology. In normal subjects, the diaphragm thickens with inspiration and this value correlates with the maximal inspiratory pressure.54 In ten boys with Duchenne’s muscular dystrophy, the diaphragm thickness was greater at rest and did not increase as much with inspiration as in healthy controls.55 In seven boys with Duchenne’s muscular dystrophy, both the tidal volume and diaphragmatic excursion increased with the use of an assistive ventilation device.56 Neurogenic impairment of the diaphragm can also be detected by ultrasound. Three patients with ALS and respiratory weakness showed reductions in both diaphragmatic excursion and thickening with inspiration compared with healthy controls.57 These studies suggest a promising role for ultrasonic assessment of both myogenic and neurogenic pathology of the diaphragm.
Neuromuscular Ultrasound as a Diagnostic Tool
The sensitivity and specificity of diagnostic ultrasound in neuromuscular disorders depend on the type and severity of the disorder. In adults with myopathy, increased ultrasound gray scale intensity15 or backscatter21 of the biceps brachii was 82% to 94% sensitive and 76% to 93% specific for distinguishing patients from controls. Ultrasound has been more extensively studied in the evaluation of children with suspected neuromuscular disease (reviewed by Pillen and colleagues).33 In the evaluation of infants, ultrasound has similar sensitivities and specificities for identifying and characterizing neuromuscular pathologies to EMG. In a study of 41 hypotonic infants ages 2 to 24 months, qualitative ultrasound and EMG showed highly concordant findings in discriminating infants with neurogenic, myogenic, and central hypotonia.12 Ultrasound and EMG were concordant in 16 of 16 infants with neurogenic hypotonia and 6 of 6 infants with myogenic hypotonia. Both ultrasound and EMG were normal in 17 infants with central hypotonia. The ultrasound and EMG results conflicted in only two infants. In these infants the muscle and nerve biopsy did not reveal a diagnosis.
Qualitative ultrasound is a sensitive and specific test for neuromuscular disease, especially in older children. In a study by Zuberi and colleagues of 100 children with suspected neuromuscular disease, the qualitative assessment of ultrasound using Heckmatt’s rating scale was 78% sensitive and 91% specific for identifying any neuromuscular disease.58 Ultrasound was more accurate in identifying neuromuscular disorders in children older than 3 years of age, and was least accurate in children younger than 1 year of age. All of the children with moderate or severely abnormal ultrasounds (Heckmatt grade III or IV) had a neuromuscular disorder, whereas 62 of 69 children with a normal ultrasound (Heckmatt grade I) did not. Only 7 of 13 children with a mildly abnormal scan (Heckmatt grade II) had a neuromuscular disorder. Thus, in this study, a mildly abnormal ultrasound was neither sensitive nor specific for a neuromuscular disorder. A study by Brockmann and associates of 134 patients with suspected neuromuscular disorders showed similar sensitivities (81%) and specificities (96%) for qualitative ultrasound assessment in the identification of any neuromuscular disorder.16 As in the study by Zuberi and colleagues, ultrasound was less sensitive (71%) in identifying abnormalities in children with neuromuscular disorders younger than 3 years of age.
Quantitative ultrasound results in similar sensitivities for detecting neuromuscular disorders. A prospective study of quantitative gray scale ultrasound analysis of 150 children referred for evaluation for neuromuscular disorders was 71% sensitive and 91% specific for identifying neuromuscular disorders.14 Again, the sensitivity of ultrasound in children younger than 3 years of age was lower than in older children; however, specificity was 100%, with no false positives in the younger age group.
Both quantitative and qualitative ultrasonic assessments have higher specificity than sensitivity in differentiating myopathic and neuropathic changes.14–16 Thus, findings that distinguish the two pathologies are helpful when present but are less useful as a screening tool. Of the 134 children studied by Brockmann and associates, ultrasound was more specific than sensitive for detecting myogenic (92% vs. 67%) and neurogenic (98% vs. 77%) changes. Neuropathic changes on ultrasound are more likely to affect the distal muscles of the legs. A quantitative ultrasound study comparing 77 children, including 31 with myopathic and 27 with neuropathic disorders, found that brighter echoes and more atrophy in the legs than arms is 67% sensitive and 94% specific for identifying neurogenic disease. Similar analysis did not distinguish myopathic disease from nonneuromuscular conditions.14 In adults, quantitative image analysis of muscle heterogeneity, echogenicity, and white-area index (a measurement of neighboring areas of bright pixels) can distinguish neuropathic from myopathic changes.15 In a study comparing 145 healthy controls, 17 myopathic, and 15 neuropathic patients, brighter signal in the biceps brachii (increased gray scale values) was 94% sensitive and 93% specific for myopathy, whereas increased signal heterogeneity was 100% sensitive and 93% specific for neuropathy.15 This same quantitative approach did not distinguish between myopathic and neuropathic disease in children.17
The relationship between the degree of image abnormality, strength, and function may vary with differences in the underlying pathologies. Several reports of magnetic resonance imaging (MRI) and ultrasound abnormalities in patients with muscular dystrophies have demonstrated evidence of subclinical abnormalities and suggest that imaging can be used to evaluate disease severity and progression.30,59–63 In contrast, the severity of findings in children with congenital muscular dystrophies3 or mitochondrial myopathies64 may not correlate with function or disease severity. Further studies of the neuromuscular pathologies are needed comparing the degree of image abnormality with patient strength, function, and prognosis.
Ultrasound Abnormalities in Inherited Myopathies
Hereditary myopathic disorders are a diverse group of pathologies that have dominant, recessive, X-linked inheritance, or mitochondrial inheritance patterns. These myopathies generally manifest with progressive, symmetric weakness more than atrophy of the proximal arms and legs. Weakness can be apparent at birth, as in the congenital myopathies, or may not appear until adulthood. Sensory abnormalities are absent. Tendon reflexes will be absent in the areas of most pronounced weakness. Laboratory evaluation includes a serum creatine kinase, which may or may not be elevated, and often an EMG, which shows small, narrow motor unit potentials with early recruitment patterns. In the absence of a family member with a known diagnosis, either a muscle biopsy or, increasingly, genetic testing is required to specify a diagnosis.
Ultrasound of Muscular Dystrophies
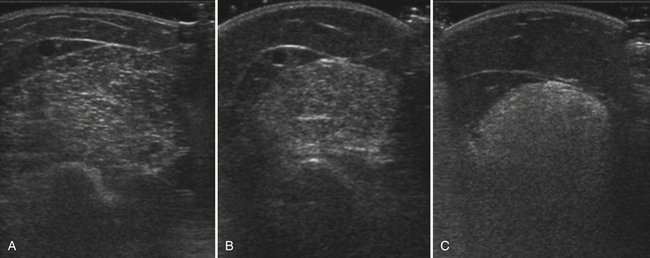
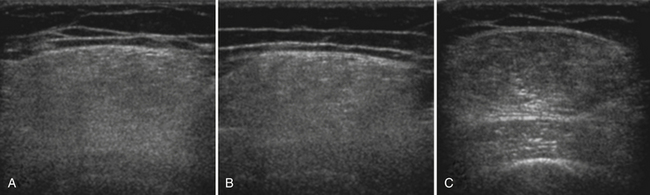
Abnormal ultrasonography in neuromuscular disease was first described in males with Duchenne’s muscular dystrophy,2 an X-linked muscular dystrophy caused by mutations of the dystrophin gene. Becker’s muscular dystrophy, a less severe form of the disease, and symptomatic female carriers of Duchenne’s muscular dystrophy are often grouped together with Duchenne’s muscular dystrophy to comprise the “dystrophinopathies.” Much of the ongoing work in ultrasound of myopathies continues to be performed in these disorders. Patients with muscular dystrophy show a diffuse and often marked increase in muscle echogenicity (Fig. 10.16). The muscle shows a grainy, ground-glass–like appearance often with preserved muscle bulk. With more severe pathology, the muscle echoes are very bright and the attenuation greatly increased. The increased attenuation results in a relatively darker appearance in the deep portion of the muscle and reduced or absent bone echoes.
Ultrasound is sensitive to pathology associated with dystrophinopathies and its sensitivity appears to increase with age. In Duchenne’s muscular dystrophy, ultrasound is frequently abnormal in children by the time they are toddlers, but may be normal at younger ages. Qualitative ultrasound was abnormal in 21 of 22 boys with Duchenne’s muscular dystrophy 3 to 7 years of age, but in none of the 7 boys ages 2 to 30 months.11 In another study, quantitative ultrasound was abnormal in 32 of 38 boys 1 to 11 years of age.30 The six normal ultrasounds were all performed in children younger than 6 years of age. Similarly, gray scale levels were abnormally high in 10 of 11 boys with Duchenne’s muscular dystrophy 3 to 9 years of age but in only 1 of 2 boys ages 3 weeks to 7 months.14
In Duchenne’s and Becker’s muscular dystrophies, ultrasound measurement of muscle pathology is a sensitive technique for determining the severity of muscle pathology. Ultrasound abnormalities are more severe in the quadriceps than the biceps brachii,11 coincident with the more severe involvement of the lower extremities early in Duchenne’s muscular dystrophy.65 Ultrasound backscatter is higher and increases twice as much with age in patients with Duchenne’s than Becker’s muscular dystrophy (Fig. 10.17). Echogenicity in Duchenne’s muscular dystrophy increases with worsening strength and function and in Becker’s muscular dystrophy can be abnormal even when strength and function are normal (Fig. 10.18).66 Further studies are needed to determine the sensitivity of ultrasound to detect the effects of treatment in the dystrophinopathies.
Calf enlargement is often seen in dystrophinopathies and other neuromuscular disorders. A thorough assessment of 350 patients using quantitative ultrasound by Reimers and colleagues67 revealed that calf enlargement is a common and nonspecific finding in neuromuscular disorders. Calf enlargement can be associated with either normal or increased echogenicity. Interestingly, when there is severe fatty infiltration, the calf muscle actually appears dark, similar to subcutaneous fat. Because muscle pathology from increased intramuscular fat typically appears bright, ultrasound of severe pathology in the calf may be misleading.
Ultrasound of Mitochondrial Myopathies
Mitochondrial myopathies are a heterogeneous group of neuromuscular disorders caused by abnormal function of the mitochondria. Multiple organ systems can be affected. Symptoms related to dysfunction of skeletal muscle include weakness and exercise intolerance. Ultrasound of skeletal muscle can detect abnormalities in mitochondrial myopathies but is less sensitive than in other myopathies. In 14 children with mitochondrial myopathies, visual ultrasound assessment was concordant with histologic findings in only 8 patients, including 1 myogenic, 2 neurogenic, 4 nonspecific, and 1 normal pattern on both ultrasound and histology.16 Pillen and associates studied 53 children with suspected mitochondrial disorders prospectively and compared their quantified echogenicity (gray scale analysis) with age-adjusted control values.64 Only 7 of 28 children with definite or probable mitochondrial disorders had abnormal echogenicity. Six of these children were older than 5 years of age. An additional 6 children had borderline ultrasound abnormalities. Echogenicity in the 28 subjects with mitochondrial disorders correlated with age, but not with strength or the percentage of intramuscular fat or connective tissue. Ultrasound is thus not particularly helpful in screening for mitochondrial disorders but does detect pathology that is independent, and complementary, to functional and histologic results.
Ultrasound of Nondystrophic Myotonias
The nondystrophic myotonias are a group of rare, hereditary muscle disorders associated with either sodium or chloride channelopathies. They are characterized by delayed relaxation of muscle following activity and a relative lack of dystrophic histopathologic abnormalities. Trip and coworkers report an ultrasound case series of 34 patients with chloride and 29 with sodium channelopathies.68 They found abnormally increased echogenicity, especially in the finger flexors of men and the tibialis anterior with relative sparing of the rectus femoris. In 15% of these patients there was a pattern of preferential involvement of the flexor digitorum profundus and flexor carpi ulnaris with relative sparing of the flexor digitorum superficialis and flexor carpi radialis. Additionally, increased echogenicity was associated with decreased range of motion in the arm and leg, and with decreased finger flexor force. Patients had slightly larger muscles than controls in the forearm and biceps, but not in the leg. Echogenicity increased and muscle thickness decreased with increasing age. These findings suggest that structural changes in the muscles of patients with nondystrophic myotonia can be detected using ultrasound. This study also emphasizes the selective involvement of muscles in some myopathic disorders and the potential role for ultrasound in selecting muscles for biopsy.
Other Congenital and Hereditary Myopathies
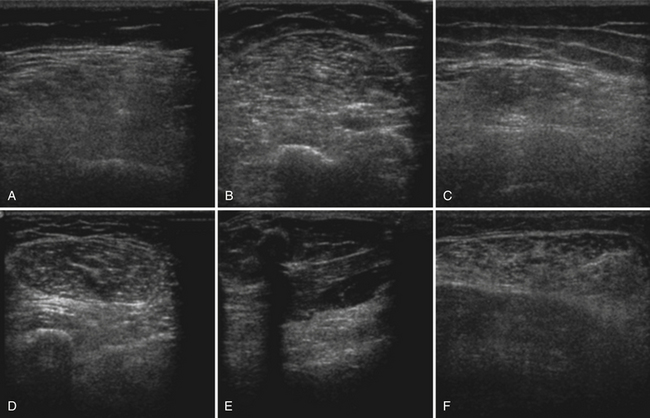
The congenital and hereditary myopathies are a large group of heterogeneous disorders with varied phenotypes. Radiologic studies of specific congenital or hereditary myopathies are often limited to small case series (Table 10.2). Both ultrasound and MRI are often abnormal in patients with congenital and hereditary myopathies, although relatively few patients have been reported (reviewed by Pillen and colleagues and Mercuri and associates).33,69 The patterns and degree of muscle involvement, as with many neuromuscular phenotypes, vary within a genotype and with disease severity. This variation, along with the small numbers of reported cases, makes it difficult to determine the specificity of a pattern of muscle involvement. Nonetheless, as with the physical examination, certain patterns of muscle involvement can direct focused genetic testing or guide selection of a muscle for biopsy (Fig. 10.19).
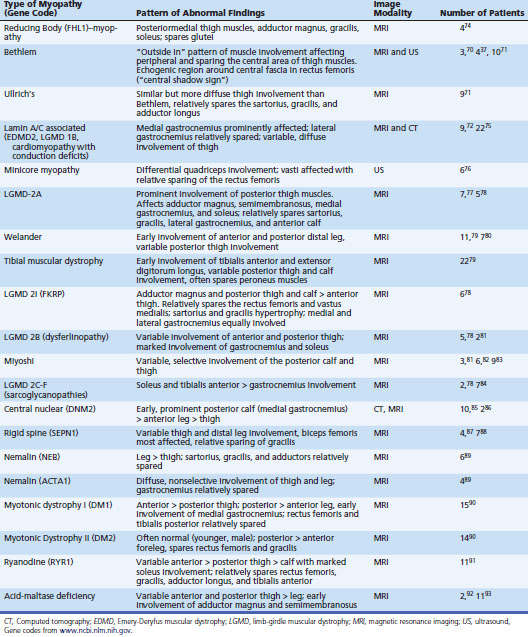
A few case reports of ultrasound in hereditary myopathy report unique, specific patterns and findings. Bethlem myopathy and the more severe Ullrich’s congenital muscular dystrophy are collagen type VI disorders characterized by proximal weakness and contractures. Imaging of these disorders shows a unique “outside-in” pattern of muscle involvement.37,70,71 The outer rim of muscle is affected in a concentric pattern with relative sparing of the central portion of the muscle belly. In patients with Bethlem myopathy, the rectus femoris exhibits a “central shadow” sign. This central shadow refers not to darkening on ultrasound, but rather increased echogenicity and thickening along the central fascia, which normally is seen as a thin, bright band that vertically divides the superficial one half of the rectus femoris from the superficial fascia to the middle of the muscle belly (see Fig. 10.7). In Ullrich’s myopathy, the findings are similar to Bethlem but more severe. In a study of nine patients,71 the concentric rim with central sparing was best seen in the vastus lateralis. The central shadow sign of the rectus femoris was also seen, but was less distinct. In both Bethlem and Ullrich’s myopathies, there is also increased signal in the connective tissues between the soleus and gastrocnemius. Again, this finding was more distinct in Bethlem myopathy. When compared with patients with autosomal dominant Emery-Dreifuss muscular dystrophy, which shares some clinical features with collagen VI disorders, Emery-Dreifuss muscular dystrophy shows more diffuse thigh and selective medial gastrocnemius involvement72 and does not show the outside-in pattern or central shadow sign.
Another unique pattern of pathology on ultrasound has been reported in six patients with hereditary inclusion body myopathy with homozygous glucosamine (UDP-N-acetyl)-2-epimerase/N-acetylmannosamine kinase mutations.73 These patients showed severe, selective involvement of the rectus femoris compared with the relatively spared vastus medialis, lateralis, and intermedius. Additionally, these patients showed areas of increased echogenicity within the central portion of the hamstring muscles, with sparing of the relatively hypoechoic rim, producing a “target-like” appearance. This study also showed severe atrophy of the hamstring muscles compared with the anterior thigh, and more severe atrophy of the anterior foreleg compared with the calf. These studies of Bethlem and hereditary inclusion body myositis highlight how the imaging of neuromuscular disorders can assist in diagnosis. Additional studies could further expand the identification of myopathies with selective, specific patterns of muscle involvement.
Conclusion
Muscle ultrasound is an effective screening tool for neuromuscular disorders and adds complementary and unique information to the physical examination. Abnormalities associated with neuromuscular disease include increased echogenicity, muscle atrophy, and abnormal muscle movements. These abnormalities can be detected with ultrasound even in the absence of clinical findings. Ultrasound can assist in selecting muscles for biopsy or in directing a limited EMG examination. Both qualitative and quantitative ultrasonography can detect neuromuscular pathology and can differentiate myopathic from neuropathic conditions. Quantitative ultrasound is easy to perform, objectively quantifies the degree of muscle pathology, and does not require extensive examiner expertise. The patterns of selective muscle involvement identified on ultrasound can help determine the diagnosis. As more studies become available, it is likely that ultrasound and other imaging modalities will further identify characteristic patterns of pathology in neuromuscular disorders.
1. Heckmatt J.Z., Dubowitz V. Detecting the Duchenne carrier by ultrasound and computerized tomography. Lancet. 1983;2:1364.
2. Heckmatt J.Z., Dubowitz V., Leeman S. Detection of pathological change in dystrophic muscle with B-scan ultrasound imaging. Lancet. 1980;1:1389-1390.
3. Heckmatt J.Z., Leeman S., Dubowitz V. Ultrasound imaging in the diagnosis of muscle disease. J Pediatr. 1982;101:656-660.
4. Fischer A.Q., Stephens S. Computerized real-time neuromuscular sonography: a new application, techniques and methods. J Child Neurol. 1988;3:69-74.
5. Scholten R.R., Pillen S., Verrips A., Zwarts M.J. Quantitative ultrasonography of skeletal muscles in children: normal values. Muscle Nerve. 2003;27:693-698.
6. Reimers C.D., Harder T., Saxe H. Age-related muscle atrophy does not affect all muscles and can partly be compensated by physical activity: an ultrasound study. J Neurol Sci. 1998;159:60-66.
7. Arts I.M., Pillen S., Overeem S., et al. Rise and fall of skeletal muscle size over the entire life span. J Am Geriatr Soc. 2007;55:1150-1152.
8. Arts I.M., Pillen S., Schelhaas H.J., et al. Normal values for quantitative muscle ultrasonography in adults. Muscle Nerve. 2010;41:32-41.
9. Heckmatt J.Z., Pier N., Dubowitz V. Measurement of quadriceps muscle thickness and subcutaneous tissue thickness in normal children by real-time ultrasound imaging. J Clin Ultrasound. 1988;16:171-176.
10. Kanehisa H., Ikegawa S., Tsunoda N., Fukunaga T. Cross-sectional areas of fat and muscle in limbs during growth and middle age. Int J Sports Med. 1994;15:420-425.
11. Heckmatt J.Z., Pier N., Dubowitz V. Real-time ultrasound imaging of muscles. Muscle Nerve. 1988;11:56-65.
12. Aydinli N., Baslo B., Caliskan M., et al. Muscle ultrasonography and electromyography correlation for evaluation of floppy infants. Brain Dev. 2003;25:22-24.
13. Schmidt R., Voit T. Ultrasound measurement of quadriceps muscle in the first year of life: normal values and application to spinal muscular atrophy. Neuropediatrics. 1993;24:36-42.
14. Pillen S., Verrips A., van Alfen N., et al. Quantitative skeletal muscle ultrasound: diagnostic value in childhood neuromuscular disease. Neuromuscul Disord. 2007;17:509-516.
15. Maurits N.M., Bollen A.E., Windhausen A., et al. Muscle ultrasound analysis: normal values and differentiation between myopathies and neuropathies. Ultrasound Med Biol. 2003;29:215-225.
16. Brockmann K., Becker P., Schreiber G., et al. Sensitivity and specificity of qualitative muscle ultrasound in assessment of suspected neuromuscular disease in childhood. Neuromuscul Disord. 2007;17:517-523.
17. Maurits N.M., Beenakker E.A., van Schaik D.E., et al. Muscle ultrasound in children: normal values and application to neuromuscular disorders. Ultrasound Med Biol. 2004;30:1017-1027.
18. Reimers C.D., Fleckenstein J.L., Witt T.N., et al. Muscular ultrasound in idiopathic inflammatory myopathies of adults. J Neurol Sci. 1993;116:82-92.
19. Pillen S., Scholten R.R., Zwarts M.J., Verrips A. Quantitative skeletal muscle ultrasonography in children with suspected neuromuscular disease. Muscle Nerve. 2003;27:699-705.
20. Pillen S., van Keimpema M., Nievelstein R.A., et al. Skeletal muscle ultrasonography: visual versus quantitative evaluation. Ultrasound Med Biol. 2006;32:1315-1321.
21. Zaidman C.M., Holland M.R., Anderson C.C., Pestronk A. Calibrated quantitative ultrasound imaging of skeletal muscle using backscatter analysis. Muscle Nerve. 2008;38:893-898.
22. Knipp B.S., Zagzebski J.A., Wilson T.A., et al. Attenuation and backscatter estimation using video signal analysis applied to B-mode images. Ultrason Imaging. 1997;19:221-233.
23. Holland M.R., Gibson A.A., Peterson L.R., et al. Measurements of the cyclic variation of myocardial backscatter from two-dimensional echocardiographic images as an approach for characterizing diabetic cardiomyopathy. J Cardiometab Syndr. 2006;1:149-152.
24. Sosnovik D.E., Baldwin S.L., Lewis S.H., et al. Transmural variation of myocardial attenuation measured with a clinical imager. Ultrasound Med Biol. 2001;27:1643-1650.
25. Hughes M.S., Marsh J.N., Wallace K.D., et al. Sensitive ultrasonic detection of dystrophic skeletal muscle in patients with Duchenne muscular dystrophy using an entropy-based signal receiver. Ultrasound Med Biol. 2007;33:1236-1243.
26. Gdynia H.J., Muller H.P., Ludolph A.C., et al. Quantitative muscle ultrasound in neuromuscular disorders using the parameters “intensity,” “entropy,” and “fractal dimension,”. Eur J Neurol. 2009;16:1151-1158.
27. Wallace K.D., Marsh J.N., Baldwin S.L., et al. Sensitive ultrasonic delineation of steroid treatment in living dystrophic mice with energy-based and entropy-based radio frequency signal processing. IEEE Trans Ultrason Ferroelectr Freq Control. 2007;54:2291-2299.
28. Moreau N.G., Teefey S.A., Damiano D.L. In vivo muscle architecture and size of the rectus femoris and vastus lateralis in children and adolescents with cerebral palsy. Dev Med Child Neurol. 2009;51:800-806.
29. Lieber R.L., Friden J. Functional and clinical significance of skeletal muscle architecture. Muscle Nerve. 2000;23:1647-1666.
30. Heckmatt J., Rodillo E., Doherty M., et al. Quantitative sonography of muscle. J Child Neurol. 1989;4(Suppl):S101-S106.
31. Reimers K., Reimers C.D., Wagner S., et al. Skeletal muscle sonography: a correlative study of echogenicity and morphology. J Ultrasound Med. 1993;12:73-77.
32. Pillen S., Tak R.O., Zwarts M.J., et al. Skeletal muscle ultrasound: correlation between fibrous tissue and echo intensity. Ultrasound Med Biol. 2009;35:443-446.
33. Pillen S., Arts I.M., Zwarts M.J. Muscle ultrasound in neuromuscular disorders. Muscle Nerve. 2008;37:679-693.
34. Bargfrede M., Schwennicke A., Tumani H., Reimers C.D. Quantitative ultrasonography in focal neuropathies as compared to clinical and EMG findings. Eur J Ultrasound. 1999;10:21-29.
35. Heckmatt J.Z., Pier N., Dubowitz V. Assessment of quadriceps femoris muscle atrophy and hypertrophy in neuromuscular disease in children. J Clin Ultrasound. 1988;16:177-181.
36. Pillen S., van Engelen B., van den Hoogen F., et al. Eosinophilic fasciitis in a child mimicking a myopathy. Neuromuscul Disord. 2006;16:144-148.
37. Bonnemann C.G., Brockmann K., Hanefeld F. Muscle ultrasound in Bethlem myopathy. Neuropediatrics. 2003;34:335-336.
38. Visser L.H. High-resolution power Doppler sonography in inflammatory myopathy. Muscle Nerve. 2009;39:553-554.
39. Duerschmied D., Maletzki P., Freund G., et al. Analysis of muscle microcirculation in advanced diabetes mellitus by contrast enhanced ultrasound. Diabetes Res Clin Pract. 2008;81:88-92.
40. Duerschmied D., Zhou Q., Rink E., et al. Simplified contrast ultrasound accurately reveals muscle perfusion deficits and reflects collateralization in PAD. Atherosclerosis. 2009;202:505-512.
41. Ross R.M., Downey K., Newman J.M., et al. Contrast-enhanced ultrasound measurement of microvascular perfusion relevant to nutrient and hormone delivery in skeletal muscle: a model study in vitro. Microvasc Res. 2008;75:323-329.
42. Weber M.A., Krix M., Jappe U., et al. Pathologic skeletal muscle perfusion in patients with myositis: detection with quantitative contrast-enhanced US—initial results. Radiology. 2006;238:640-649.
43. Weber M.A., Jappe U., Essig M., et al. Contrast-enhanced ultrasound in dermatomyositis and polymyositis. J Neurol. 2006;253:1625-1632.
44. Reimers C.D., Ziemann U., Scheel A., et al. Fasciculations: clinical, electromyographic, and ultrasonographic assessment. J Neurol. 1996;243:579-584.
45. Walker F.O., Donofrio P.D., Harpold G.J., Ferrell W.G. Sonographic imaging of muscle contraction and fasciculations: a correlation with electromyography. Muscle Nerve. 1990;13:33-39.
46. Scheel A.K., Toepfer M., Kunkel M., et al. Ultrasonographic assessment of the prevalence of fasciculations in lesions of the peripheral nervous system. J Neuroimaging. 1997;7:23-27.
47. Fermont J., Arts I.M., Overeem S., et al. Prevalence and distribution of fasciculations in healthy adults: effect of age, caffeine consumption and exercise. Amyotroph Lateral Scler. 2010;11:181-186.
48. Arts I.M., van Rooij F.G., Overeem S., et al. Quantitative muscle ultrasonography in amyotrophic lateral sclerosis. Ultrasound Med Biol. 2008;34:354-361.
49. Walker F.O., Cartwright M.S., Wiesler E.R., Caress J. Ultrasound of nerve and muscle. Clin Neurophysiol. 2004;115:495-507.
50. van Baalen A., Stephani U. Fibration, fibrillation, and fasciculation: say what you see. Clin Neurophysiol. 2007;118:1418-1420.
51. Pillen S., Nienhuis M., van Dijk J.P., et al. Muscles alive: ultrasound detects fibrillations. Clin Neurophysiol. 2009;120:932-936.
52. Chi-Fishman G., Hicks J.E., Cintas H.M., et al. Ultrasound imaging distinguishes between normal and weak muscle. Arch Phys Med Rehabil. 2004;85:980-986.
53. Boon A.J., Alsharif K.I., Harper C.M., Smith J. Ultrasound-guided needle EMG of the diaphragm: technique description and case report. Muscle Nerve. 2008;38:1623-1626.
54. Ueki J., De Bruin P.F., Pride N.B. In vivo assessment of diaphragm contraction by ultrasound in normal subjects. Thorax. 1995;50:1157-1161.
55. De Bruin P.F., Ueki J., Bush A., et al. Diaphragm thickness and inspiratory strength in patients with Duchenne muscular dystrophy. Thorax. 1997;52:472-475.
56. Ayoub J., Milane J., Targhetta R., et al. Diaphragm kinetics during pneumatic belt respiratory assistance: a sonographic study in Duchenne muscular dystrophy. Neuromuscul Disord. 2002;12:569-575.
57. Yoshioka Y., Ohwada A., Sekiya M., et al. Ultrasonographic evaluation of the diaphragm in patients with amyotrophic lateral sclerosis. Respirology. 2007;12:304-307.
58. Zuberi S.M., Matta N., Nawaz S., et al. Muscle ultrasound in the assessment of suspected neuromuscular disease in childhood. Neuromuscul Disord. 1999;9:203-207.
59. Schreiber A., Smith W.L., Ionasescu V., et al. Magnetic resonance imaging of children with Duchenne muscular dystrophy. Pediatr Radiol. 1987;17:495-497.
60. Olsen D.B., Gideon P., Jeppesen T.D., Vissing J. Leg muscle involvement in facioscapulohumeral muscular dystrophy assessed by MRI. J Neurol. 2006;253:1437-1441.
61. Liu G.C., Jong Y.J., Chiang C.H., Jaw T.S. Duchenne muscular dystrophy: MR grading system with functional correlation. Radiology. 1993;186:475-480.
62. Sookhoo S., Mackinnon I., Bushby K., et al. MRI for the demonstration of subclinical muscle involvement in muscular dystrophy. Clin Radiol. 2007;62:160-165.
63. Kan H.E., Scheenen T.W., Wohlgemuth M., et al. Quantitative MR imaging of individual muscle involvement in facioscapulohumeral muscular dystrophy. Neuromuscul Disord. 2009;19:357-362.
64. Pillen S., Morava E., Van Keimpema M., et al. Skeletal muscle ultrasonography in children with a dysfunction in the oxidative phosphorylation system. Neuropediatrics. 2006;37:142-147.
65. Brooke M.H., Fenichel G.M., Griggs R.C., et al. Duchenne muscular dystrophy: patterns of clinical progression and effects of supportive therapy. Neurology. 1989;39:475-481.
66. Zaidman C.M., Connolly A.M., Malkus E.C., et al. Quantitative ultrasound using backscatter analysis in Duchenne and Becker muscular dystrophy. Neuromuscul Disord. 2010;20:805-809.
67. Reimers C.D., Schlotter B., Eicke B.M., Witt T.N. Calf enlargement in neuromuscular diseases: a quantitative ultrasound study in 350 patients and review of the literature. J Neurol Sci. 1996;143:46-56.
68. Trip J., Pillen S., Faber C.G., et al. Muscle ultrasound measurements and functional muscle parameters in non-dystrophic myotonias suggest structural muscle changes. Neuromuscul Disord. 2009;19:462-467.
69. Mercuri E., Jungbluth H., Muntoni F. Muscle imaging in clinical practice: diagnostic value of muscle magnetic resonance imaging in inherited neuromuscular disorders. Curr Opin Neurol. 2005;18:526-537.
70. Mercuri E., Cini C., Counsell S., et al. Muscle MRI findings in a three-generation family affected by Bethlem myopathy. Eur J Paediatr Neurol. 2002;6:309-314.
71. Mercuri E., Lampe A., Allsop J., et al. Muscle MRI in Ullrich congenital muscular dystrophy and Bethlem myopathy. Neuromuscul Disord. 2005;15:303-310.
72. Mercuri E., Counsell S., Allsop J., et al. Selective muscle involvement on magnetic resonance imaging in autosomal dominant Emery-Dreifuss muscular dystrophy. Neuropediatrics. 2002;33:10-14.
73. Adler R.S., Garolfalo G., Paget S., Kagen L. Muscle sonography in six patients with hereditary inclusion body myopathy. Skeletal Radiol. 2008;37:43-48.
74. Astrea G., Schessl J., Clement E., et al. Muscle MRI in FHL1-linked reducing body myopathy. Neuromuscul Disord. 2009;19:689-691.
75. Carboni N., Mura M., Marrosu G., et al. Muscle imaging analogies in a cohort of patients with different clinical phenotypes caused by LMNA gene mutations. Muscle Nerve. 2010;41:458-463.
76. Jungbluth H., Sewry C., Brown S.C., et al. Minicore myopathy in children: a clinical and histopathological study of 19 cases. Neuromuscul Disord. 2000;10:264-273.
77. Mercuri E., Bushby K., Ricci E., et al. Muscle MRI findings in patients with limb girdle muscular dystrophy with calpain 3 deficiency (LGMD2A) and early contractures. Neuromuscul Disord. 2005;15:164-171.
78. Fischer D., Walter M.C., Kesper K., et al. Diagnostic value of muscle MRI in differentiating LGMD2I from other LGMDs. J Neurol. 2005;252:538-547.
79. Mahjneh I., Lamminen A.E., Udd B., et al. Muscle magnetic resonance imaging shows distinct diagnostic patterns in Welander and tibial muscular dystrophy. Acta Neurol Scand. 2004;110:87-93.
80. Ahlberg G., Jakobsson F., Fransson A., et al. Distribution of muscle degeneration in Welander distal myopathy: a magnetic resonance imaging and muscle biopsy study. Neuromuscul Disord. 1994;4:55-62.
81. Kesper K., Kornblum C., Reimann J., et al. Pattern of skeletal muscle involvement in primary dysferlinopathies: a whole-body 3.0-T magnetic resonance imaging study. Acta Neurol Scand. 2009;120:111-118.
82. Cupler E.J., Bohlega S., Hessler R., et al. Miyoshi myopathy in Saudi Arabia: clinical, electrophysiological, histopathological and radiological features. Neuromuscul Disord. 1998;8:321-326.
83. Brummer D., Walter M.C., Palmbach M., et al. Long-term MRI and clinical follow-up of symptomatic and presymptomatic carriers of dysferlin gene mutations. Acta Myol. 2005;24:6-16.
84. Lodi R., Muntoni F., Taylor J., et al. Correlative MR imaging and 31P-MR spectroscopy study in sarcoglycan deficient limb girdle muscular dystrophy. Neuromuscul Disord. 1997;7:505-511.
85. Fischer D., Herasse M., Bitoun M., et al. Characterization of the muscle involvement in dynamin 2-related centronuclear myopathy. Brain. 2006;129:1463-1469.
86. Schessl J., Medne L., Hu Y., et al. MRI in DNM2-related centronuclear myopathy: evidence for highly selective muscle involvement. Neuromuscul Disord. 2007;17:28-32.
87. Flanigan K.M., Kerr L., Bromberg M.B., et al. Congenital muscular dystrophy with rigid spine syndrome: a clinical, pathological, radiological, and genetic study. Ann Neurol. 2000;47:152-161.
88. Mercuri E., Talim B., Moghadaszadeh B., et al. Clinical and imaging findings in six cases of congenital muscular dystrophy with rigid spine syndrome linked to chromosome 1p (RSMD1). Neuromuscul Disord. 2002;12:631-638.
89. Jungbluth H., Sewry C.A., Counsell S., et al. Magnetic resonance imaging of muscle in nemaline myopathy. Neuromuscul Disord. 2004;14:779-784.
90. Kornblum C., Lutterbey G., Bogdanow M., et al. Distinct neuromuscular phenotypes in myotonic dystrophy types 1 and 2: a whole body highfield MRI study. J Neurol. 2006;253:753-761.
91. Jungbluth H., Davis M.R., Muller C., et al. Magnetic resonance imaging of muscle in congenital myopathies associated with RYR1 mutations. Neuromuscul Disord. 2004;14:785-790.
92. Dlamini N., Jan W., Norwood F., et al. Muscle MRI findings in siblings with juvenile-onset acid maltase deficiency (Pompe disease). Neuromuscul Disord. 2008;18:408-409.
93. Pichiecchio A., Uggetti C., Ravaglia S., et al. Muscle MRI in adult-onset acid maltase deficiency. Neuromuscul Disord. 2004;14:51-55.