31 Troubleshooting of Biventricular Devices
 Electromechanical Events and Cardiac Pump Function
Consequences of Uncoupling at Various Levels
Uncoupling at the Atrial Level
The right atrium and left atrium are activated nearly simultaneously (within 50-80 milliseconds) during sinus rhythm. Preferential sites of interatrial conduction exist at the posterior-superior interatrial septum (Bachmann’s bundle region), fossa ovalis, and coronary sinus ostium.1,2 Significant interatrial conduction delays (up to 200 msec or greater) can occur in myopathic atria. Similar conduction delays can be also be induced, or exacerbated, by right atrial (RA) pacing. Delayed left atrial (LA) contraction can disrupt optimal left-sided atrioventricular (AV) coupling. Severe atrial decoupling and delayed LA contraction reverses the left-sided AV contraction sequence, resulting in atrial transport block.3 This causes increased LA pressures, retrograde flow in the pulmonary veins, and counterphysiologic neurohormonal responses termed pseudo–pacemaker syndrome.4–6
Uncoupling at the Atrioventricular Level
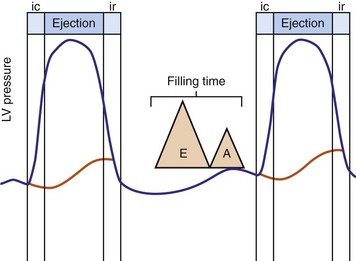
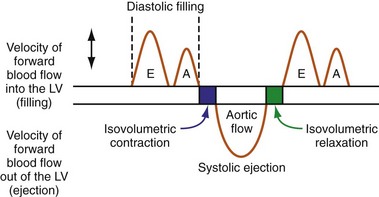
Optimal AV coupling contributes to ventricular pump function through Starling’s law. The normal intrinsic atrioventricular interval (iAVI) results in atrial contraction just before the preejection (isovolumetric) period of ventricular contraction that maximizes left ventricular (LV) filling (LV end-diastolic pressure, or preload) and cardiac output. Appropriately timed AV coupling maintains a low mean atrial pressure, increases LV filling time, maximizes preload and pump function (Starling mechanism), and positions the mitral valve for closure during the isovolumetric phase of ventricular systole (Fig. 31-1).
Delayed AV coupling resulting from AV conduction delay displaces atrial contraction earlier in diastole (Fig. 31-2). Atrial contraction occurs during ventricular filling, which shortens diastolic filling time, and in extreme situations, occurs immediately after or coincident with the preceding ventricular contraction. This situation is aggravated by ventricular conduction delay, which increases ventricular ejection time and delays diastolic filling, increasing the probability of collision with atrial contraction. Atrial contraction before completion of venous return reduces preload stretching of the left ventricle, which reduces ventricular volume and contractile force. Delayed AV coupling reduces diastolic filling time and may result in diastolic mitral regurgitation when elevated LV end-diastolic pressure exceeds LA pressure. Partial closure of the mitral valve may also occur, further shortening diastolic filling time.
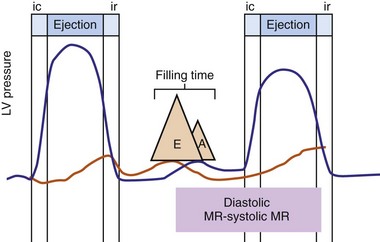
Figure 31-2 Schematic of hemodynamic effects of AV decoupling on LV pump function.
Same arrangement as in Figure 31-1. Atrial contraction truncates passive diastolic filling (E-A fusion). A late diastolic left ventricular–left atrial (LV-LA) pressure gradient before mitral valve closure results in diastolic mitral regurgitation. LV filling is reduced and pump function declines (reduced LV pressure during ejection).
Delayed AV coupling may be worsened or induced by atrial pacing. This is a consequence of atrial capture latency, increased atrial conduction time resulting from altered activation, and increased AV nodal conduction time from altered atrial input. These effects of atrial pacing are enhanced by increased heart rates during atrial pacing and autonomic changes during sleep.7
Severe AV decoupling coexists with ventriculoatrial (VA) coupling. In extreme conditions LA contraction occurs immediately after, within, or preceding the LV contraction, causing reversal of the left-sided AV contraction sequence,3 which initiates counterphysiologic circulatory and neurohumoral reflexes. These derangements (pseudo–pacemaker syndrome) have been rarely described during marked first-degree AV block and atrial pacing.4 The identical pathophysiology occurs during AV synchronous ventricular pacing when LV contraction timing is too early, resulting in LA transport block (Fig. 31-3). This situation is corrected by proper timing of ventricular contraction with pacing (see Atrioventricular Optimization).
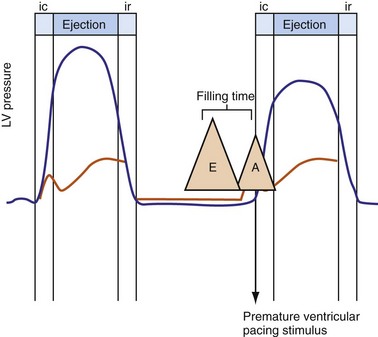
Figure 31-3 Hemodynamic effects of short A-V interval on LV pump function.
Same arrangement as in Figures 31-1 and 31-2. Ventricular contraction triggered by premature pacing stimulus (arrow) truncates atrial emptying (atrial transport block). Atrial pressure increases, LV filling decreases, and pump function declines (reduced LV pressure during ejection).
Ventricular Level
Normal LV electrical activation is rapid and homogeneous with minimal temporal dispersion throughout the wall.8 This elicits a synchronous mechanical activation and ventricular contraction.9 The resulting coordinated myocardial segment activation maximizes ventricular pump function. Wiggers10 established the linkage between pacing-induced alterations in ventricular conduction and pump function with two seminal observations in 1925: (1) pacing at virtually any ventricular site disturbs the natural pattern of activation and contraction, because the evoked electrical wavefront propagates slowly through ventricular myocardium rather than through the His-Purkinje system, and (2) altered ventricular activation causes an immediate reduction in pump function, and some sites are worse than others (site selectivity). In general, right ventricular (RV) pacing sites appear to be more detrimental than LV pacing sites, and the right ventricular apex (RVA) is among the worst sites within the right ventricle.11
Optimal interventricular and intraventricular coupling is more important than AV coupling for maximum ventricular pumping function.12,13 RVA pacing and left bundle branch block (LBBB) both induce delays in transseptal and intraventricular conduction.14 Consequently, the hemodynamic effects of altered ventricular activation during RVA pacing and LBBB are comparable. These effects can be attributed to disturbed interventricular as well as intraventricular coupling. RVA pacing also disturbs RV activation as a result of slow intramyocardial conduction.
Interventricular decoupling refers to a sequential RV-LV activation delay. In LBBB the earliest ventricular depolarization is recorded over the anterior RV surface and generally latest at the posterior or posterolateral basal LV surface.15–20 Interventricular dyssynchrony can be quantified by the time delay between the upslopes of LV and RV systolic pressure,12 as well as time delay between opening of the pulmonic and aortic valves.21 Similar changes occur during RV pacing. This disruption to ventricular interdependence is a determinant of paradoxical septal motion. Presumably this reduction in ventricular septal contribution to LV ejection is an important factor in the reduction of pump function during LBBB.12,22
Delayed intraventricular activation is presumably the most important determinant of reduced pump function. In RVA pacing and LBBB, electrical activation starts in the interventricular septum, with the posterior or posterolateral basal LV wall activated more than 100 msec later. Such considerable intraventricular delay during RVA pacing and LBBB pacing is caused by slow spread of the depolarization wavefront through the working myocardium rather than through the Purkinje system. Slow intramyocardial conduction during RVA pacing prolongs QRS duration (QRSd) from the normal values of about 80 msec to values of 140 msec in otherwise normal hearts, to about 200 msec in infarcted left ventricles.14 Furthermore, the delay in LV activation relative to QRSd during RVA pacing is greater in failing ventricles.23
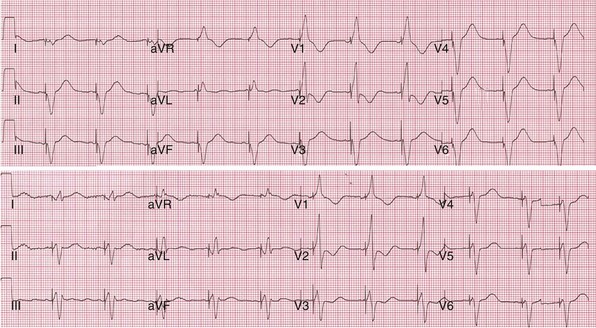
Left bundle branch block is a complex electrical disease resulting from LV conduction delay at multiple anatomic levels (fixed or functional) and is exhibited differently according to substrate characterization (ischemic vs. nonischemic dilated cardiomyopathy [DCM]). Early endocardial activation mapping studies of LBBB concluded that conduction delay resided entirely within the ventricular septum, and that LV endocardial activation was rapid after single-point breakthrough in nonischemic DCM, whereas activation was slowed across regions of scar throughout the left ventricle in ischemic DCM.15 In both situations the posterior or posterolateral basal left ventricle is the latest activated region.
Higher-resolution endocardial and epicardial mapping studies have revealed that LV activation during LBBB, despite a similar surface electrocardiographic appearance, is considerably heterogeneous. At least three patterns of delayed LV activation have been characterized: (1) transseptal delay with or without LV endocardial delay, (2) normal transseptal conduction with slow conduction velocities in peri-infarct regions and globally slow in nonischemic DCM, and (3) slowed U-shaped activation around a line of functional block on the anterior wall.16–20 Generally, QRSd of 120 to 150 msec indicates delay confined specifically to the specialized conduction system, whereas QRSd greater than 150 msec usually indicates additional conduction delay in diseased myocardium.
The pattern of transseptal activation delay varies and influences LV endocardial activation. Significantly prolonged transseptal conduction times through a diseased left bundle branch result in midseptal LV or septoapical breakthroughs and unidirectional wavefront propagation throughout the left ventricle. Rapid transseptal conduction times typify conduction through septal branches of the His-Purkinje system, with basal breakthroughs from the anterior or posterior fascicle and bidirectional wavefront propagation from base to apex and high septum. Breakthrough from both fascicles results in a double wavefront that fuses on the posterolateral wall. Single-site breakthrough from the high septum caused by right-to-left muscular conduction (no conduction system present) results in a single wavefront that propagates from base to apex.16 The pattern of septal activation may affect ventricular mechanics differently. High septal activation may result in simultaneous RV and LV activation in opposite directions, and papillary muscle activation may be influenced by the earliest site of LV activation.16,20,24,25
Anterior locations of the line of functional block are characterized by a U-shaped LV activation pattern,17–19 more prolonged QRSd (>150 msec), and longer time to LV breakthrough.18 Late activation of the posterior or posterolateral basal left ventricle occurred by wavefront propagation around the line of block using the apical or inferior LV walls. Lateral locations of the line of block are characterized by less prolonged QRSd (<150 msec) and shorter time to LV breakthrough. Pacing maneuvers shift either line of block, indicating their functional nature. Noninvasive mapping of epicardial activation using body surface potentials extended these observations and demonstrated that electrical activation patterns in LBBB are highly heterogeneous and unpredictable.20 Lines of conduction block do not correlate with regions of wall motion abnormality or scarring. Some lines of block arose only during pacing and were site dependent (functional), whereas other lines of block could not be manipulated with pacing maneuvers, indicating these were caused by slow or absent conduction (fixed). Latest activation most often occurred in the posterior or posterolateral basal wall, but was also observed in the anterior and inferior walls in some patients.
Effects of Asynchrony on Left Ventricular Mechanics and Structure
Regions that are activated early also start to contract early. Accordingly, in RVA pacing and LBBB, earliest and latest sites of segmental LV activation correlate well with time to peak systolic velocity by Doppler imaging19 and strain by tagged magnetic resonance imaging (MRI),9,26–28 providing evidence that ventricular conduction delay is responsible for heterogeneous mechanical performance (asynchrony). The mechanical effect of asynchronous electrical activation is dramatic, because the various regions differ not only in the time of onset of contraction, but also in the pattern of contraction (Fig. 31-4). Contraction of early-activated myocardium is energetically inefficient because LV pressure is low and ejection has not begun. Instead, stretching of remote regions not yet activated absorbs the energy generated by the early-activated regions. This stretching further delays shortening of these late activation regions and increases their force of local contraction by virtue of the Frank-Starling mechanism (locally enhanced preload). Vigorous late systolic contraction at delayed sites occurs against high LV cavity pressures (locally enhanced afterload) and imposes loading on the earlier activated regions, which now undergo systolic paradoxical stretch.29 This reciprocated stretching of regions within the LV wall causes a less effective and energetically efficient contraction.30
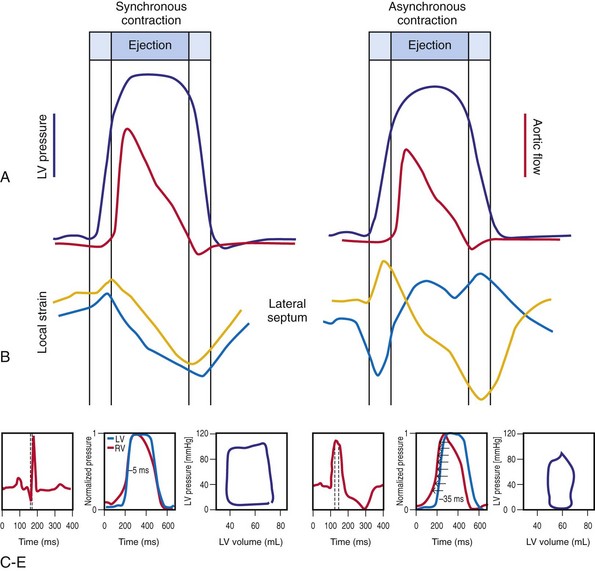
The hemodynamic consequences of the asynchronous LV contraction are reductions in contractility and relaxation. These changes occur immediately on initiating RVA pacing in humans and animals,11,31 and induction of LBBB in animals12 (see Fig. 31-4). The loss of pump function is indicated by decreases in stroke volume, stroke work, and slower rate of rise of LV pressure (Fig. 31-5). Moreover, the LV end-systolic pressure-volume relationship shifts rightward, indicating that the left ventricle operates at a larger volume in order to recruit the Frank-Starling mechanism.11 Premature relaxation in early-activated regions, and delayed contraction in others also causes abnormal relaxation,11 as expressed as slower rate of fall of LV pressure, increase in the relaxation time constant tau, and decrease of E-wave velocity amplitude on Doppler echocardiograms.32 These changes also lead to prolongation of the isovolumetric contraction and relaxation times, which are characteristic for asynchronous hearts.33 The prolongation of the isovolumetric times occurs mainly at the expense of the diastolic filling time, leading to reduced preload.
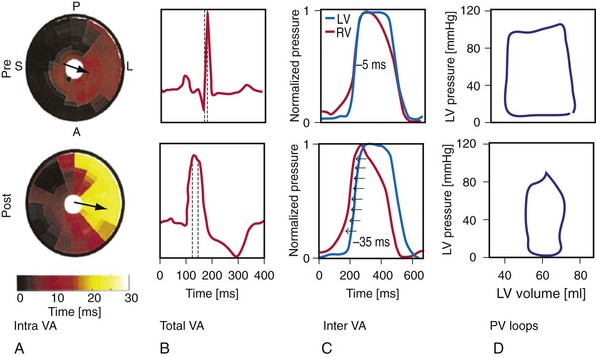
Figure 31-5 Left bundle branch block (LBBB)–induced asynchrony causes immediate reduction in LV contractility.
(Modified from Vernooy K et al: Left bundle branch block induces ventricular remodeling and functional septal hypoperfusion. Eur Heart J 26:91-98, 2005.)
The redistribution of the mechanical load within the ventricular wall also leads to reduction of regional myocardial perfusion and oxygen consumption near the RVA pacing site30,34,35 and in the septum during LBBB.36,37 Such perfusion defects and wall motion abnormalities have been demonstrated in up to 70% of patients with angiographically normal coronary arteries exposed to chronic RVA pacing.38–41 These defects are reversible on cessation of RVA pacing39,41 and after biventricular pacing.36,37,42 Accordingly, such perfusion “deficits” do not necessarily indicate coronary heart disease, because they may simply express the regional differences in myocardial workload.
Similar to the situation after myocardial infarction, acute loss of pump function initiates compensatory responses (Figs. 31-6 and 31-7). Some of these responses, after a certain time and or degree of asynchrony, may result in further impairment of pump function and clinical heart failure. There are various triggers for these “remodeling” processes. As for other conditions of hemodynamic overload, RVA pacing and LBBB lead to stimulation of the sympathetic system, resulting in elevated myocardial catecholamine levels,43 and activation of the renin-angiotensin-aldosterone system. Regional differences in stretch and mechanical load heterogeneity are most likely important stimuli for remodeling processes. Chronic asynchronous LV activation results in regional and global structural changes indicated by asymmetric hypertrophy, increased end-diastolic volume, and reduced ejection fraction36,44 (see Fig. 31-6), as well as locally different molecular abnormalities, including reductions in sarcoplasmic reticulum calcium-ATPase and phospholamban.45 Even stronger regional differences in gene expression are found in failing hearts with conduction abnormalities.46 Dystrophic calcifications, disorganized mitochondria, and myofibrillar cellular disarray47 have been described with RVA pacing, especially in immature hearts.
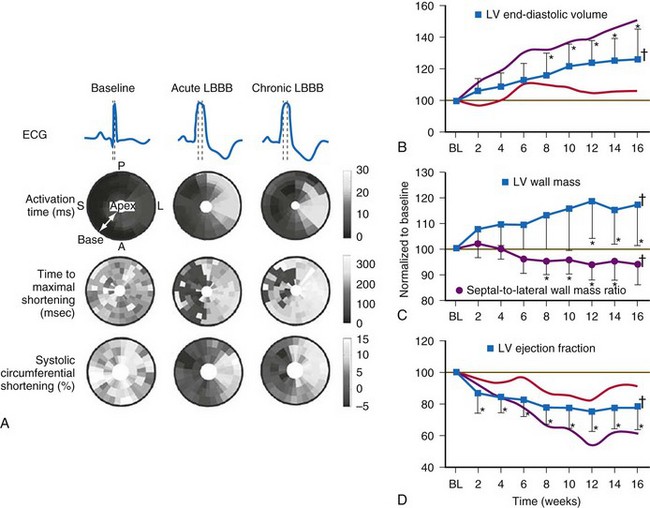
Figure 31-6 Left bundle branch block (LBBB).
(Modified from Vernooy K et al: Left bundle branch block induces ventricular remodeling and functional septal hypoperfusion. Eur Heart J 26:91-98, 2005.)
Early signs of cellular and molecular adaptation to disturbed ventricular activation are manifest as reduction in ejection fraction (EF) within the first week of RVA pacing. In patients with normal EF, Nahlawi et al.31 showed an immediate drop in EF of about 7%, followed by another 7% drop during the subsequent week. Suppression of RVA pacing returned EF to baseline values, but only after several days.48 Also, ventricular repolarization abnormalities have been observed within hours of RVA pacing. Alterations in potassium and calcium channels likely play a role in these phenomena.
Mechanistic Basis for Development of Asynchronous Heart Failure Caused by Ventricular Conduction Delay
As mentioned, synchronous activation consistently leads to acute and long-term adverse effects on cardiac pump function, which create a vicious cycle of deterioration. Accordingly, the pacing-induced ventricular conduction delay has been linked to increased risks of atrial fibrillation, heart failure, ventricular tachyarrhythmia, and death in large, randomized clinical trials of pacemakers and ICDs.49–56 Similar risks have been reported for LBBB and cardiac morbidity and mortality.57
Multiple factors may contribute to heart failure associated with ventricular asynchrony. At least three candidate factors are readily identified: (1) reduced pump function caused by asynchronous contraction (dyssynchrony), (2) adverse remodeling caused by long-term dyssynchrony, (3) left-sided AV desynchronization, and (4) functional mitral regurgitation (fMR). The first three factors are discussed earlier. The fMR frequently accompanies pacing-induced or spontaneous asynchronous heart failure and has multiple mechanisms.24,25,58,59 Assuming the anterior mitral leaflet is structurally normal, the immediate cause of fMR is delayed activation of the LV posterior “apparatus” caused by ventricular conduction delay.25,60 This apparatus consists of the posterior leaflet and annulus, the LV summit it sits on, the chordae, the papillary muscles, and the LV wall from which they emanate. Rapid activation of the posterior apparatus requires normal ventricular conduction.
Early closure of the mitral valve is arguably the most important accomplishment of the entire conduction system because it facilitates Starling’s law; that is, it permits isovolumetric systole to occur when the ventricle is as full as it can be given the filling conditions. Delayed ventricular conduction prevents mitral valve coaptation and induces fMR during isovolumetric contraction. Ventricular conduction delay instantaneously reduces the transmitral pressure gradient (systolic LV pressure–LA pressure difference) or mitral valve closing force, by reducing contractility (↓LV dP/dt). Chronically, volumetric remodeling contributes to fMR by further reductions in contractility (closing forces) and increasing papillary muscle tethering forces59,61,62 (Fig. 31-8). Tethering strongly depends on alterations in ventricular shape because the tethering forces that act on the mitral leaflets are higher in dilated, more spherical ventricles. Ventricular dilation and increased chamber sphericity increase the distance between the papillary muscles to the enlarged mitral annulus as well as to each other, restricting leaflet motion and increasing the force needed for effective mitral valve closure. Under these conditions, the mitral regurgitant orifice area will be largely determined by the phasic changes in transmitral pressure.
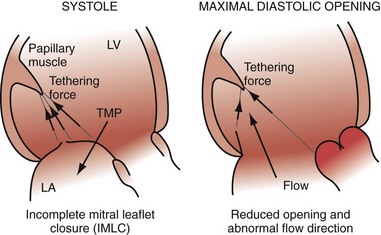
Figure 31-8 Effects of augmented mitral valve leaflet tethering in dilated cardiomyopathy.
(Modified from Otsuji Y, et al: Restricted diastolic opening of the mitral leaflets in patients with left ventricular dysfunction: evidence for increased valve tethering. J Am Coll Cardiol 32:398-404, 1998.)
There is some intriguing evidence that LBBB may be the primary cause of DCM in some patients. Progressive LV enlargement after the emergence of LBBB unaccompanied by any other explanation has been documented in case series.63 Furthermore, complete recovery of ventricular function shortly after initiation of biventricular pacing in “hyperresponders” suggests that LBBB may be a primary and reversible trigger of DCM in some patients.64,65
Several studies also showed that LBBB is associated with increased mortality, with greater impact in sicker patient populations. The relative risk associated with the presence of LBBB varied between 1.5 and 2.0, even after adjustment for covariates.57 The only study rejecting the association of LBBB with increased mortality drew this conclusion after adjustments for LV EF as a covariable.66 However, the conclusion that LBBB is not an independent predictor of mortality after the adjustment for EF can be understood because LBBB directly reduces EF because of its acute and chronic effect on LV pump function (see earlier).
Mechanisms of Cardiac Resynchronization Therapy
Fixed and functional disruptions to normal electromechanical ordering caused by conduction delay are targeted for electromechanical reconstitution of pump function. CRT has two immediate effects on electromechanical ordering: ventricular activation sequence and chamber timing. The basis of this therapeutic strategy is to restore coordinated contraction by minimizing the conduction delay, thereby restoring interventricular and intraventricular coupling. A second-order effect is the reduction of left-sided AV decoupling, which may improve diastolic performance and thus LV pumping function. As part of this effect, fMR may be reduced. These acute beneficial hemodynamic effects may lead to even more beneficial long-term effects, because many adverse molecular and cellular derangements elicited by chronic RVA pacing or LBBB appear to be reversible. This property of CRT is remarkable; many pharmacologic therapies tend to lose effectiveness over time, whereas the beneficial effects of CRT are maintained for many years. The best explanation of the lasting benefit of CRT is that it largely restores the normal electromechanical coupling of the heart with LBBB. This idea is supported by studies in the canine models in which CRT abolished all adverse effects of LBBB.42 Thus, CRT may be “curative” of LBBB-induced ventricular “desynchronapathy” in some situations.
Improved Atrioventricular Mechanics from Optimal AV Resynchronization
When LV contraction timing is delayed, even when AV conduction times are normal, the hemodynamic consequences are similar to a prolonged AV interval, as shown in Figure 31-2. Left-sided AV decoupling, due to LV conduction delay and/or AV conduction delay, is corrected with LV pacing. Optimal AV timing improves LV pump function, but the primary mechanism of improved ventricular mechanics during CRT is reduction in ventricular conduction delay. AV timing considerations during CRT are considered in detail later.
Improved Ventricular Mechanics from Reduced Ventricular Conduction Delay
Reduction of intraventricular delay during atrial-synchronous LV or biventricular pacing has an immediate positive effect on ventricular mechanics and is the dominant therapy effect of CRT. Instantaneous improvement in pump function is indicated by increases in LV +dP/dtmax, stroke volume, stroke work, arterial pulse pressure and peak systolic pressure,67,68 and reduced end-systolic volume (Fig. 31-9). Moreover, unlike the inotropic effects of dobutamine, systolic augmentation with ventricular resynchronization increases efficiency of conversion of myocardial oxygen consumption to mechanical work.69 This positive contractile response demonstrates a modestly positive correlation with increasing baseline QRSd67–69 and is strongly correlated with baseline mechanical dyssynchrony.69,70 Conversely, neither improved contractility nor reverse volumetric remodeling requires QRS narrowing during LV or biventricular pacing.68,71,72 However, unlike the inotropic effects of dobutamine, systolic augmentation with ventricular resynchronization does not increase detrimental myocardial oxygen consumption. These acute improvements in ventricular mechanics are maintained chronically and are accompanied by reverse volumetric remodeling of the LV (see later).73 Abrupt discontinuation of LV pacing results in immediate reduction in indices of improved contractility and regression of reverse remodeling over several weeks,73,74 as well as recurrence of fMR.25
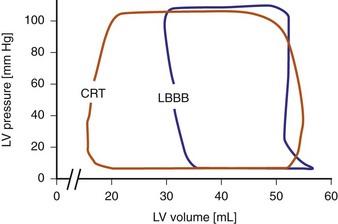
Figure 31-9 Pressure-volume loops during LBBB and LV pacing.
(Modified from Verbeek XA, Vernooy K, Peschar M: Intra-ventricular resynchronization for optimal left ventricular function during pacing in experimental left bundle branch block. J Am Coll Cardiol 42:558-567, 2003.)
Maximally effective ventricular resynchronization occurs at the midpoint of the interventricular (V-V) interval (Fig. 31-10), which is the conduction time from RV to LV pacing site during native activation. A single optimum AV delay will achieve maximally effective ventricular resynchronization by advancing LV activation sufficiently to minimize the V-V interval. The AV delay and the V-V interval have an interactive relationship. The effect of AV delay on acute hemodynamic response to CRT is best understood in terms of the effect on ventricular resynchronization during biventricular (BiV) or left univentricular pacing (Fig. 31-11). During LBBB, the right ventricle is activated by right bundle branch conduction (RBBc) before the left ventricle, and the time difference between RV and LV activation is the interventricular conduction delay.13 BiV pacing at short atrioventricular delay (AVD) results in complete replacement of intrinsic activation, allowing complete control of chamber timing with sequential ventricular stimulation. Intermediate AVDs result in fusion among RBBc, RV paced activation, and LV paced activation. Long AVDs result in “pure” fusion between RBBc and LV paced activation since LV preexcitation is still possible because of interventricular conduction delay.13,75,76 Modification of the AVD alone can therefore achieve (1) BiV paced fusion, (2) BiV paced fusion with sequential ventricular stimulation (LV first), and (3) “pure” RBBc-LV pacing fusion. Therefore, LV preexcitation is possible across a range of AVDs because LV time is delayed relative to RV time. RV pacing is not necessary to achieve fusion, and AVD can be used to time the relative prematurity of LV preexcitation. At very short AVDs, this requires sequential VV timing. At very long AVDs, this occurs spontaneously because of the native V-V interval.
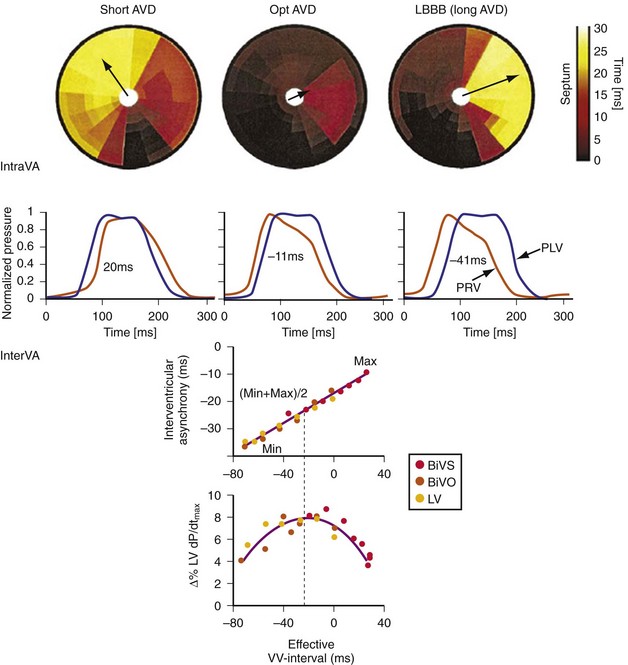
Figure 31-10 Relationship between intraVA and interVA under various LV pacing conditions.
(Modified from Verbeek XA, Vernooy K, Peschar M: Intra-ventricular resynchronization for optimal left ventricular function during pacing in experimental left bundle branch block. J Am Coll Cardiol 42:558-567, 2003; and Vernooy K, et al: Calculation of effective VV interval facilitates optimization of AV delay and VV interval in cardiac resynchronization therapy. Heart Rhythm 4:75-82, 2006.)
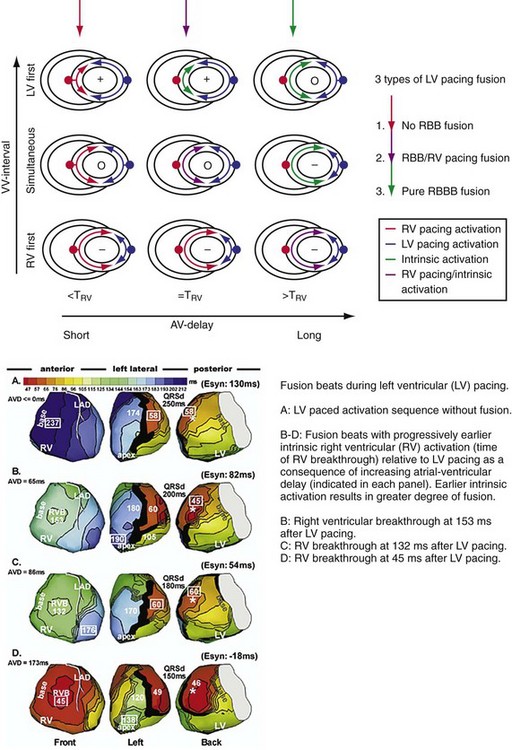
Figure 31-11 Top, Interaction between atrioventricular delay (AVD) and V-V interval to determine LV activation fusion. T-RV is time to intrinsic RV activation (RA sense to RV sense, or P-R interval). During short AVD pacing (AVD < T-RV), biventricular pacing completely replaces native activation (surrogate fusion), and relative timing of ventricular activation is determined by sequential ventricular stimulation (RV first, simultaneous, LV first). When AVD = T-RV, RV pacing occurs simultaneously with intrinsic conduction, resulting in a combination of RV pacing and intrinsic conduction, whereas left ventricle is still activated earlier than would have occurred due to LBBB. When AVD > T-RV, LV-only pacing occurs with true fusion of native and paced activation. Bottom, Epicardial isochrone maps are shown during LV-only pacing at increasing pacemaker A-V intervals (pAVIs). Activation times relative to QRS onset are color-coded with red earliest and blue latest; framed numbers indicate earliest and latest activated sites. Asterisk, LV stimulation site. Black lines indicate line/region of conduction block, which influences activation wavefront propagation (see Fig. 31-77). A, pAVI = 0 msec. Note sequential ventricular activation (LV→RV): LV is activated earliest, and latest activation occurs at posterobasal right ventricle. B to C, Progressive fusion of paced LV activation with intrinsic LV activation via RBB as pAVI is increased from 65 to 86 msec. Note also progressively early RV activation from RBB conduction. D, Maximum ventricular activation wavefront fusion at pAVI = 173 msec. Note right and left ventricles are simultaneously activated (Esyn, electrical synchrony, = −18 msec).
(Modified from Jia P et al: Electrocardiographic imaging of cardiac resynchronization therapy in heart failure: observation of variable electrophysiologic responses. Heart Rhythm 3:296-310, 2006.)
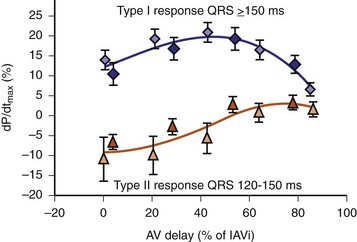
Early acute hemodynamic studies demonstrated that the relationship between AVD and LV dP/dtmax in patients with an acute improvement in contractile response to simultaneous BiV pacing is positive and unimodal, with a peak effect at approximately 50% of the native P-R interval, resulting in complete replacement of native ventricular conduction with paced activation67,68,77 (Fig. 31-12). This dose-response relationship between AVD and acute contractile response shown is interpreted as follows. The magnitude of the acute contractile response depends on the magnitude of baseline asynchrony (ventricular conduction delay, QRSd) and the AVD, which titrates how much intrinsic ventricular activation is replaced by pacing activation. Patients with greater ventricular conduction delay (QRS >150 msec) benefit from near-complete replacement of intrinsic activation with BiV or LV pacing (i.e., short AVDs). Patients with less ventricular conduction delay (QRS <150 msec) benefit from limited replacement of intrinsic activation (e.g., long AVDs). Typically, programmed short AVDs of 100 to 120 msec, although near-optimal for some patients, may result in decreased contractile function in patients with less baseline asynchrony (e.g., QRS <150 msec) because even BiV pacing induces asynchrony.9 LV dP/dtmax increased 15% to 45% across a narrow range of AVDs and declined at very short AVDs (truncated filling times) or very long AVDs (inadequate correction of LV conduction delay). This maximum improvement in pump function (LV +dP/dtmax and stroke volume) occurs at minimal intraventricular asynchrony and unchanged LV end-diastolic pressure (preload).13 This indicates that the acute contractile response is explained by ventricular resynchronization, not by better filling, and that the dose of resynchronization is titrated by the AVD.
The best ventricular resynchronization occurs when the wavefronts from the RV pacing site (or originating from RBBc) and the LV pacing site collide halfway.78 Experimental evidence suggests that optimal hemodynamic effect can be achieved using LV pacing at certain AVDs as well as using simultaneous and sequential BiV pacing because fusion of electrical wavefronts can be achieved by either approach13,79 (see Fig. 31-10). Although this and other experimental studies show a clear mechanism of action for optimizing the interaction between AV and VV timing, confusion surrounds this area, and a clinical advantage of patient-specific timing optimization has not been convincingly demonstrated in clinical trials80–82 (see later).
Reverse Volumetric Left Ventricular Remodeling
Mechanical resynchronization reduces mechanical load heterogeneity throughout the left ventricle. Sustained improvement in ventricular mechanics results in regression of adverse LV remodeling, termed reverse remodeling. This is indicated by reductions in LV volumes and mass, reduced mitral orifice size, regression of asymmetric hypertrophy, and increased EF.73,83–90 The magnitude of the reduction in end-systolic volume ranges between 10% and 30%,83,87,91,92 which is equivalent or greater than the effects of beta-adrenergic blockers and angiotensin-converting enzyme (ACE) inhibitors. These hemodynamic effects are chronically sustained assuming LV pacing is continuously maintained.73 Although improvement in New York Heart Association (NYHA) functional class, quality of life, and 6-minute walk tests may be confounded by placebo effects and reporting bias, reverse remodeling is a completely objective measure. More importantly, it appears to be related to better survival.92,93
Evidence of greater baseline electromechanical asynchrony and acute mechanical resynchronization appears to be necessary for reverse remodeling to occur, and the greater the reduction in asynchrony, the higher the probability of remodeling.72,90,94 Likewise, absence of electromechanical resynchronization acutely eliminates the possibility of chronic reverse remodeling.72,90 In canine hearts with induced LBBB, 8 weeks of CRT was sufficient to reverse almost completely the about 25% LV cavity dilation and asymmetric LV hypertrophy induced by dyssynchrony to pre-LBBB baseline values.42 This observation has been replicated in clinical studies where in some cases, reverse remodeling results in complete normalization of LV volumes and EF.64 This suggests that ventricular conduction delay may be the primary cause of DCM in some patients,63–65 as it was to a more moderate degree in the LBBB dogs.
Reduction in Functional Mitral Regurgitation
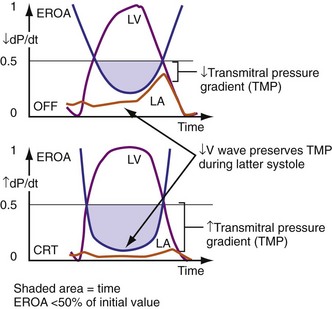
Figure 31-13 One mechanism for acute reduction in severity of functional mitral regurgitation during CRT.
(Modified from Breithardt OA, et al: Acute effects of cardiac resynchronization therapy on functional mitral regurgitation in advanced systolic heart failure. J Am Coll Cardiol 203:765-770, 2003.)
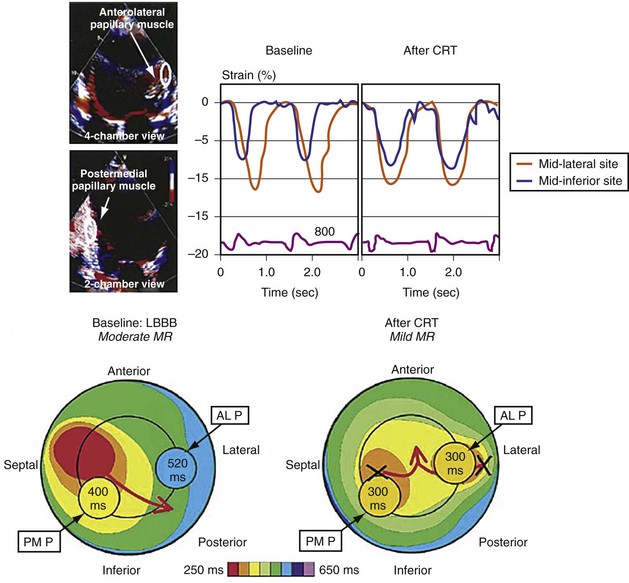
Figure 31-14 Effect of earlier delivery of posterior apparatus on functional mitral regurgitation (fMR).
(Modified from Kanzaki H, et al: A mechanism for immediate reduction in mitral regurgitation after cardiac resynchronization therapy: insights from mechanical activation strain mapping. J Am Coll Cardiol 44:1619-1625, 2004.)
 Cardiac Resynchronization Therapy Systems
Hardware Systems
Leads and Electrodes: Non–Independently Programmable Ventricular Polarity Configurations
In a dual-bipolar configuration, both lead tips are the active electrodes (cathodes) and the rings are the common (nonstimulating) anode. However, the type of ventricular leads implanted defines the pacing/sensing vector (Figs. 31-15 and 31-16). With two unipolar leads, the bipolar setting results in no pacing or sensing. If both leads are bipolar, both rings act as the common electrode. If one lead is bipolar (RV) and the other lead is unipolar (typically LV), the ring on the bipolar lead acts as the common electrode (nonstimulating anode). This configuration results in shared-ring bipolar pacing and sensing. This hybrid bipolar/unipolar stimulation configuration (“dual cathodal”) is employed in most contemporary CRT pacing systems.
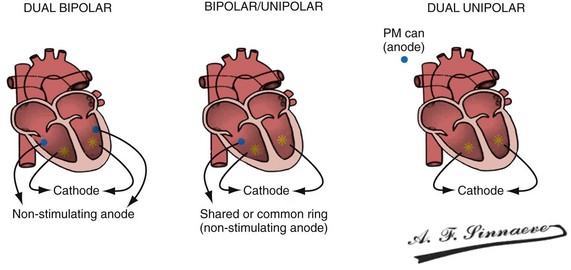
Figure 31-15 Biventricular pacing configurations.
(From Barold SS, Stroobandt RX, Sinnaeve AF: Cardiac pacemakers step by step: an illustrated guide. Malden, Mass, 2004, Blackwell.)
Pulse Generators
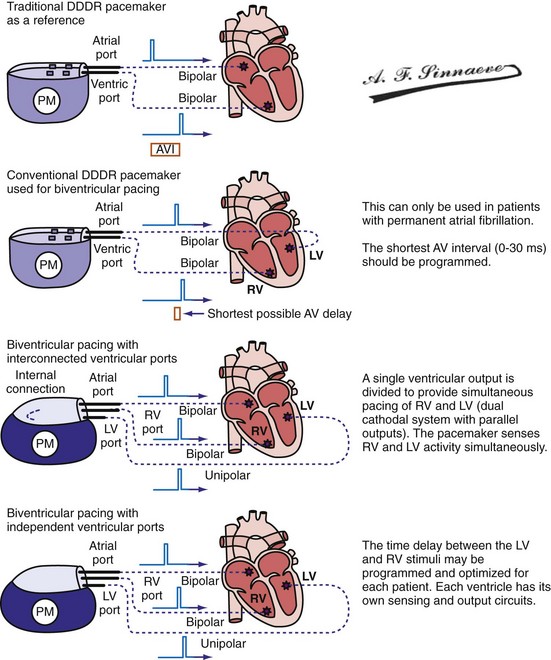
Conventional dual-chamber pulse generators or specially designed multisite pacing pulse generators may be used for CRT applications (Fig. 31-17). A conventional dual-chamber pulse generator is well suited for CRT in patients with permanent atrial fibrillation. In this situation, the ventricular port is used for the RV lead and the atrial port is used for the LV lead. This permits programming of independent outputs and ventricular-ventricular timing by manipulation of the AV delay. The programming mode can be either DDD/R or DVI/R (see later). A conventional dual-chamber pulse generator can also be used for atrial-synchronous BiV pacing. The single ventricular output must be divided to provide simultaneous stimulation of the RV and LV (dual cathodal system with parallel outputs). This is achieved with a Y adapter and results in simultaneous RV and LV sensing, which may result in ventricular double-counting and loss of CRT, or pacemaker inhibition in the case of LV lead dislodgment into the coronary sinus with sensing of atrial activity.96
Programming Considerations
Pacing Modes
It is axiomatic that for maximal delivery of CRT, ventricular pacing must be continuous.
Determining LV and RV Capture: Importance of Electrocardiography
Monochamber RV apical (RVA) pacing generates right (R) → left (L) activation in the frontal plane and anterior (A) → posterior (P) activation in the horizontal plane, resembling LBBB activation (Fig. 31-18). Consequently, mean QRS frontal plane axis is usually left superior and is infrequently right superior. Pacing from the midsuperior RV septum also generates right (R) → left (L) activation in the frontal plane and anterior (A) → posterior (P) activation in the horizontal plane, but the mean QRS frontal plane axis is typically left inferior. Monochamber LV pacing produces a variety of activation sequences depending on stimulation site and conduction blocks. A few generalizations are possible. Posterior wall stimulation usually generates an L → R, P → A activation, and mean QRS frontal plane axis is usually right superior, less often right inferior. A detailed discussion of ventricular activation sequences during monochamber LV and BiV pacing is provided later. Figure 31-19 shows a typical example of ventricular activation during monochamber RVA versus monochamber LV capture threshold determination.
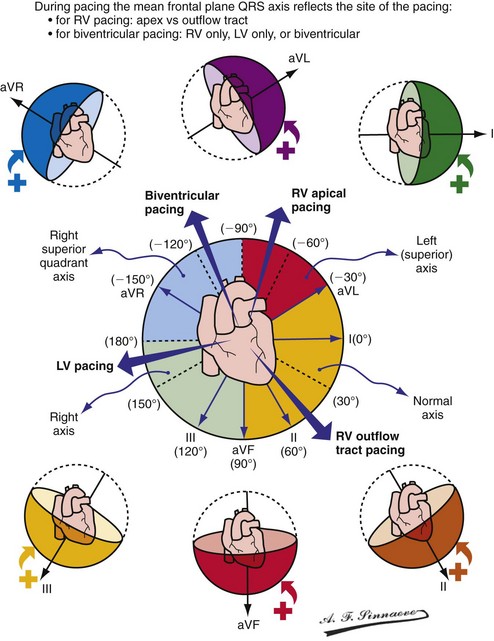
Figure 31-18 Mean frontal plane QRS axis during various conditions of ventricular pacing.
(From Barold SS, Stroobandt RX, Sinnaeve AF: Cardiac pacemakers step by step: an illustrated guide. Malden, Mass, 2004, Blackwell.)
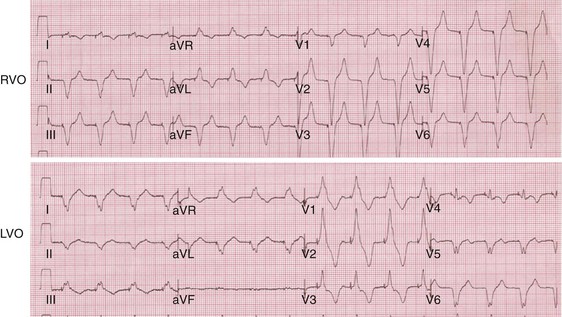
Figure 31-19 Typical ventricular activation sequences during monochamber RV and LV pacing threshold determination.
Anodal capture results in a distinct change in activation pattern compared to BiV pacing that can only be appreciated on the 12-lead ECG (Fig. 31-20). The change in QRS morphology related to loss of anodal capture as voltage output is decremented during a temporary threshold test using a single ECG lead may be misinterpreted as loss of LV capture and may result in erroneous overestimation of the LV threshold.
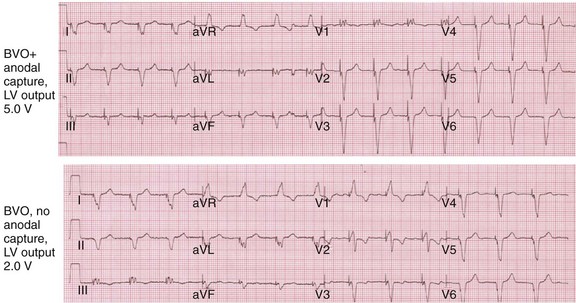
Figure 31-20 Effect of anodal capture on ventricular activation sequence during simultaneous biventricular (BiV) pacing.
Same patient as in Figure 31-19. RV apex and LV posterior wall capture thresholds are less than 1 V. Top, Simultaneous BiV pacing when LV output is 5 V (5 times > threshold) resulting in anodal capture. Bottom, Simultaneous BiV pacing when LV output is 2 V and no anodal capture. Note change in activation sequence. During high-LV-output BiV pacing, anodal capture is indicated by attenuation of monophasic R wave in V1 and loss of R (QS) in V2 (horizontal plane) and attenuation of QS in lead I and aVL (frontal plane). QRS duration is shorter. During lower-output BiV pacing, loss of anodal capture is indicated by dominant QS in I, aVL, and dominant R (V1) and RS (V2). QRS duration is longer.
The physiologic consequences of anodal capture are uncertain. One study demonstrated that anodal capture might be advantageous during CRT by counteracting the regional activation delay located at the inferior wall of the left ventricle and improving regional measures of intraventricular dyssynchrony.97
Automatic Adjustment of Left Ventricular Pacing Output
Operating Details
The LV (paced) → RV (sensed) conduction time is determined during cycles of up to eight (atrial synchronous) monoventricular pacing sequences (Fig. 31-21). To enhance accurate measurement of unidirectional ventricular conduction time, this test is initiated approximately 15 bpm above the ventricular rate measured during the rate and stability check. In dual-chamber modes, the pacemaker atrioventricular interval (pAVI) is shortened to 30 msec. These two adjustments are intended to guarantee complete replacement of AV and VV conduction with paced activation. Additionally, the blanking period on the RV sense amplifier is minimized to enhance RV sensing. LV-RV conduction is performed with LV output at the prevailing programmed setting. If RV sensing does not occur in response to a LV-only test stimulus, a backup BV pacing stimulus with LV at maximum amplitude occurs on the following cycle, and LV output remains at maximum amplitude except for single-test cycles.
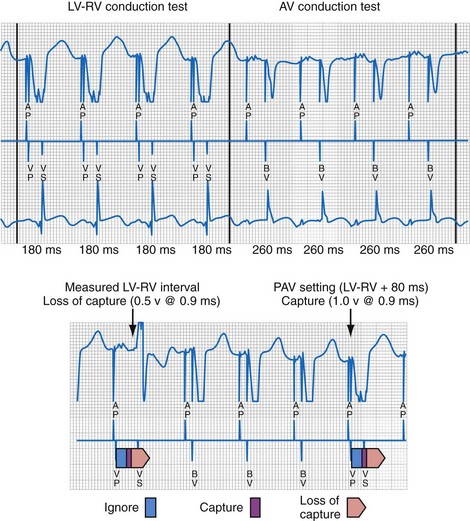
Figure 31-21 Left ventricular capture management (LVCM) operation.
(Modified from Crossley GH, et al: Automated left ventricular capture management. Pacing Clin Electrophysiol 30:1190-1200, 2007.)
If these conditions are satisfied, LVPTS is initiated at the overdrive rate applied during VV and AV conduction tests (tracking modes). In nontracking modes (e.g., VVI/R) the overdrive rate on test cycles depends on the rate of the previous three “support” cycles. Biventricular pacing is initiated in a series of three or more support cycles at programmed ventricular voltage outputs, followed by single monochamber LV pacing “test” cycles (at pAVI 30 msec in dual-chamber modes), with progressively increasing LV output starting at 0.5 V per programmed pulse width below the last measured threshold. Consequently, a single ineffectual monochamber LV paced event resulting in a ventricular pause can occur in each test sequence, which explains the pacing “support” cycles. The LV capture detection window is defined as 30 msec earlier and 20 msec later than the longest observed LV-RV conduction time. LV capture is indicated by RV sense events within the capture window, whereas absent RV sensed events or events outside (either direction) the capture window of 30 msec or longer are interpreted as loss of LV capture. Loss of LV capture is defined as the output voltage in which two thirds of test stimuli fail. Reciprocally, LV capture is defined as the output voltage in which two thirds of test stimuli succeed. The LV capture amplitude threshold is the voltage at which three consecutive test cycles result in capture (see Fig. 31-21). If LVCM is programmed to Adaptive, the programmed Amplitude Safety Margin is added to the determined threshold with an upper limit defined by the Maximum Adapted Safety Margin parameter. If the new threshold has decreased with respect to the previously measured value, the LV amplitude is decreased by 1 programmable value. If the new threshold has increased with respect to the previously measured value, the LV amplitude is set to the measured threshold plus the LV amplitude safety margin. However, if the measured threshold plus the LV amplitude safety margin exceeds the LV maximum adapted amplitude, the LV amplitude is set to the LV maximum adapted amplitude. If a high-threshold condition occurs (e.g., capture is not determined at LV maximum adapted amplitude), LV amplitude is set to LV maximum adapted amplitude.
Clinical Performance
Performance of LVCM has been investigated using downloaded RAMware.98 In 107 patients, 307 LV capture threshold measurement pairs (manual and LVCM) were analyzed. LVCM thresholds were within 1 voltage step of manually determined thresholds for 99.7% of tests (two-sided 95% confidence interval: 98.2, 100.0). Erroneously high LV thresholds were not recorded.
Potential Limitations and Complications
Single-cycle loss of ventricular capture during LVCM threshold determinations create ECG mimicry of pacing inhibition (crosstalk, conductor or insulation failure, EMI)99 (Fig. 31-22). This may not be simply a cosmetic issue. Short-long-short sequences (“pauses”) terminated by single ventricular paced beats have been linked to ventricular tachycardia/fibrillation (VT/VF) onset and constitute a unique form of bradycardia pacing-induced ventricular proarrhythmia.100 It seems likely that an example of VT/VF onset preceded by a short-long-short sequence during LVCM threshold determination will eventually be recorded.

Figure 31-22 Short-long-short sequences (pauses) and pseudo-crosstalk during LVCM operation.
(Modified from Ho R, Mark GE, Rhim ES, Shorrock SM: Pseudo crosstalk behavior in a patient with atrio-ventricular block and implanted biventricular defibrillator. Pacing Clin Electrophysiol 30:1555-1557, 2007.)
Tailoring CRT Programming to Improve Cardiac Mechanics and Maximize Probability of Reverse Volumetric LV Remodeling
Methods to Guarantee Ventricular Electromechanical Resynchronization
The translational mechanism of CRT is ventricular activation wavefront fusion.12,72 Resynchronization of ventricular activation restores part or all of the LBBB-induced impairment in LV mechanics. The immediate consequence is improvement in contractility (pump function),12,13,67,68 followed by reductions in global and regional structural abnormalities (reverse remodeling).83,92,93,101,102
Generating Ventricular Activation Wavefront Fusion during CRT
Analysis of ventricular activation using the standard 12-lead surface ECG accurately predicts the probability of LV reverse volumetric remodeling during CRT in patients with ventricular-asynchronous heart failure and LBBB.72 The probability of reverse remodeling is explained by interactions between substrate conditions and pacing-induced changes in ventricular activation before and after CRT. The main findings are that (1) the translational mechanism for volumetric remodeling is activation wavefront fusion, evident on the paced ECG, and (2) the probability of remodeling is positively influenced by LV conduction delay (maximum left ventricular activation time, LVATmax) and negatively influenced by LV scar volume (QRS score) on the baseline ECG (Fig. 31-23). Longer LVAT and smaller LV scar volume during LBBB on the baseline ECG predict higher probability of reverse modeling (Fig. 31-24). Evidence for activation wavefront fusion on the CRT-paced ECG, indicating conduction defect reversal, also predicts higher probability of reverse remodeling (Fig. 31-25). The framework for analysis of ventricular activation using the 12-lead surface ECG has direct application to CRT programming.
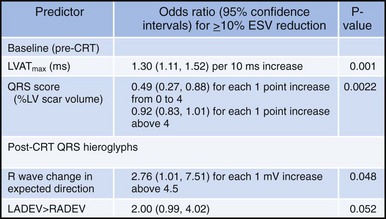
Figure 31-23 Predicting reverse volumetric remodeling during CRT using analysis of ventricular activation on 12 lead surface ECG.
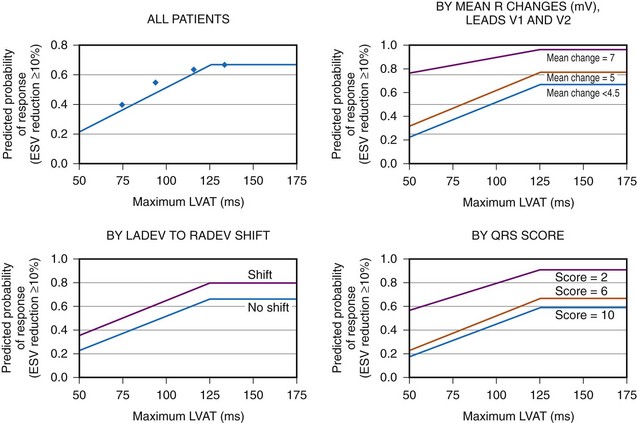
Figure 31-24 Probability of LV reverse remodeling by baseline and post-CRT predictors.
(From Sweeney MO, et al: Analysis of ventricular activation using surface electrocardiography to predict left ventricular reverse volumetric remodeling during cardiac resynchronization therapy. Circulation 121:626-634, 2010.)
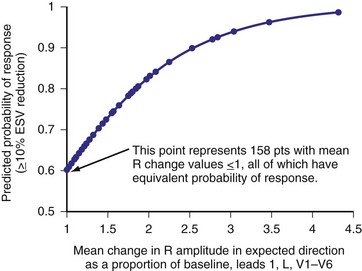
Figure 31-25 Predicting LV reverse remodeling during CRT using a global measure of ventricular fusion.
(From Sweeney MO, et al: Analysis of ventricular activation using surface electrocardiography to predict left ventricular reverse volumetric remodeling during cardiac resynchronization therapy. Circulation 121:626-634, 2010.)
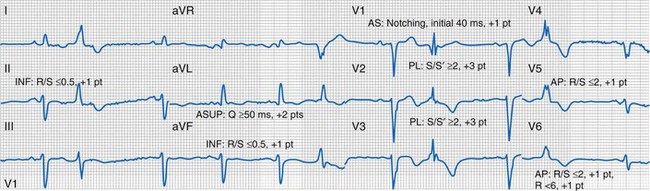
Characterization of Ventricular Activation during LBBB Using QRS Hieroglyphic Analytic Framework Derived from Surface ECG
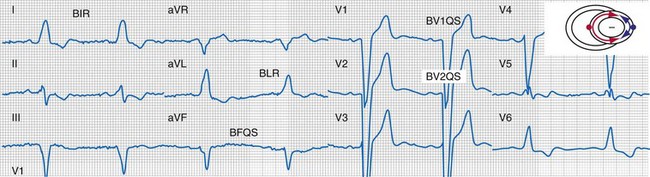
Typical LBBB activation is registered as R → L (frontal plane), A → P (horizontal plane), and variable axis. This yields a QRS hieroglyphic signature with dominant positive forces in I, aVL (R, Rs), negative forces in aVR (QS), variable forces in II, III, aVF (R, Rs, rS, QS), dominant negative forces in V1-V2 (QS, rS), transition V3-V5 (rS→Rs, R), and dominant positive forces in V5-V6 (R, Rs) (Fig. 31-26).
QRS Notching
Left bundle branch block is characterized by sequential ventricular activation (RV → LV)12,18,20 and registered as fragmented QRS complexes with RSR′ configuration (“notch”). QRS notching was defined as 1 notch or more in the R or S wave present in 2 or more adjacent anterior, lateral, or inferior leads103 (Fig. 31-27).
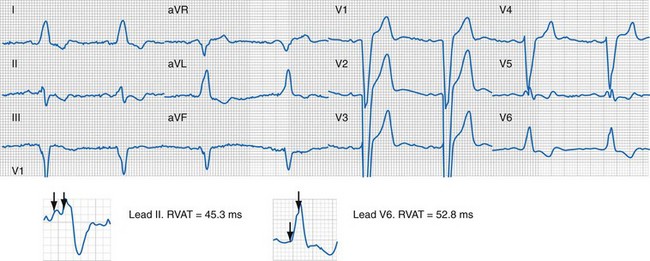
Right and Left Ventricular Activation Time
Because multiple notches in the R and S wave during LBBB may result from myocardial scar,103 the first notch was assumed to indicate the transition between RV and LV depolarization (see Fig. 31-27). Notching in the first 40 msec of the S wave in V1-V2 was excluded because this indicates scar in the QRS score. Right ventricular activation time (RVAT) was measured as time (msec) between QRS onset and first notch in any of two or more adjacent leads. LVAT was QRSd − RVAT (msec).
Quantification of Left Ventricular Scar
Myocardial scar has been linked to reduced CRT response104 (Fig. 31-28). ECG quantification of LV scar volume was calculated using the Selvester QRS score for LBBB.105,106 The effects of scar on LBBB surface registration translate as specific QRS hieroglyphic signatures, manifest as unopposed rightward electrical forces by infarct region: qR, QR, rS in I, aVL (anterior-superior); qR, QR, rS in I, V5-V6 (apical); qR, QR, rS in II, aVF (inferior); QS → rS, RS, or Rs in V1-V2 (anterior-septal). Notching on the ascending limb of the S wave in V1-V2 indicates posterolateral infarct.
Evidence for Ventricular Activation Fusion during CRT
Experimental models of LBBB demonstrate maximum improvement in LV pump function occurs when intra-LV electrical asynchrony is minimized by wavefront fusion12 (see Figs. 31-29 to 31-44). Wavefront opposition and reversal during BiV pacing should yield ECG evidence of fusion: (1) expected change in frontal plane electrical axis (normal or LADEV→RADEV) and (2) expected changes in QRS hieroglyphic signatures. Rightward forces emerge in leads with dominant leftward forces (R in I, aVL → qR, QR, QS). Anterior forces emerge in leads with dominant posterior forces (QS in V1 → rS, RS, Rs, R; QS or rS in V2 → RS, Rs, R; rS or RS V3→ Rs or R, etc).
Figure 31-29 Ventricular activation during monochamber LV pacing from anterior coronary vein.
(Modified from Giudici MC, et al: Electrocardiographic patterns during pacing the great cardiac and middle cardiac veins. Pacing Clin Electrophysiol 30:1376-1380, 2007.)
Figure 31-30 Ventricular activation during middle cardiac vein pacing.
100% of patients had LBBB activation with left superior axis.
(Modified from Giudici MC, et al: Electrocardiographic patterns during pacing the great cardiac and middle cardiac veins. Pacing Clin Electrophysiol 30:1376-1380, 2007.)
Figure 31-31 Ventricular activation during lateral cardiac vein pacing (posterior wall).
100% of patients had RBBB activation with rightward axis.
(Modified from Giudici MC, et al: Electrocardiographic patterns during pacing the great cardiac and middle cardiac veins. Pacing Clin Electrophysiol 30:1376-1380, 2007.)
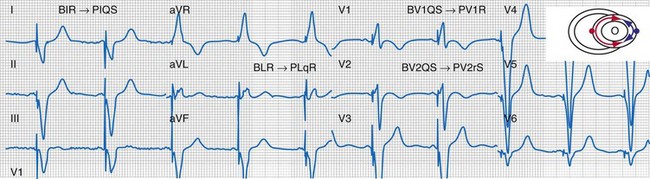
Figure 31-32 Evidence for ventricular activation fusion during CRT.
Same patient as in Figure 31-26. Note the following changes in global ventricular activation as compared to LBBB. R-wave emergence where there were previously S waves; Q, QS, or S wave emergence where there were previously R waves. R waves in leads I (BIR) and aVL (BLR) have been replaced by QS and qR complexes (PIQS and PLqR, respectively); indicating reversal of activation in the frontal plane (L→R). QS waves in V1 (BV1QS) and V2 (BV2QS) have been replaced by R waves (PV1R, PV2rS), indicating reversal of activation in the horizontal plane (P→A). LV activation plot (upper right) indicates fusion (red arrows, RV pacing wavefront; blue arrows, LV pacing wavefront).
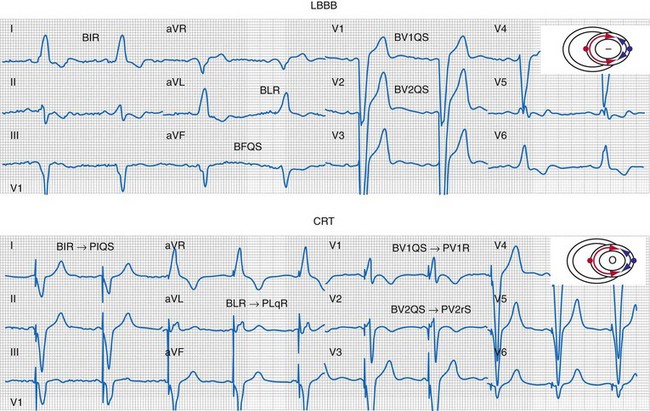
Figure 31-33 Generation of ventricular activation fusion after CRT.
Side-by-side comparison global LV activation during LBBB (top) and post-CRT (bottom). Same patient as in Figures 31-26 and 31-30. Note reversal of activation by regions which yields a global pattern of ventricular activation fusion. This patient had QRS score = 1 (inferior scar), LVATmax = 147 msec, and robust evidence of fusion post-CRT (left → right, posterior → anterior reversal). Predicted probability of ≥10% reduction in ESV at 6 months was 90%, actual ESV reduction was 24%.
(Modified from Sweeney MO, et al: Analysis of ventricular activation using surface electrocardiography to predict left ventricular reverse volumetric remodeling during cardiac resynchronization therapy. Circulation 121:626-634, 2010.)
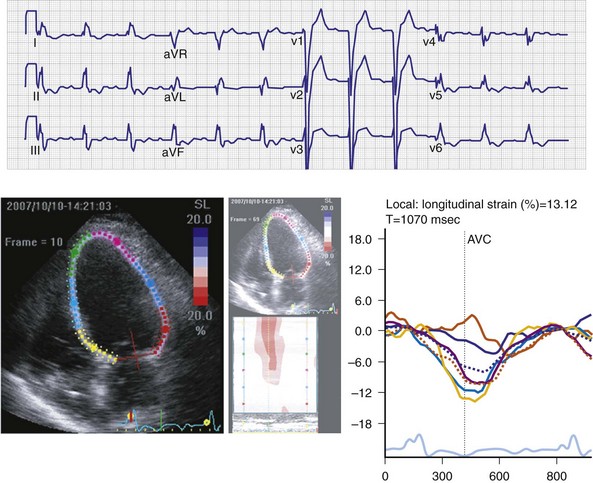
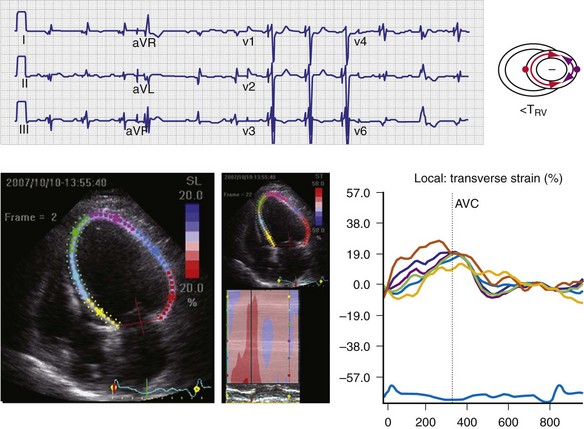
Figure 31-35 Effect of “LV only” LVO pacing on ventricular activation (surface ECG) and LV strain map.
Same patient as in Figure 31-34. Baseline P-R interval is 240 msec. LVO pacing is delivered at atrioventricular delay (AVD) 160 msec. Note changes on the surface ECG indicative of incomplete ventricular fusion. QS in lead V1 has been replaced by rS; R in lead I has been replaced by qR. Frontal plane axis shift has not occurred. Corresponding strain maps demonstrate reduction in posterior wall delay; however, L→R, A→P activation persists.
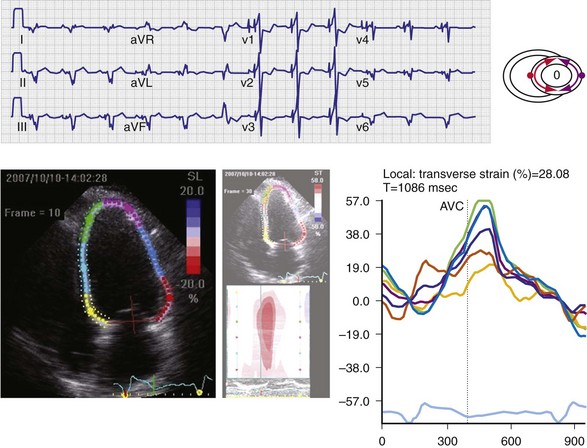
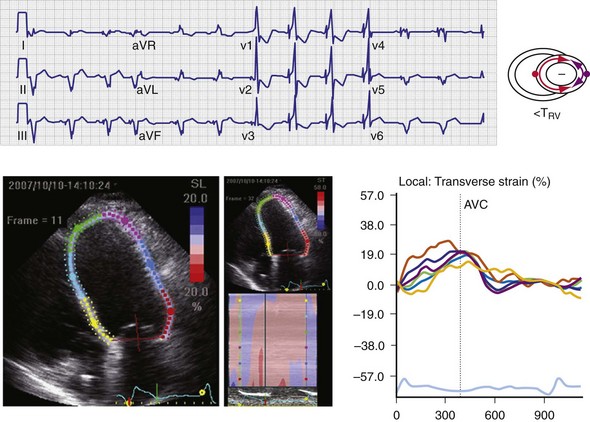
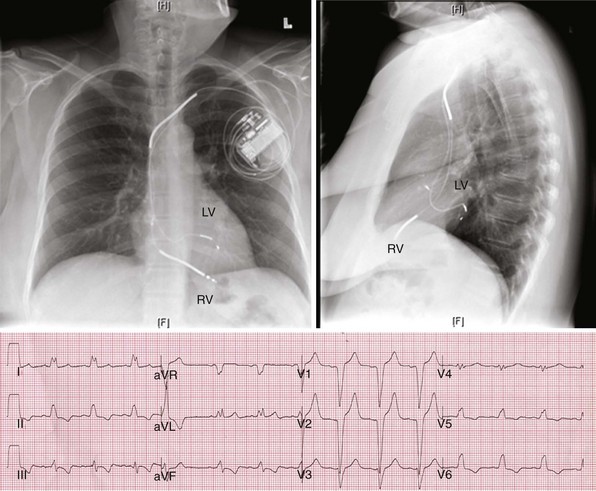
Figure 31-40 Incomplete ventricular activation fusion during simultaneous biventricular pacing.
Top, Intrinsic AVI (P-R interval surrogate) is 160 msec, AVD is 100 msec. Monochamber RV paced → LV sensed = 120 msec; monochamber LV paced → = 120 msec (equivalent sequential ventricular conduction times between pacing sites). Global activation closely resembles monochamber RV activation (see Fig. 31-39, top). Incomplete fusion is indicated by slight QRS narrowing, most evident in leads V1-V3. Overall activation pattern remains R→L, A→P. Bottom, AVD remains fixed at 100 msec. Persistent incomplete fusion despite sequential BiV stimulation with LV 80 msec preceding RV. Minimal change in activation sequence compared to simultaneous BiV pacing. Note slight attenuation of lead I and aVL R, emergence of small monophasic R in V4-V6, and further shortening of QRS duration in V1-V2.
Figure 31-42 Lead positions and baseline LBBB activation.
Same patient as in Figures 31-43 and 31-44. Top, Radiographs of RVA and LV posterior wall (lateral coronary vein) stimulation sites. Bottom, Typical R → L (frontal), A → P (horizontal) activation sequence during LBBB.
Top, Simultaneous biventricular (BiV) pacing. Global activation closely resembles monochamber right ventricular (RV) activation (see Fig. 31-43, top). Incomplete fusion is indicated by slight attenuation of the dominant component of lead I rS, lead aVL R, and slight QRS narrowing, most evident in leads V1-V2. Note that dominant R in V1-V2 (present during monochamber RV and LV pacing) persists. Bottom, Sequential BiV pacing with LV 60 msec preceding RV. Activation directionality is reversed in multiple leads. Note BIQS → PI qRs, BaVLR → PAVL qR, BII, aVF, III QS → PII, aVF, III rS. Note emergence of Rs in V3-V5.
Monochamber LV pacing generates specific ventricular activation patterns generally in accordance with stimulation site (see Figs. 31-29 to 31-31). Anterior vein stimulation most often results in LBBB activation sequence; infrequently, very proximal sites in the anterior vein yield RBBB activation. Middle cardiac vein stimulation always results in LBBB activation sequence, duplicating RVA pacing. Lateral cardiac vein (posterior wall) typically results in complete reversal of the LBBB activation sequence (e.g., RBBB, rightward axis).
However, nearly identical ECG activation sequences may be registered at widely spaced sites,107 and electrical resynchronization during CRT correlates unpredictably with stimulation site because of conduction blocks.20 For these reasons, knowledge of specific LV stimulation site is not relevant to this approach for generating evidence of ventricular activation fusion, which emphasizes changes in ventricular activation indicated by analysis of QRS hieroglyphic patterns.
CRT Programming to Generate Maximum Evidence of Ventricular Activation Fusion
As discussed previously, optimal ventricular resynchronization occurs when the wavefronts from the RV pacing site (or originating from RBBc) and the LV pacing site collide halfway78 (see Fig. 31-10). Experimental and human evidence indicates that optimal hemodynamic effect can be achieved using LV pacing at certain atrioventricular delays (AVDs) as well as using simultaneous and sequential BiV pacing, because fusion of electrical wavefronts can be achieved by either approach13,79 (see Figs. 31-32 and 31-33; see also Fig. 31-11).
The interaction among AVD, VV timing, and generation of activation fusion is most easily understood during “LV only” (LVO) pacing (see Fig. 31-34). In this situation, ventricular activation is controlled by fusion between LV pacing and RBBB conduction. The P-R interval is a surrogate for left-sided AV timing. Any AVD shorter than the baseline P-R interval will advance LV activation. Partial correction of LV conduction delay at a relatively long AVD < PR is registered on the surface ECG as incomplete ventricular fusion and delayed time to peak strain on the posterior wall relative to septum (see Fig. 31-35). Complete correction of LV conduction delay at shorter AVD is registered as ventricular activation fusion and synchronization of time to peak strain between septum and posterior wall (see Fig. 31-36). Overcorrection of LV conduction delay (complete reversal of activation) at even shorter AVD is registered as L → R, P → A activation on the surface ECG and delayed time to peak strain on the septum relative to posterior wall (see Fig. 31-37).
More often, CRT is delivered with biventricular pacing. In this situation, evidence for generation of ventricular activation fusion on the surface ECG consists of two pacing wavefronts with unique ECG signatures. Certainty regarding maximal ventricular activation fusion during BiV pacing therefore requires characterization of ventricular activation during monochamber RV and LV pacing (see Figs. 31-19 and 31-20). This is most accurately accomplished in the ventricular-only pacing mode at a rate exceeding the prevailing ventricular rate, so as to eliminate the possibility of fusion with native activation. Once the ECG signatures of monochamber RV and LV pacing have been characterized, simultaneous BiV pacing is initiated at an AVD sufficiently short to preempt native ventricular activation (e.g., 50% of baseline P-R interval). This allows complete control of ventricular activation timing by replacing intrinsic activation with paced activation. Since LV activation is always delayed relative to RV activation during LBBB, and the pacemaker AVD is recorded between the right atrium and right ventricle, shortening the AVD advances the LV activation and titrates the dose of resynchronization. Further advancement of LV activation is possible with sequential ventricular stimulation. The ECG is then examined for evidence of activation fusion using a similar QRS analytic architecture as previously described.
Occasionally, maximal attainable sequential ventricular stimulation does not achieve ventricular activation fusion, even when the AVD is substantially shorter than the P-R interval. In this situation, further shortening of the AVD is necessary to advance the LV activation sufficiently and achieve maximal evidence of ventricular activation fusion (see Figs. 31-38 to 31-41). In this manner, the AV delay and V-V interval display a necessary and logical interaction as control parameters for ventricular activation timing.
Generally, RVA pacing produces a ventricular activation sequence that duplicates the QRS hieroglyphic signature of LBBB. Under these conditions, typical changes in frontal plane axis and QRS hieroglyphs indicative of ventricular activation fusion are observed (see Figs. 31-29 to 31-32). Occasionally, atypical ventricular activation patterns occur during monochamber RVA and LV pacing and confound the typical QRS hieroglyphic signature for ventricular activation fusion during BiV pacing (see Figs. 31-42 to 31-44). In this situation, typical QRS glyph changes in the expected direction during BiV pacing are not observed. Evidence for ventricular activation fusion must therefore rely on the principle of “activation wavefront reversal” in pivotal leads. The use of a global measure of activation fusion is particularly useful in this situation (see earlier) because this eliminates directionality, which can be confounded by atypical pacing activation patterns, in favor of magnitude of change opposite the initial forces in pivotal ECG leads.
Methods to Guarantee Optimal Atrioventricular Resynchronization
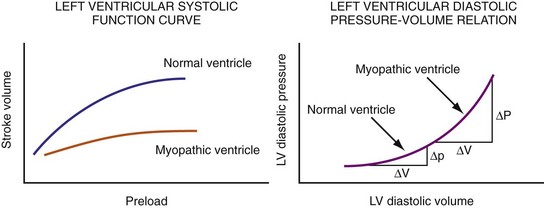
Figure 31-45 Different effects of change in loading conditions in normal and failing ventricles.
(Modified from Marcus RH, Harry MJ, Lang RM: Pacemaker therapy in refractory heart failure: a systematic approach to electromechanical optimization of diastolic function. JACC Cardiovasc Imaging 2:908-913, 2009.)
Effects of Pacemaker Atrioventricular Interval on Loading Conditions, Diastolic Function, and Systolic Function
The events of the cardiac mechanical cycle are again displayed in Figure 31-46. Ventricular filling occurs during diastole and has two components: early passive filling (E wave) and later active filling (A wave). The velocity of the diastolic filling waves is determined by the LA-LV transmitral pressure (TMP) gradient, which is phasic. The timing of the E wave is controlled by the preceding ventricular contraction. The timing of the A-wave is fixed by the sinus rate (or atrial pacing rate). The timing of the E wave relative to the A wave is influenced by the preceding ventricular contraction and the AV conduction time (e.g., P-R interval).
Diastolic function is impaired in asynchronous heart failure. The left ventricle operates at higher diastolic pressures with the consequence that filling times are shortened (Fig. 31-47). Ventricular conduction delay and reduced pump function result in prolonged isovolumetric contraction and relaxation times, which shorten diastole (Fig. 31-48). These derangements worsen at the higher heart rates typically observed in heart failure patients.
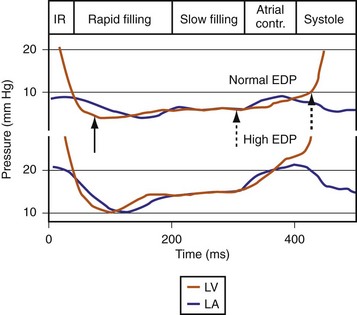
Figure 31-47 Diastolic events and pressure gradients under different loading conditions.
(Modified from Nagueh et al: Recommendations for the evaluation of left ventricular diastolic function by echocardiography. J Am Soc Echocardiogr 22:107-133, 2008.)
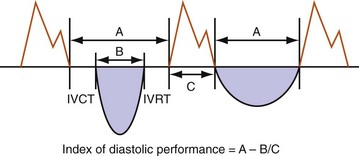
Figure 31-48 Effect of increased contraction/relaxation times on diastolic function in failing ventricle.
(Modified from Marcus RH, Harry MJ, Lang RM: Pacemaker therapy in refractory heart failure: a systematic approach to electromechanical optimization of diastolic function. JACC Cardiovasc Imaging 2:908-913, 2009.)
On the standard echocardiogram, LV inflow velocities are used to characterize diastolic function. Characteristic changes in mitral inflow are observed in response to changes in the TMP gradient (Fig. 31-49). The mitral E-wave velocity is determined by the early-diastolic LA-LV pressure gradient and reflects preload and alterations in LV relaxation. The mitral A-wave velocity is determined by late-diastolic LA-LV pressure gradient and reflects LV compliance (pressure-volume relationship) and LA contractile function. E-wave deceleration time reflects LV relaxation, LV diastolic pressures, and LV compliance.
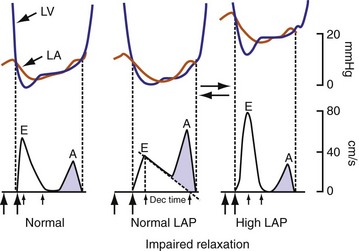
Figure 31-49 Changes in LV inflow velocity patterns in response to changes in transmitral pressure gradient.
(Modified from Nagueh, et al: Recommendations for the evaluation of left ventricular diastolic function by echocardiography. J Am Soc Echocardiogr 22:107-133, 2008.)
Changes in preload modify the echocardiographic patterns of diastolic function (Figs. 31-50 and 31-51). In the normal pattern, the majority of forward flow occurs in early diastole, yielding E/A ratio greater than 1.5 and short E-wave deceleration time (<180 msec) and isovolumetric relaxation time (<80 msec). Incomplete relaxation caused by myocardial disease results in higher early-diastolic LV pressures and reduced TMP gradient. Consequently, E-wave velocity and E/A ratio decrease (<1), and isovolumetric relaxation time (>90 msec) and E-wave deceleration time (>220 msec) increase (stage I diastolic dysfunction, relaxation abnormality). The compensatory response to maintain LV filling is an increase in LA pressure, resulting in higher E-wave velocity and E/A ratio. Stage II diastolic dysfunction is characterized by E/A more than 1, isovolumetric relaxation time less than 90 msec, and deceleration time less than 220 msec, termed pseudonormalization. Progression of diastolic dysfunction is indicated by a restrictive filling pattern, characterized by E/A over 1, isovolumetric relaxation time under 70 msec, and deceleration time under 150 msec, termed restrictive (stage III). A restrictive LV inflow pattern unresponsive to preload reduction is termed irreversible (stage IV). Stages II to IV are associated with increased LV filling pressures.
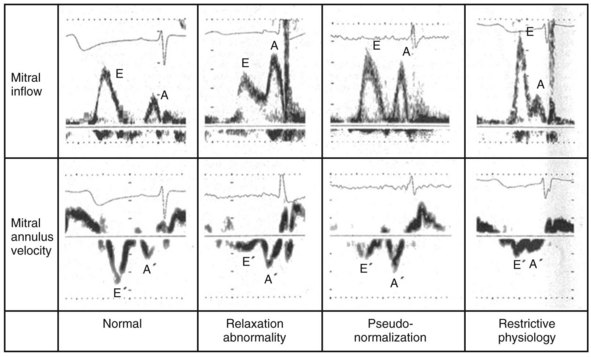
Figure 31-50 Echocardiographic filling patterns of diastolic dysfunction.
(Modified from Swedberg K, et al: Guidelines for the diagnosis and treatment of chronic heart failure: executive summary (update 2005). Eur Heart J 26(11):1115-1140, 2005.)
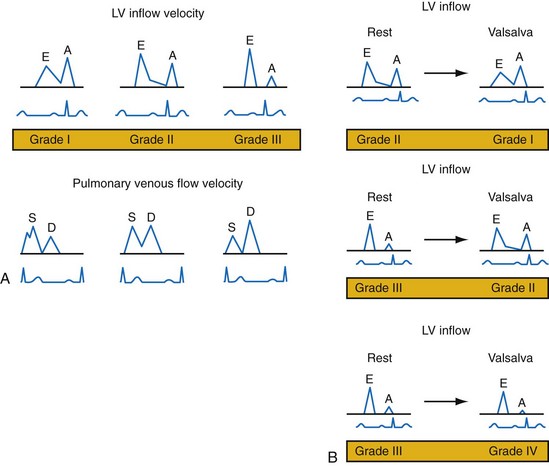
Figure 31-51 Echocardiographic patterns of diastolic function before and after preload reduction.
A, LV inflow velocity patterns as described in Figure 31-49. Pulmonary venous flow is determined by the pressure gradient between the pulmonary veins and the left atrium. Systolic forward flow (S) occurs during LA relaxation, diastolic forward flow (D) follows early LV filling. During LA contraction in late diastole, flow reversal into the pulmonary veins occurs (not shown). Increased early diastolic filling pressure results in decreased systolic flow and increased diastolic flow in the pulmonary veins. B, Response of diastolic filling patterns to preload reduction (Valsalva maneuver). Reduced preload results in reduced E-wave velocity and prolongation of E-deceleration time, whereas A-wave velocity is unchanged or increases. A ≥50% decrease in E/A ratio with Valsalva maneuver is highly specific for increased LV filling pressures. Failure of the LV inflow pattern to change with preload reduction is indicative of severe diastolic dysfunction (stage IV, irreversible).
(Modified from Marcus RH, Harry MJ, Lang RM: Pacemaker therapy in refractory heart failure: a systematic approach to electromechanical optimization of diastolic function. JACC Cardiovasc Imaging 2:908-913, 2009.)
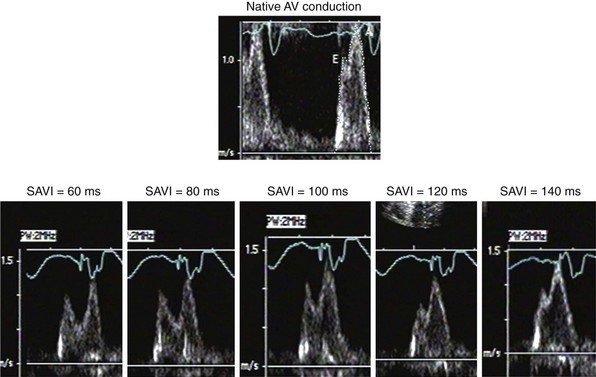
The response of these LV inflow velocity patterns to preload reduction can be used to understand the relationship between diastolic function and changes in pacing rate and pAVI. Higher pacing rates combined with delayed isovolumetric relaxation time result in fusion of early and late LV filling, simulating stage III (restrictive) diastolic dysfunction (Fig. 31-52). Reduced pacing rates delay atrial contraction, displace late LV filling relative to delayed early filling, and increase diastolic filling time.
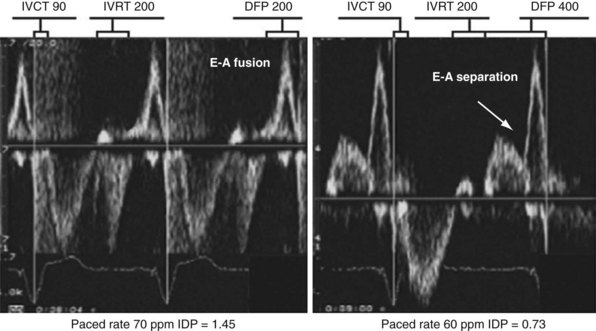
Figure 31-52 Effect of change in pacing rate on diastolic function.
Left, Pacing rate 70 pulses per minute (ppm). Prolonged IVRT results in delayed early filling resulting in E-A fusion. This simulates a stage III (“restrictive”) filling diastolic pattern. Right, Pacing rate 60 ppm. E wave is tied to prior ventricular contraction; A wave is now displaced rightward in time; consequently, diastolic filling periods increase from 200 → 400 msec, and E-A separation emerges (stage III → stage I diastolic dysfunction). Note index of diastolic function decreased from 1.45 → 0.73 (reflecting increase in C term in equation in Fig. 31-48).
(Modified from Marcus RH, Harry MJ, Lang RM: Pacemaker therapy in refractory heart failure: a systematic approach to electromechanical optimization of diastolic function. JACC Cardiovasc Imaging 2:908-913, 2009.)
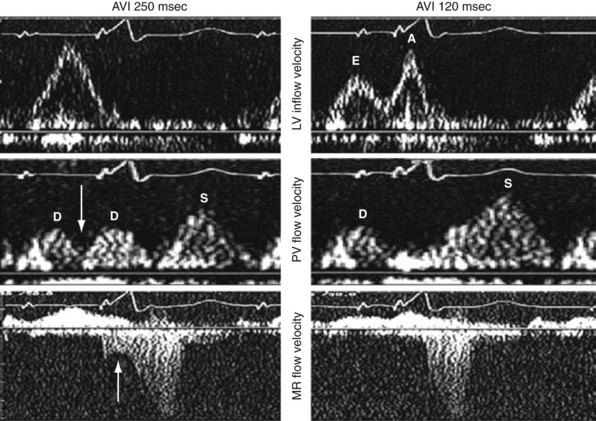
Inappropriately short pAVIs result in truncation of late-diastolic active LV filling, indicated by minimization of the A-wave velocity, simulating stage III diastolic dysfunction. In extreme cases, atrial transport block and pulmonary flow reversal can occur. Increases in pAVI increase diastolic filling time, allowing for emergence of late-diastolic active LV filling (A-wave velocity emergence) and transformation to stage II diastolic dysfunction in this example (Fig. 31-53). In extreme cases, atrial transport block and pulmonary flow reversal can occur, triggering counterphysiologic neurohormonal responses (Fig. 31-54).
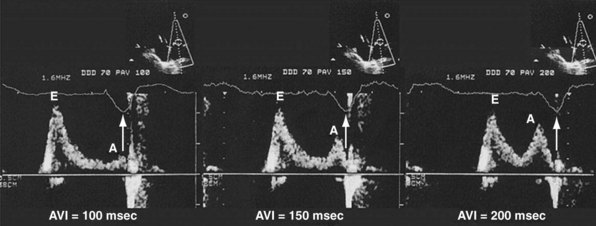
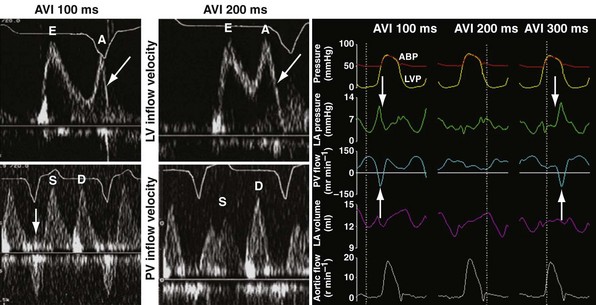
Figure 31-54 Atrial transport block caused by inappropriately short pacemaker AVI.
(Left and middle panels modified from Marcus RH, Harry MJ, Lang RM: Pacemaker therapy in refractory heart failure: a systematic approach to electromechanical optimization of diastolic function. JACC Cardiovasc Imaging 2:908-913, 2009; right panel courtesy Douglas Hettrick, PhD, Minneapolis.)
Inappropriate long pAVIs result in collision of early and late diastolic filling (Figs. 31-54 and 31-55). The physiologic consequences are identical to first-degree AV block. Early passive diastolic filling collides with late active filling because the atrial contraction is displaced leftward in time relative to the next ventricular paced beat. Increase in left atrial (LA) pressure with atrial contraction interrupts pulmonary vein diastolic forward flow; late-diastolic LV → LA pressure gradient results in diastolic mitral regurgitation. In extreme cases, atrial contraction occurs during the preceding ventricular contraction, resulting in atrial transport block. This duplicates the situation of inappropriate short pAVI. A shorter pAVI moves early LV filling leftward (earlier) in time, since the E wave is “tied” to the prior ventricular contraction. This has the effect of separating the E wave and the oncoming A wave, which is fixed to atrial systole.
Approaches to Atrioventricular Resynchronization
Conventional Echocardiography
Left Ventricular Inflow Analysis
According to the method of Ritter et al.,108 optimal pacemaker AVI during atrial sensing (SAVI) can be stated algebraically as: SAVIoptimal = SAVIshort + d, where d = (SAVIlong + QAlong) − (SAVIshort + QAIshort), Q = ventricular pacing stimulus, and A = termination of A wave.109 This process is performed in three steps, as follows:
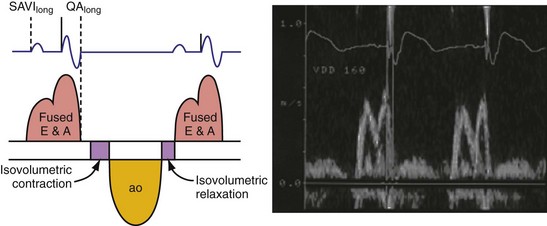
Figure 31-58 Ritter method for AV resynchronization: step 3.
Calculation of SAVIoptimal. Note restoration of normal E-A wave separation.
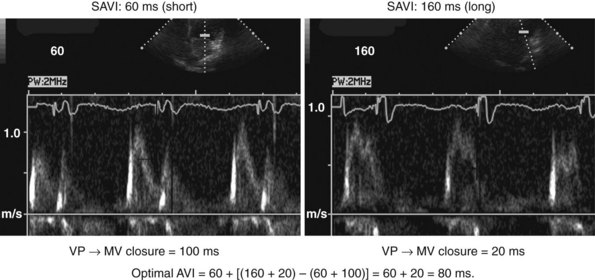
Figure 31-60 summarizes an example of this approach.
Meluzin et al.110 described a “simplified” two-step approach to the Ritter method. First, a “long” sensed AVI that results in (a) ventricular capture without fusion of native conduction and (b) spontaneous closure of the mitral valve before LV ejection is selected. The time between the end of the A wave (representing the end of the diastolic filling period) to the time of onset of high-velocity systolic mitral regurgitation (representing the onset of ventricular contraction) is recorded. Second, the time from the end of the A wave to the onset of low-velocity diastolic mitral regurgitation is denoted as t1. The optimal AVI is then calculated as the “long” AVI-t1. This approach accurately predicted the optimal AVI based on simultaneous invasive hemodynamic measurements in 78% of patients. Similar limitations as the Ritter method apply; also, at least mild mitral regurgitation is required for timing measurements.
The Ritter method is a tedious process. The value of quantification using the Ritter “formula” is unclear. A similar result could be achieved by simply manipulating the pAVI across a range of values while examining the LV inflow velocity pattern until E-A wave separation unaccompanied by A-wave truncation is observed (see Fig. 31-58). Although many published clinical investigations cite the “Ritter method” for AV resynchronization, only visual analysis of the LV inflow pattern was likely performed (e.g., algebraic calculations were omitted). As with all methods for AV synchronization using visual analysis of LV inflow patterns, subjective error is common because the terminal portion of the A wave is often difficult to discern. The Ritter method was developed for AV resynchronization in complete AV block and during monochamber RV pacing. Ventricular conduction is entirely different during biventricular pacing.
However, a potentially more serious problem with the Ritter and related methods is the fundamental assumption that timing ventricular contraction to the terminal portion of the A wave optimizes preload; this appears to be physiologically incorrect in the setting of heart failure with low ejection fraction. Insights regarding optimal AV resynchronization in the failing ventricle are generated by invasive hemodynamic studies that use the acute response of aortic pulse pressure, or LV +dP/dtmax, which are useful indices because they correlate with stroke volume and global contractile function. These studies indicate that the maximum acute improvement in LV pump function occurs when the left-sided atrioventricular mechanical latency (AVL) time is closest to zero (Fig. 31-61). This corresponds to the time of peak velocity of the A wave. Timing the onset of LV contraction to the end of LA emptying (e.g., A-wave termination, Ritter method) results in delayed AVL time and reduced hemodynamic response. As mentioned previously, the Ritter method was developed in pacemaker patients with normal LV function and AV block, a situation where LV pressure and volumes are low and compliance is high. However, in the failing ventricle, LV pressures and volumes are high and compliance is low (see Fig. 31-45). Consequently, onset of LV contraction at the highest point of LA pressure generation may be necessary for maximum hemodynamic improvement.
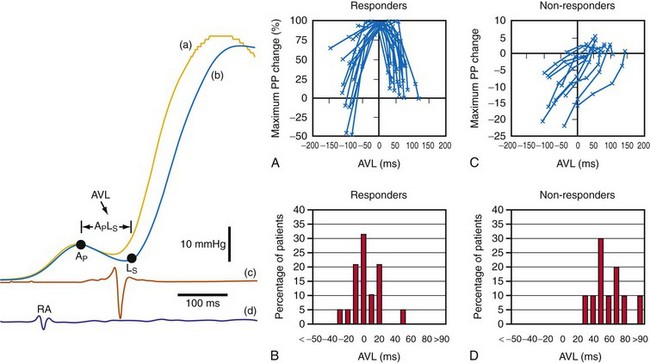
Figure 31-61 Optimal AV resynchronization using invasive hemodynamic monitoring.
(From Auricchio A, et al: Long-term clinical effect of hemodynamically optimized cardiac resynchronization therapy in patients with heart failure and ventricular conduction delay. J Am Coll Cardiol 39:2026-2033, 2002.)
With techniques for AV optimization using invasive LV pressure monitoring, some evidence indicates that acute hemodynamic response to CRT predicts better outcomes.68,77,111 However, pulse pressure and LV +dP/dt can be confounded by changes in preload and afterload. Although this technique is useful for assessing the acute effects of manipulating critical pacing control parameters, ventricular stimulation sites, and ventricular sequencing on LV pump function, it is impractical for routine clinical care.
Left Ventricular Outflow Analysis
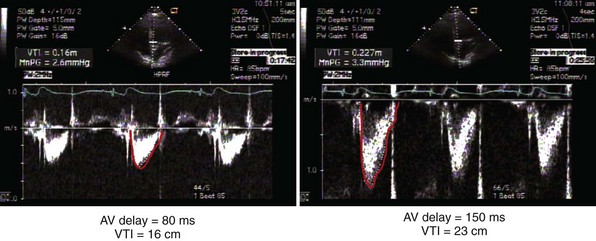
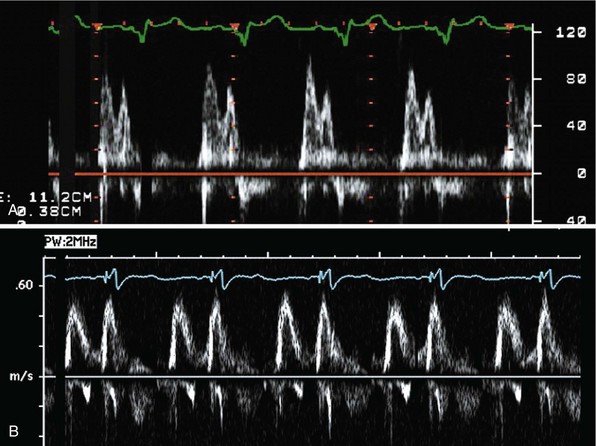
Measurement of the continuous-wave Doppler aortic velocity time integral (VTI) provides an estimate of stroke volume (Figs. 31-62 and 31-63). Changes in loading conditions during manipulation of critical pacing control parameters can be registered as increases or decreases in stroke volume. This approach is often applied during manipulation of the pAVI. A range of pAVIs is scanned, and the optimal interval is the pAVI that generates the largest increase in aortic VTI (stroke volume).
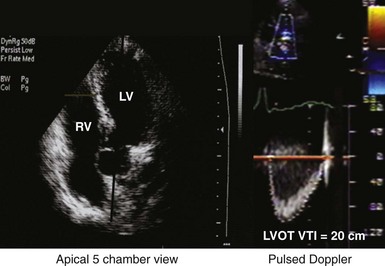
Figure 31-62 Doppler aortic velocity time integral for estimating stroke volume during manipulation of the pacemaker AVI.
Noninvasive Hemodynamic Monitoring
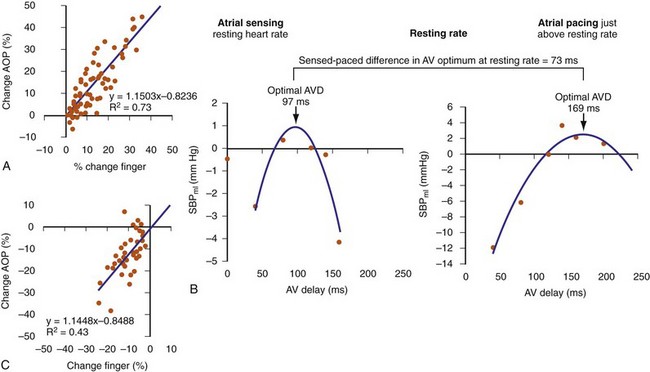
Finger photoplethysmography (FPPG) has been used as a surrogate to invasive hemodynamic monitoring for optimizing AV resynchronization (Fig. 31-64). FPPG accurately tracks beat-to-beat changes in arterial pulse pressure at rest and during exercise and therefore provides an attractive alternative to direct LV pressure recordings. At rest, FPPG correctly identified positive aortic pulse pressure responses with 71% sensitivity and 90% specificity compared to invasive aortic pressure recordings, and the magnitude of FPPG changes in response to manipulation of the pAVI during CRT was well correlated with positive aortic pulse pressure changes (R2 = 0.73; see Fig. 31-64).112 However, the correlation with negative aortic pressure changes was poor (R2 = 0.43). FPPG identified 78% of the patients having positive aortic pulse pressure changes in response to manipulation of the pAVI and identified the single pAVI that yielded the maximum increase in pulse pressure in all patients. Maximum increase in systolic blood pressure using FPPG has been used to identity the optimal pAVI during rest and exercise and duplicates the parabolic relationship observed in acute hemodynamic studies.113
Electrogram Analysis
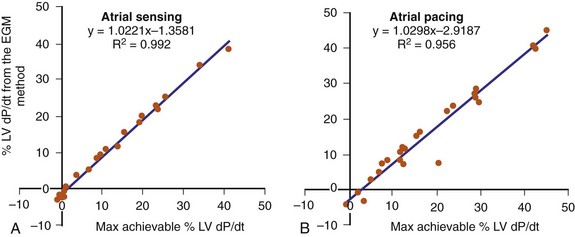
The optimal pAVI for AV resynchronization can also be estimated using an EGM-based approach (Fig. 31-65). This is derived from timing observations made during invasive determination of the acute hemodynamic response (maximal positive change in LV +dP/dt) during manipulation of the pAVI. The single pAVI that generates the largest acute increase in LV +dP/dt is derived from the iAVI (time from local RA → local RV EGM) using two linear equations that incorporate baseline ventricular conduction delay (QRSd).114 If QRSd > 150 msec, the estimated optimal pAVI = 0.7*iAVI (msec) − 55 msec; if QRSd is 120 to 150 msec, the estimated optimal pAVI = 0.7*iAVI (msec). These regression formulas can be closely approximated by the following simple rules: the estimated pAVI for patients with QRSd > 150 msec is 50% of iAVI (P-R interval) and 75% for QRSd of 120 to 150 msec. These equations reflect the logical and necessary relationship between pAVI and ventricular conduction delay described earlier. This EGM method showed strong correlation (P <.0001) between maximum % increase in LV +dP/dt and maximum achievable % increase in LV +dP/dt during conditions of atrial sensing (R2 = 0.99) and atrial pacing (R2 = 0.96)115 (Fig. 31-66). This strategy for programming pAVI was employed in the Comparison of Medical Therapy, Pacing, and Defibrillation in Heart Failure (COMPANION) trial116 and has been automated in one device-based application (SmartDelay, Boston Scientific; see later).
Comparison of Methods for Optimizing AV Resynchronization
A direct comparison of the aortic VTI versus mitral inflow pattern method, using maximum increase in VTI as the endpoint, reported superiority of the aortic VTI method (58% greater relative increase, ~7% greater absolute increase in maximum LV stroke volume).117 The optimal pAVI predicted by the mitral inflow method was significantly shorter than the VTI method. A similar conclusion was reached in a comparison of the aortic VTI and mitral inflow methods using invasive hemodynamic measurements.118 In this study the maximum increase in LV +dP/dt showed good correlation with the mitral inflow (E-A) VTI (r = 0.96), poor correlation with the aortic VTI method (r = 0.54), and no correlation with the mitral inflow method (r = 0.35). It is argued that the aortic VTI method performs better than the mitral inflow method because it titrates a measure of LV ejection, whereas the mitral inflow method titrates a measure of LV filling. Using invasive hemodynamic monitoring, the EGM method was shown to yield the least difference between % LV +dP/dt and maximum achievable % LV +dP/dt during conditions of both atrial sensing and atrial pacing, compared with arbitrary pAVIs (100, 120, 140, 160 msec) or “best” pAVIs determined by the mitral inflow method or aortic VTI method.115
More importantly, no single method of AV resynchronization has demonstrated convincing clinical superiority, such as reduction in heart failure hospitalization or reductions in LV end-systolic volume (ESV) (reverse remodeling), although minimal prospective evaluation of any of these methods has been made. A randomized single-blind study of 40 patients compared the optimal pAVI determined by largest increase in aortic VTI against an empiric pAVI of 120 msec.80 A small improvement in ejection fraction, NYHA functional class, and quality of life scores were observed in the VTI-optimized group. These differences were probably spurious, because the mean-VTI optimized pAVI and the empiric pAVI were almost identical (119 vs. 120 msec, respectively). Individual patient variation may have accounted for the slight differences in outcomes between groups.
Using variations on the mitral inflow method or invasive hemodynamic monitoring, the optimized pAVI is almost invariably in the range of 80 to 110 msec, regardless of other considerations.68,111,116,119,120 Therefore, some have argued empiric programming of the pAVI at about 100 msec. Further, the optimal pAVI varies with heart rate, loading conditions, and atrial pacing versus sinus rhythm.
Atrial Pacing/Pacemaker AVI Interaction: Loading Conditions and Diastolic/Systolic Function
A further complication is the effect of autonomic innervation of the AV node during atrial pacing. Atrioventricular intervals during atrial pacing shorten during exercise and lengthen by as much as 150% in the standing or supine position.121 A mismatch between the lower pacing rate and autonomic balance may contribute to this situation. For example, patients with a relatively high lower rate programmed (70 or 80 bpm) often experience significant AVI extensions during atrial pacing while sleeping because of parasympathetic predominance.7
This can be understood by analysis of atrial and ventricular activation times using the surface ECG and local electrograms (EGMs) (Figs. 31-67 to 31-73). P-wave duration represents total atrial activation time (AAT) (see Fig. 31-67). The earliest deflection of the P wave indicates the onset of RA activation (A). It is assumed that the latest termination of the P wave represents the end of LA electrical activation (B). Therefore, the AAT is measured as time interval A → B. Interventricular conduction delay (bundle branch block, BBB) results in sequential ventricular electrical activation. This is typically registered on the surface ECG as a “split” or “notched” QRS complex. The notch indicates the transition point between sequential monoventricular electrical activation. The portion of the QRS that occurs before the notch is composed of the first chamber activated, whereas the portion of the QRS that occurs after the notch consists of the second (delayed) chamber activated. The earliest first upstroke of the LBBB QRS indicates the onset of RV activation (right bundle branch, RBB) conduction (C in Fig. 31-67). The earliest first notch in the QRS indicates the transition point between the end of RV activation and the onset of LV activation caused by LBBB (D). The latest return of the QRS complex to baseline in any ECG lead indicates the termination of delayed LV activation from LBBB (E).72
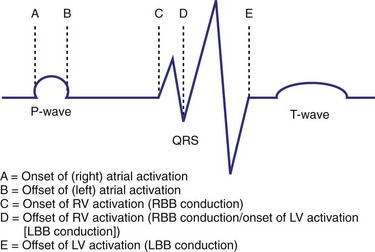
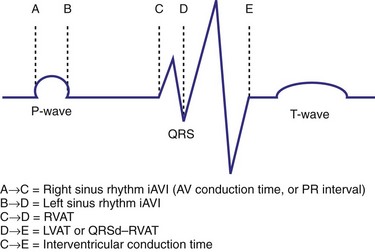
Figure 31-68 Calculation of intrinsic atrial-ventricular electrical activation times on surface ECG.
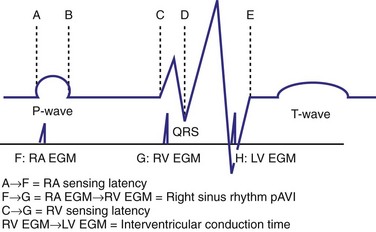
Figure 31-69 Atrial-ventricular activation time by surface ECG and local EGM timing during sinus rhythm.
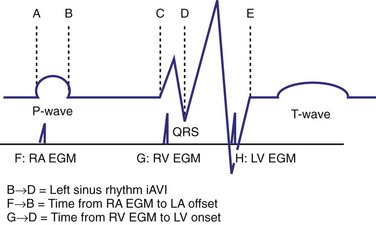
Figure 31-70 Differences in right-sided AV timing using local EGMs and left-sided AV electrical timing on surface ECG.
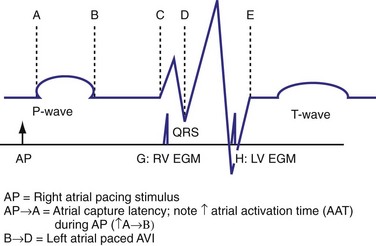
Figure 31-71 Effect of right atrial pacing on estimation of left-sided AV timing by local EGM timing.
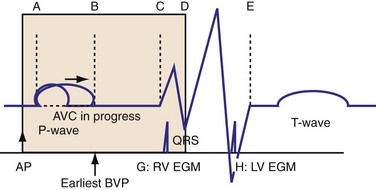
Figure 31-72 Effect of right atrial pacing on left AV electromechanical timing during biventricular pacing (BVP).
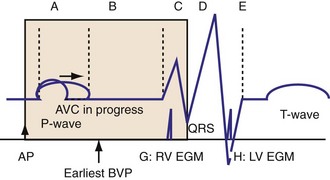
The time from P-wave onset to the first upstroke of the QRS (onset of RV activation from RBB conduction) indicates the right intrinsic AVI (iAVI) (A→C), which is the AV conduction time estimated by the P-R interval (see Fig. 31-68). The time from P-wave offset (LA activation offset) to the earliest notch in the QRS (LV activation onset) indicates the left iAVI (B→D). Time from QRS onset to first notch is RV activation time (RVAT, C→D); time from first notch to QRS offset is LV activation time (LVAT, D→E); time from QRS onset to offset is interventricular conduction time (C→E).
The effects of capture and sensing latency on local EGM timing relative to onset of electrical activity on the surface ECG are shown in Figure 31-69. The time from the earliest deflection of the P wave (RA activation onset) to the time of local RA EGM during sinus rhythm (atrial pacing-inhibited) is the RA sensing latency time (A→F). The time from earliest upstroke of the QRS (RV activation onset due to RBB conduction) to the time of the local RV EGM is the RV sensing latency time (C→G). The time from the local RA EGM to the local RV EGM is the right sinus rhythm pAVI, which is the EGM-based surrogate of the minimum right sinus rhythm iAVI (A→C). Therefore, at the atrioventricular level, because of RA and RV sensing latency, the right sinus rhythm pAVI and the true right sinus rhythm iAVI (indicated by surface activation timing) are not the same. The right sinus rhythm pAVI may be longer or shorter than the true right sinus rhythm iAVI. Similarly, at the ventricular level, the local EGM surrogate of the total interventricular activation time (C→E) is the time from local RV EGM to the local LV EGM (G→H). This inaccurately estimates true interventricular activation time because of (1) RV sensing latency, (2) LV sensing latency, and (3) variable timing of LV EGM relative to QRS offset, as determined by LV lead position. Also, because current CRT systems do not directly measure the offset of LV activation or the onset of earliest LV activation, right-sided EGM timing does not accurately reflect left-sided electromechanical activation (see Fig. 31-70). These effects are important because device timing instructions are EGM based, and EGM timing may be dissociated from the true onset and offset of electromechanical activation in the chamber of interest. This introduces the possibility of cross-chamber and multichamber timing errors that could negatively influence pump function.
The effects of right atrial pacing on multichamber timing can be understood with this framework (see Fig. 31-71). Atrial capture latency is the time from emission of the atrial pacing stimulus (AP) to the earliest deflection of the P wave (RA activation). Note the increase in AAT (A→B) during AP because of intra-atrial and interatrial conduction delay. The atrial paced pAVI is measured from the time the atrial pacing stimulus is emitted to the onset of native or paced ventricular activation. During native AV conduction, the RA paced AVI (pAVI) exceeds the true right AV conduction time by a factor equal to atrial capture latency and RV sensing latency. Note that the LA paced AVI (pAVI) is shorter than the left sensed iAVI (e.g., ↓B→D) because of the increased AAT during RA pacing, assuming no increase in AV conduction time (A→C). The consequence is that during RA pacing, the true right-sided AV electromechanical timing relationship is overestimated by local EGM timing, and the true left sided AV electromechanical timing relationship is unpredictably shortened.
The effects of RA pacing on left-sided AV electromechanical timing during biventricular pacing are shown in Figure 31-72. In this situation, the timing of ventricular contraction is controlled by the pAVI. The pAVI must be shorter than the time from RA activation to earliest LV activation (A→D), to advance delayed LV activation. Therefore, AP→G is the longest pAVI that will advance LV activation, whereas AP→B is the shortest permissible pAVI to prevent A-wave truncation. However, the values of AP→A, A→B, and G→D are not known and not incorporated into the pAVI. Consequently, because of atrial capture latency and increased AAT, the true left-sided AV electromechanical time is significantly shorter than the pAVI. The consequence of these effects is an increased risk that the pAVI is “too short,” resulting in left-sided timing disruptions (e.g., A-wave truncation). If RA pacing is accompanied by an increase in AV conduction time (see Fig. 31-73), the same considerations apply, except that the “outer bound” for the longest pAVI that will advance LV activation (AP→G) is increased. This may be a more favorable situation because a short pAVI that sufficiently advances delayed LV activation is less likely to result in left-sided timing disruptions (e.g., A-wave truncation).
The negative effect of atrial pacing on diastolic function during CRT is dramatic.122 The increase in AAT may result in severe diastolic dysfunction (A-wave truncation, E-A fusion) and reduced LV preload (Fig. 31-74). Typically, a pAVI offset (40-50 msec) is applied during atrial pacing to compensate for increased AAT by delaying ventricular contraction. In the absence of complete AV block, the increased pAVI results in progressive fusion with native ventricular conduction and withdrawal of ventricular resynchronization. The consequence of this unintended effect is a reduction in LV systolic pump function, indicated by increases in LV isovolumetric conduction time and ejection time. A sufficiently prolonged pAVI offset to prevent truncation of diastolic filling results in incomplete ventricular activation fusion. The probability of this scenario increases inversely with the P-R interval. At shorter P-R intervals during atrial pacing, pAVI extensions sufficient to eliminate A-wave truncation are more likely to result in loss of maximum LV preexcitation than at longer P-R intervals. A longer P-R interval provides greater leniency for allowing pAVI extensions to accommodate increased AAT without withdrawal of LV preexcitation.
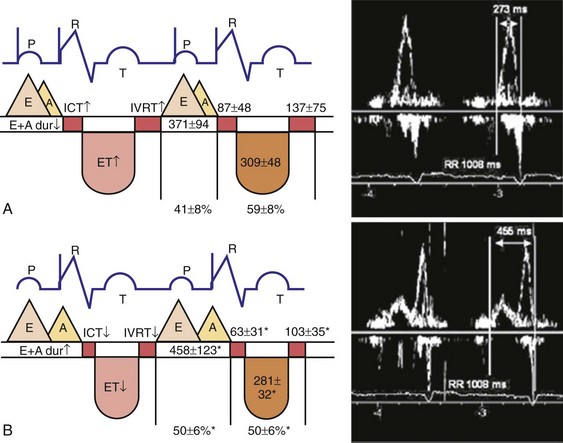
Figure 31-74 Effect of atrial pacing on diastolic function during CRT.
(Modified from Bernheim A, et al: Right atrial pacing impairs cardiac function during resynchronization therapy: acute effects of DDD pacing compared to VDD pacing. J Am Coll Cardiol 45:1482-1487, 2005.)
This problem is magnified by observations during invasive hemodynamic monitoring that indicate the maximum achievable increase in % LV dP/dt occurs at pAVI that is substantially longer during atrial pacing compared to atrial sensing (~mean 134 msec, range 69-262 msec vs. ~mean 208 msec, range 105-340 msec)115,123 (Figs. 31-75 and 31-76). This mean difference is substantially longer than the typical pAVI offset during atrial pacing in most CRT pacing systems (~40 to 60 msec). As noted, unless such patients have significantly prolonged P-R intervals, pAVIs in this range will result in incomplete LV resynchronization because of fusion between native ventricular conduction and paced activation wavefronts. For this reason, AV junction ablation has been advocated from patients with (1) relatively short P-R intervals, (2) requirement for atrial pacing, and (3) requirement for long pAVI during CRT to overcome atrial pacing–related diastolic dysfunction. If AV conduction is completely eliminated, the pAVI during CRT necessary to prevent compromise of LV preload during obligatory atrial pacing is not restrained by progressive loss of ventricular resynchronization due to fusion with native ventricular conduction.
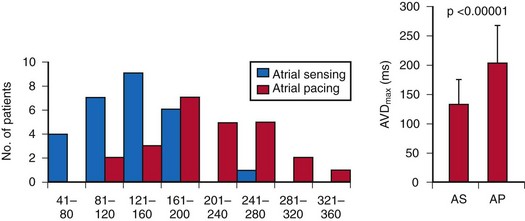
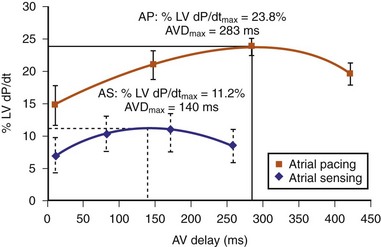
Interventricular Timing Considerations
The translational mechanism of CRT is ventricular activation wavefront fusion.12,72 Resynchronization of ventricular activation corrects part or all of the LBBB-related conduction delay. Replacement of LBBB activation with fusion activation instantaneously improves mechanics and initiates the processes leading to reverse volumetric remodeling. The best ventricular resynchronization occurs when the wavefronts from the RV pacing site (or originating from RBBc) and the LV pacing site collide halfway78 (see Fig. 31-10).
Fixed conduction blocks are characterized by a boundary of activation delay that interrupts and redirects activation wavefront propagation. Sequential ventricular activation is consistently observed during LBBB (RV→LV) and posterobasal left ventricle (near mitral valve annulus) is invariably the latest activated region. However, the location, orientation, and extent of conduction blocks display significant interpatient variability, yielding distinct patterns of LV epicardial activation during similar activation patterns registered on the surface ECG (Fig. 31-77).
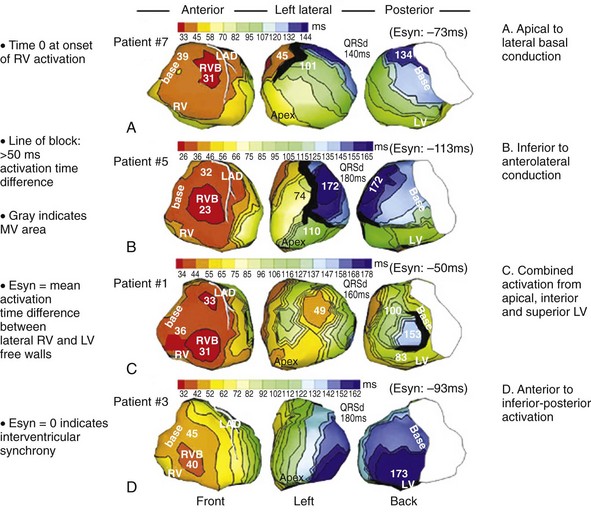
The physiologic basis of functional conduction blocks during LBBB is uncertain. The functional nature of such blocks is indicated by (1) absence of scar and (2) ability to shift the location of the line of block with pacing maneuvers (Figs. 31-78 and 31-79). These lines of functional block correlate with regional mechanical delay (Fig. 31-80).
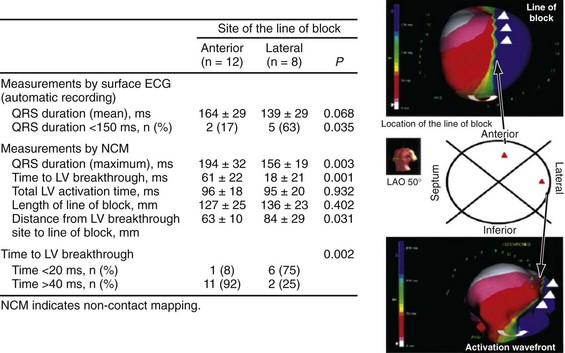
Figure 31-78 Lines of functional block during LBBB activation.
(Modified from Auricchio A, et al: Characterization of left ventricular activation in patients with heart failure and left bundle branch block. Circulation 109:1133-1139, 2004.)
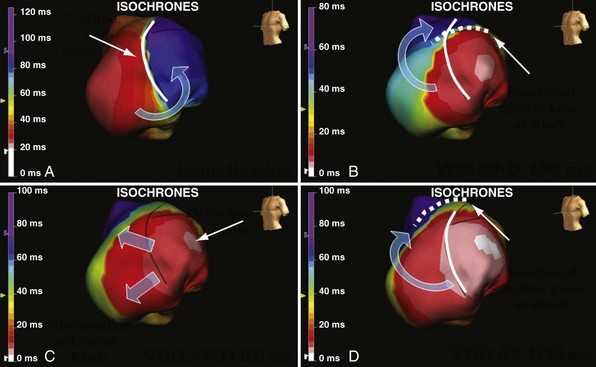
Figure 31-79 Manipulation of line of functional block during biventricular pacing.
(Courtesy Angelo Auricchio, MD.)
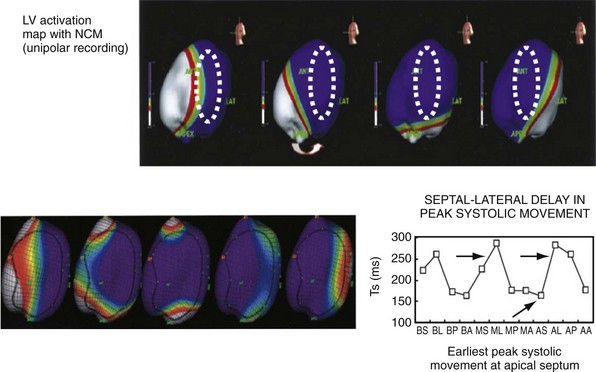
Figure 31-80 Correlation of line of functional block with regional mechanical delay.
(Modified from Fung JW et al: Variable left ventricular activation pattern in patients with heart failure and left bundle branch block. Heart 90:3-4, 2004.)
The implications of fixed and functional ventricular conduction blocks for CRT are significant. Because LV pacing usually targets the posterobasal left ventricle (latest activated region), conduction blocks usually reside between BiV pacing stimulation sites. This arrangement creates the opportunity for interference with the development of BiV pacing activation wavefront fusion. To reduce LV conduction delay maximally, LV stimulation must occur distal to the line of conduction block; LV paced activation wavefront must propagate out from the stimulation site; and R → L and L → R activation wavefronts must be properly timed to generate fusion (Figs. 31-81 and 31-82).
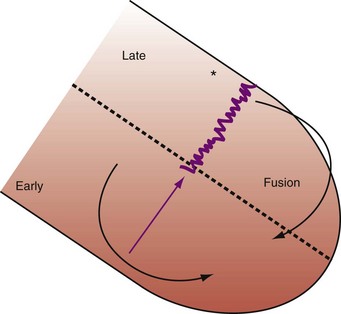
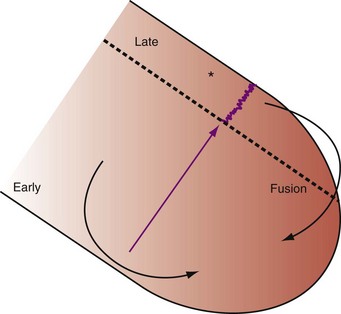
Under some conditions, the emergence of a line of functional block during LV pacing may facilitate correction of LBBB conduction delay despite stimulation from a relatively early-activated site (Fig. 31-83). Alternately, LV pacing from an early-activated site proximal to a line of block may worsen LBBB conduction delay (Figs. 31-84 and 31-85). Fixed or functional lines of block may “jail” (electrically isolate) large regions of the left ventricle despite electrical resynchronization at the remote stimulation sites (Figs. 31-86 and 31-87).
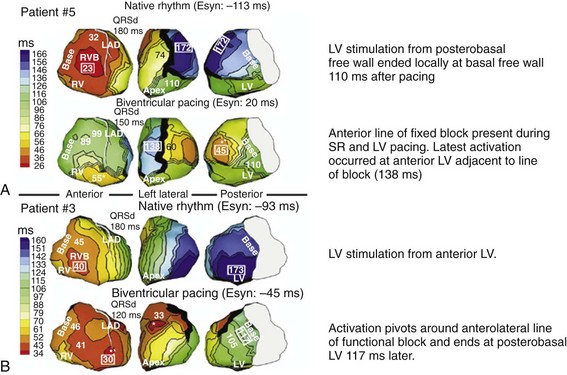
Figure 31-83 Hetergenous effects of conduction blocks and BV pacing on LV activation fusion.
Same visual display as in Figure 31-77. A: Top, Activation during LBBB is R→L with latest activation at posterobasal LV. Activation propagates apically around anterior line of fixed block (present during LBBB activation and BV paced activation). Bottom, Stimulation from posterobasal LV corrects conduction delay; latest activation occurs on anterior wall (fusion). B: Top, Activation during LBBB is R→L with latest activation at posterobasal LV; no line of block. During stimulation from anterior LV (not the most delayed region) a line of functional block emerges on the anterior wall (black). Paced activation wavefront propagates around the line of functional block activating the posterobasal LV early, correcting LV conduction delay.
(Modified from Jia P, et al: Electrocardiographic imaging of cardiac resynchronization therapy in heart failure: observation of variable electrophysiologic responses. Heart Rhythm 3:296-310, 2006.)
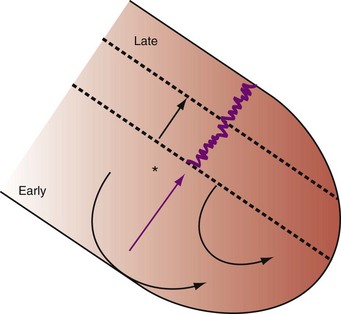
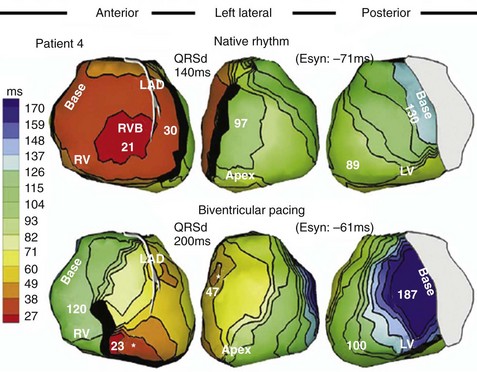
Figure 31-85 Worsening of LV conduction delay by stimulation proximal to line of block.
Same visual display as in Figures 31-77 and 31-83. Top, Activation during LBBB is R→L with latest activation at posterobasal left ventricle. Activation propagates apically around anterior line of fixed block. Bottom, Stimulation from anterior wall results in worsening LV conduction delay due to zone of slow conduction seen only during pacing (functional block).
(Modified from Jia P, et al: Electrocardiographic imaging of cardiac resynchronization therapy in heart failure: observation of variable electrophysiologic responses. Heart Rhythm 3:296-310, 2006.)
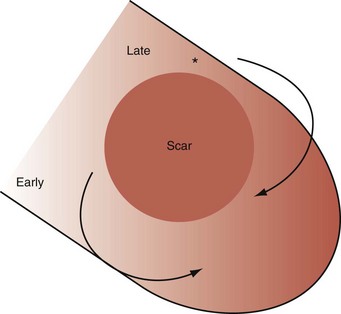
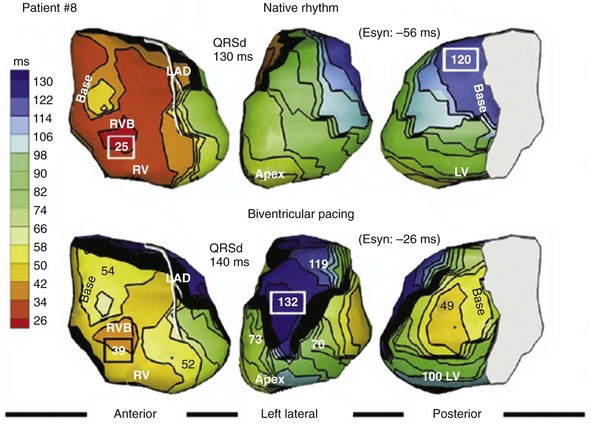
Figure 31-87 Negative effect of conduction block caused by scar, despite electrical resynchronization at stimulation sites.
Same visual display as in Figures 31-77, 31-83, and 31-85. Top, Activation during LBBB is R→L with latest activation at posterobasal left ventricle. Activation propagates apically around anterior line of fixed block. Bottom, Stimulation from posterobasal LV results in line of functional block that “jails” (electrically isolates) the entire anterior LV wall. The LV and RV stimulation sites are electrically synchronized, however the BiV paced activation wavefronts propagate around a large area of anterior wall delay.
(Modified from Jia P, et al: Electrocardiographic imaging of cardiac resynchronization therapy in heart failure: observation of variable electrophysiologic responses. Heart Rhythm 3:296-310, 2006.)
Fixed and functional blocks may also result in substantially different paced activation wavefront conduction times. Consequently, simultaneous BiV activation is dominated by, or duplicates, monochamber activation, usually favoring RV → LV (e.g., persistent R→L activation) (Figs. 31-88, 31-89, and 31-90).
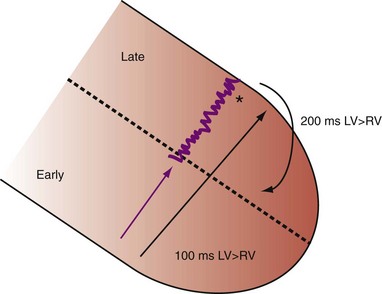
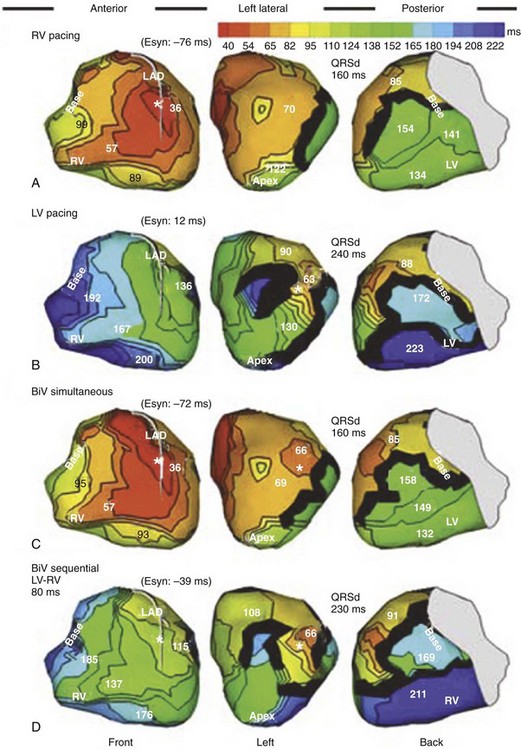
Figure 31-89 Negative effect of unequal RV ↔ LV paced conduction times on electrical resynchronization.
(Modified from Jia P, et al: Electrocardiographic imaging of cardiac resynchronization therapy in heart failure: observation of variable electrophysiologic responses. Heart Rhythm 3:296-310, 2006.)
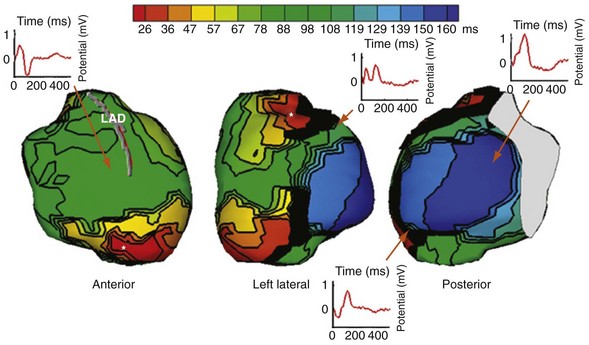
Figure 31-90 Sequential (R→L) ventricular activation despite simultaneous BiV pacing.
(Modified from Varma N, et al: Placebo CRT. J Cardiovasc Electrophysiol 19:878, 2008.)
Persistent R→L activation, despite LV pacing from a late-activated site, can also be generated by LV capture latency (Fig. 31-91). In this situation, local activation delay (time from LV pacing stimulus to QRS onset) simulates differential paced activation wavefront conduction times. This is similarly overcome by sequential BiV stimulation in which LV pacing is advanced sufficiently to account for capture latency. Capture latency and differential paced activation wavefront conduction times may coexist to yield persistent sequential (R→L) activation during BiV pacing (Fig. 31-92). Sequential BiV pacing (LV→RV) and increased LV voltage output (virtual electrode effect) are required to generate ventricular activation wavefront fusion (Fig. 31-93).
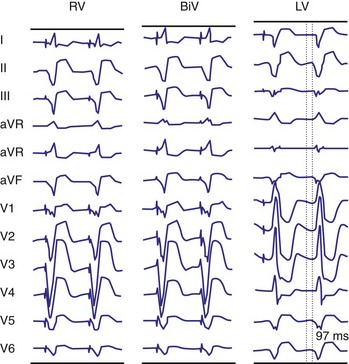
Figure 31-91 Sequential (R→L) ventricular activation despite simultaneous BiV pacing caused by LV capture latency.
(Modified from Herweg B et al: Latency during left ventricular pacing from the lateral cardiac veins: a cause of ineffectual biventricular pacing. Pacing and Clinical Electrophysiology 29:574-581, 2006.)
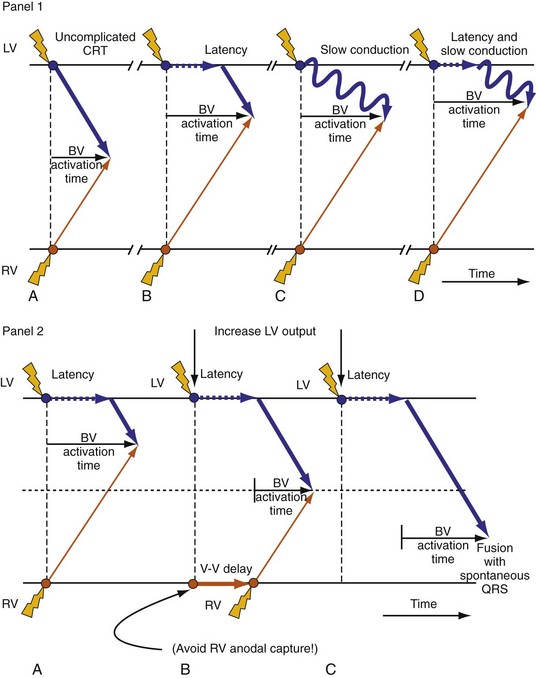
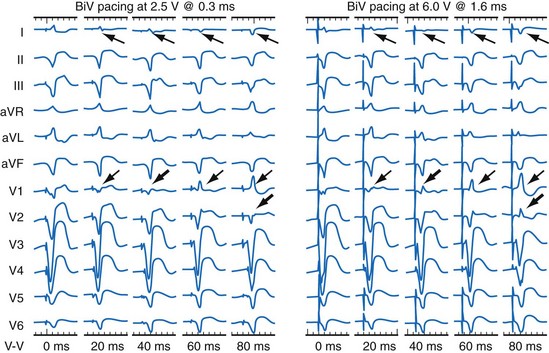
Same patient as in Figure 31-91. Left, Progressively earlier LV stimulation generates evidence of ventricular activation wavefront fusion (lead V1 QS→R, lead I R→QS). Right, These effects are enhanced by increased LV pacing output.
(Modified from Herweg B et al: Latency during left ventricular pacing from the lateral cardiac veins: a cause of ineffectual biventricular pacing. Pacing and Clinical Electrophysiology 29:574-581, 2006.)
An interesting related and counterintuitive observation is that equivalence of monochamber paced ventricular activation conduction times, measured between the RV and LV pacing sites, does not guarantee global activation wavefront fusion during simultaneous BiV pacing (Fig. 31-94). The most likely explanation for this is that the paced activation wavefront from the left ventricle is broadly delayed because of conduction blocks, even though the conduction path between the two stimulus sites yields simultaneous conduction times. This has significant implications for device-based automatic adjustment of BiV stimulation timing using local EGMs, since instructions based on simultaneous conduction times between pacing sites may not generate global activation fusion.
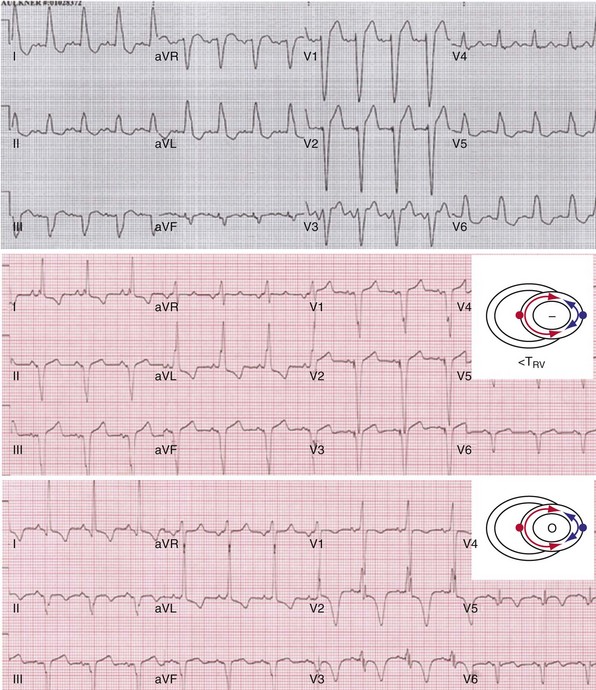
Implications of Spontaneous and Pacing-Induced Conduction Blocks During Biventricular Pacing
Against this background, a role of timed (sequential) ventricular stimulation exists. The ability to orchestrate ventricular chamber timing should theoretically provide additional leverage for overcoming functional and physiologic conduction barriers, to obtain maximum evidence of ventricular activation wavefront fusion. This is highlighted by the observation that simultaneous BiV pacing yields evidence of ventricular activation fusion, which is necessary for reverse volumetric remodeling, in only about 55% of cases.72
Implementation of Sequential Ventricular Timing in CRT Systems
Figure 31-95 shows an example of interventricular timing operation. The key operating points of V-V timing are (1) the pacemaker A-V interval determines the timing of the first ventricular pacing stimulus, (2) the pacemaker V-A interval (atrial escape interval) is calculated based on the timing of the first ventricular pacing stimulus, and (3) the timing of the second ventricular pacing stimulus is determined by the selected V-V interval. Some interactions with other aspects of pacemaker timing exist. For example, ventricular safety pacing and Ventricular Sense Response (Medtronic; see later) are delivered at the nominal V-V (~simultaneous BiV) interval. Interlocks between inviolable blanking periods, pAVI, ventricular tachyarrhythmia (VTA) detection intervals, and the selected V-V interval often arise and force reconciliation, usually in the form of more lenient spacing of sequential ventricular stimulation.
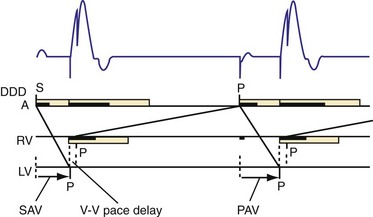
Clinical Experience with Sequential Ventricular Stimulation
Despite the compelling rationale for timed ventricular stimulation during BiV pacing, the aggregate clinical experience has been a disappointment. Although acute studies demonstrated improvement in various metrics of LV systolic and diastolic performance during sequential versus simultaneous BiV pacing,84,124,125 no such benefit has been recorded in randomized clinical trials. The Resynchronization for the Hemodynamic Treatment for Heart Failure Management (RHYTHM II ICD) study randomized 121 CRT patients to either simultaneous or “optimized” BiV pacing, possibly including sequential ventricular stimulation pacing.82 Echocardiographic metrics were used to determine V-V timing parameters in the “optimized” group. Interestingly, 28% were assigned simultaneous BiV pacing, whereas the remaining 72% received sequential ventricular pacing (V-V interval up to 80 msec). There was no difference in the composite endpoint of freedom from CRT-related complications, NYHA functional class, distance covered in 6-minute hall walk, or standard measures of quality of life at 6 months (Fig. 31-96). Similar absence of benefit of sequential BiV pacing was observed in the FREEDOM trial (see later).
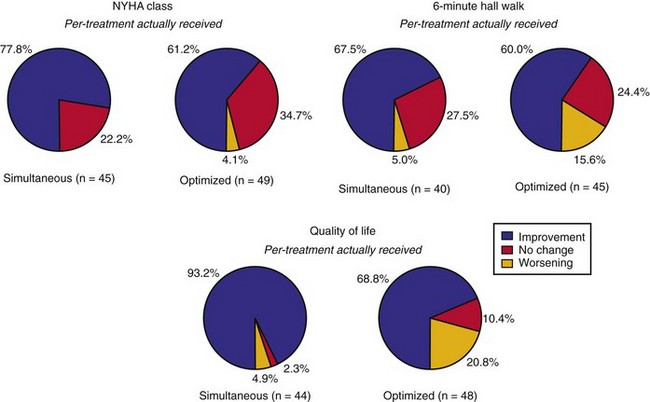
Methods for Automatic Adjustment of AV and VV Timing
SmartDelay Optimization (Boston Scientific)
The latest iteration of SmartDelay optimization recommends AVI settings derived from an algorithm originally validated through semi-automatic EGM-based measurement of pAVI/iAVI and QRSd measured on the surface ECG (see Electrogram Analysis). QRSd has been replaced by EGM-based estimates of interventricular conduction time. This process requires up to 2.5 minutes but is usually completed much sooner. The approach was developed from the results of several acute hemodynamic studies of CRT,115,126 which indicated that the AVI yielding the maximum increase in LV dP/dt (optimal AVI, optAVI) can be estimated by simple linear regression: optAVI = K1 × QRSd + K2 × (iAVI or pAVI) + K3. The three coefficients (K1-K3) to be used are determined by LV lead location (anterior or free wall) and pacing chamber (LUV or BiV).115 This equation recites the necessary and logical relationship between AVI, which titrates the dose of LV electrical resynchronization,13 and the severity of LV conduction delay, which is positively correlated with QRSd.72 The greater the LV conduction delay (QRSd), the shorter is the AVI required to overcome that delay by replacing a greater extent of delayed activation with paced activation. In this manner, optimal ventricular resynchronization is prioritized, whereas AV resynchronization is a second-order target.
The virtue of this approach is that it is derived from invasive hemodynamic measurements. Increases in LV dP/dt indicate improvement in global contractility and pumping efficiency and are associated with reduction in ventricular mechanical asynchrony. Increases in LV dP/dt during CRT occur without increasing myocardial oxygen consumption.127 Increases in LV dP/dt also correlate with increased aortic pulse pressure68 and stroke volume.
SmartDelay Operating Specifics
To collect the atrial sensed biventricular iAVI (AS-RVS, AS-LVS), the lower rate limit is reduced to 40 bpm (nominally) and the BiV pAVI is extended (up to 400 msec) to permit emergence of native AV and VV conduction. The intrinsic AVI is defined as the interval from an A sense (As) marker to first V sense (Vs) marker in each ventricular chamber. Once the atrial sensed test is completed, the algorithm automatically switches to the atrial paced portion of the test. The atrial paced BiV pAVI is similarly generated, except that the lower rate limit is increased to 80 bpm (nominally, or manually to at least 10-15 bpm above prevailing sinus rate, to force atrial pacing), and the pAVI is extended to 450 msec. The longer pAVI during atrial pacing increases the probability that BiV sensing will occur, since AVIs increase with atrial pacing at higher rates.7 These pAVIs apply only during SmartDelay operation (e.g., longest programmable pAVI during normal operation is 300 msec). The pAVI is defined as the interval from an A pace (Ap) marker to first V sense (Vs) marker in each ventricular chamber. For each condition (atrial sensing vs. pacing), the test initiates with a brief waiting period to allow stabilization of instrinsic AV conduction. Thereafter, at least 15 cycles are collected, outliers (>1 SD) are discarded, and approximately 15 AVIs are averaged to yield single representative atrial sensed biventricular iAVI and atrial paced pAVI.
Clinical Performance of SmartDelay
During acute hemodynamic monitoring, the EGM optimization method used in SmartDelay showed strong correlation (P <.0001) between maximum % increase in LV +dP/dt and maximum achievable % increase in LV +dP/dt during conditions of atrial sensing (R2 = 0.99) and atrial pacing (R2 = 0.96) (see Fig. 31-66). This EGM method was shown to yield the least difference between % LV +dP/dt and maximum achievable % LV +dP/dt during conditions of both atrial sensing and atrial pacing, compared with arbitrary pAVIs (100, 120, 140, 160 msec) or “best” pAVIs determined by the mitral inflow method or aortic VTI method.115
The SMART-AV Trial, a 1014-patient, randomized, multicenter, double-blind, three-armed comparison of CRT optimization techniques demonstrated no benefit of SMART-AV or echo-guided mitral inflow analysis as compared to a fixed AVD.128
Limitations of SmartDelay Approach
The exact mechanism of the improvement in ventricular mechanics using the regression formula that forms the basis of SmartDelay is unclear. An interaction among pAVI, QRSd, and maximum hemodynamic improvement has been observed.126,129 For longer QRSd (>150 msec), the probability of improvement is greater than shorter QRSd (<150 msec) and occurs at shorter pAVIs (≈50% of iAVI, or P-R interval). For QRSd < 150 msec, the hemodynamic improvement occurs at longer pAVIs (≈75% of iAVI, or P-R), and worsens at shorter pAVIs. A logical but unproven interpretation of these observations is that greater LV conduction delay (longer QRSd) requires greater correction with paced activation, which is titrated by a shorter pAVI. Reciprocally, lesser LV conduction delay (shorter QRSd) requires less paced activation replacement (longer pAVI). However, in some patients the acute hemodynamic response derived by the regression formula may be caused by optimal AV timing, rather than ventricular resynchronization.126
A potentially significant weakness of SmartDelay is the application of simultaneous BiV pacing, which yields evidence of ventricular activation fusion (necessary for reverse remodeling) about 55% of the time.72 Therefore, many patients with an acute hemodynamic response to SmartDelay optAVI probably did not have electrical resynchronization. This likely explains, at least in part, the historical “paradox” that acute hemodynamic improvement is not always followed by long-term volumetric remodeling. On the other hand, if the acute hemodynamic improvement is caused by ventricular resynchronization primarily (and possibly optimal AV timing secondarily), long-term remodeling should occur, assuming LV conduction delay is sufficiently present and LV scar volume is not prohibitive. In summary, a potential problem with SmartDelay is that it does not directly account for ventricular conduction times because the test is conducted at the AV level. An obvious enhancement would be to add ventricular conduction tests and appropriate recommendations for sequential ventricular pacing.
QuickOpt (St. Jude Medical)
QuickOpt Operating Specifics
QuickOpt has two adjustment stages: AV timing and VV timing. AV timing recommendations are made during forced atrial sensing on the basis of the time measured interval from RA sensed event (surrogate for P-wave onset) to the end of the far-field (RA tip to CAN) P wave, which is held to represent IACT (Fig. 31-97). The optimal iAVI and pAVI are then calculated according to the following formulas. When IACT > 100 msec, SAVQO = IACT + 30 msec; when IACT < 100 msec, SAVQO = IACT + 60 msec. These arbitrary offsets are intended to guarantee that ventricular pacing does not induce diastolic dysfunction (A-wave truncation, atrial transport block). The optimal pAVIQO is similarly composed, except that an additional 50 msec is arbitrarily added to account for “atrial capture latency.” Limited justification for these calculations was provided in an unpublished clinical study of nine patients that demonstrated “reasonable correlation” with echo-based determination of optimal AVIs.130
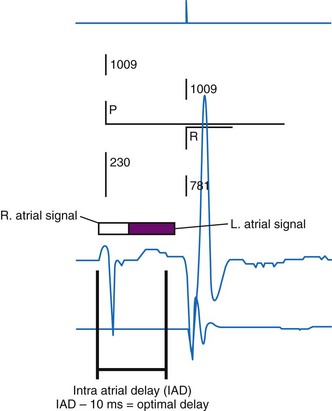
Clinical Performance of QuickOpt
QuickOpt was evaluated in 58 patients using maximum aortic velocity time integral (AoVTI) as the surrogate hemodynamic endpoint131 (Fig. 31-98). High concordance was observed between maximum AoVTI determined by the echocardiogram method, compared with the AoVTI achieved at the EGM-based settings for optimal AVI (AVQO), and optimal V-V interval (VVQO). The conclusion of this acute surrogate hemodynamic study was that this EGM method for AV and VV timing adjustment was equivalent to an echocardiographic-based approach (AoVTI).
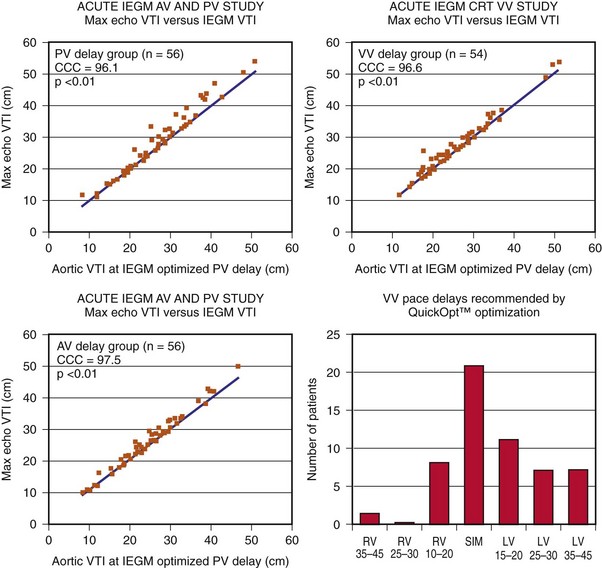
Limitations of QuickOpt
Regarding the acute surrogate hemodynamic study of QuickOpt, the high concordance was calculated between the AoVTI at predicted optimal AVIs, not between the predicted optimal AVIs. This is expected given the relatively flat dose-response relationship between AoVTI on AV/VV timing adjustments. The accuracy of estimating IACT with RA near-field to CAN EGM has not been validated. This measurement can be easily confounded by lack of a clear offset of atrial activation on the far-field EGM (e.g., low-amplitude P wave) and far-field R-waves. The arbitrary offsets to the sAVI and pAVI are not validated, and this approach provides no guarantee that atrial truncation (transport block) does not occur. The physiologic basis for VVQO equation is unknown. The purported goal of this approach is to generate ventricular activation wavefront fusion, but no evidence supports this. A key implicit assumption is that when intrinsic VV conduction delay and bidirectional paced ventricular conduction times are both 0, simultaneous BiV pacing will yield activation wavefront fusion. Another assumption is that wavefront fusion occurs with equal contribution (50%) from RV and LV pacing. Neither of these assumptions has been validated. Equivalent conduction times between widely spaced RV and LV stimulation sites does not guarantee that simultaneous BiV pacing will generate global ventricular activation wavefront fusion. None of these approaches provides evidence that ventricular activation wavefront fusion, the translational mechanism and primary target of CRT titration, has been achieved. QuickOpt recommended RV → LV sequential BiV pacing in 25% of patients with LBBB (e.g., wrong ventricular chamber first).131
Strategies for Maintaining Continuous Crt
In practical experience 100% BiV (LV) pacing is difficult to achieve. Transient interruptions to CRT occur in up to 36% of patients; permanent loss of CRT occurs in up to 5% of patients within 2 years. The diverse causes often relate to the complex interplay between spontaneous electrical activity (the patient) and inviolable elements of timing cycle operation (the device).132 Uninterrupted CRT can usually be restored by modification to critical pacing control parameters and correction of patient conditions that degrade CRT response independent of electrical operation.