[level-membership-for-anesthesiology-category]
7 Total Intravenous Anesthesia and Target-Controlled Infusion
Total Intravenous Anesthesia
Indications
The most common indications for total intravenous anesthesia (TIVA) techniques in children are the following: those at risk for malignant hyperthermia (in whom volatile agents are to be avoided); children with a high risk of postoperative nausea and vomiting; brief radiologic or painful procedures, when rapid recovery is needed (e.g., magnetic resonance imaging, bone marrow aspiration, gastrointestinal endoscopy); frequent repeated anesthesia (e.g., radiation therapy); major surgery to control the stress response; neurosurgical procedures to assist with control of intracranial pressure and for cerebral metabolic protection, spinal instrumentation, and when evoked motor and auditory brain potentials are needed; and children in need of airway procedures (e.g., bronchoscopy).1–4 Total intravenous sedation and anesthesia are used in pediatric intensive care, but propofol is specifically contraindicated for prolonged use with high infusion rates in very sick or young children, because of the propofol infusion syndrome risk.5–14
Drugs and Techniques
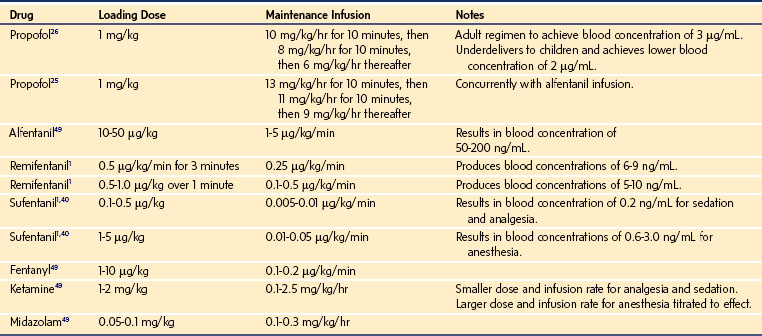
The most commonly used medications include propofol, remifentanil, alfentanil, and sufentanil; ketamine is occasionally used.15 Delivery can be by a manual infusion scheme (Table 7-1) or by using pharmacokinetic model–driven infusion devices with software developed specifically for use in children. Unfortunately, the commercially available software packages usually limit the applicable age from 1 to 3 years or older, or weight from 10 to 15 kg or greater, and the pharmacokinetic (PK) parameters are derived from studies of a relatively few healthy children. Propofol programs that allow for age-, weight-, and gender-related changes in central compartment volume, clearance, and distribution have been developed and perform well in healthy children.16,17 However, there are considerable gaps in knowledge for some drugs, for ill children, and for young children, infants, and neonates, so caution is needed when applying such programs to these populations. Therefore, the anesthesiologist can use these preprogrammed devices as a basis for initiating a TIVA technique but must also use skill, knowledge, and experience to titrate the intravenous (IV) agents to avoid awareness, pain, and adverse effects.
Principles
Healthy children often need a relatively high dose of IV agent per unit of body weight, and maintenance infusion rates need to be higher than the weight-corrected dose for adults.18 Conversely, the immature neonate, the critically ill child, or those with major organ failure need considerably smaller doses of IV anesthetic agents; care is particularly needed in children receiving vasoactive medication and those with congenital heart disease.19 Titration is advisable to allow for wide interindividual variation in PK and pharmacodynamics (PD). Electronic monitoring of depth of anesthesia (processed electroencephalography) has not been sufficiently well-validated in infants and children, and is yet to be used as the sole guide to dosing. After IV injection, it is assumed that the drug rapidly and evenly distributes throughout the body. However, the drug is delivered into the venous side of the systemic circulation, passes through the pulmonary circulation, and then distributes to the major organs and other tissues, all of which have variable blood flow, metabolic enzyme activity, and composition (in terms of proportions of fat and water). Because regional blood flow, body composition, and body proportions vary during development, the PK and PD of drugs are even more complex in children than in adults.
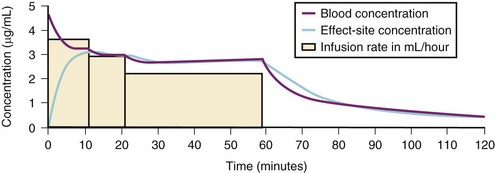
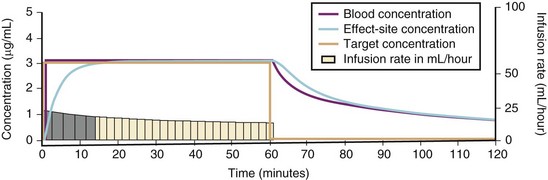
For a fixed infusion rate in a single compartment model, it takes five half-lives to reach a steady-state concentration (greater than 96% of the target) in the blood (Fig. 7-1). To more rapidly achieve steady-state conditions, a bolus dose or loading infusion may be administered. This rapidly fills the Vd, after which a new rate of infusion is calculated to maintain the blood concentration (Fig. 7-2). This is the dilemma of manual infusions; this loading dose has to pass the central volume and is usually so large that it will cause adverse effects, hemodynamic instability, and/or toxicity. Even a remifentanil bolus should be administered over several minutes to reduce the risk of bradycardia, hypotension, and/or difficult mask ventilation.

To more clearly understand the disposition of drugs after an IV dose, it is useful to consider a three-compartment model. The drug is delivered and eliminated from a central compartment, V1 (which includes the blood), but also distributes to and redistributes from two peripheral compartments, one representing well-perfused organs and tissues (fast compartment, V2), and the other representing more poorly perfused tissues, such as fat (slow compartment, V3) (Table 7-2). The transfer of the drug between the central compartment (V1) and the two peripheral compartments (V2, V3), and also the elimination of the drug from the central compartment, is described by a series of clearances indicating the distribution back and forth between paired compartments, such as V1 to V2 and then V2 back to V1. The primary target organ that IV anesthetic agents affect is the brain. Therefore, an additional rate constant (keo) is added to describe the equilibration between the central compartment and the effect site in the brain. This compartment is not represented by a volume but rather by the time required to equilibrate. Consequently, there is a time lag before changes in the blood concentration are reflected in the effect site (see Figs. 7-1 and 7-2).
| Term | Meaning | Units |
|---|---|---|
| TCI | Target-controlled infusion | |
| Vc or V1 | Central compartment volume | L |
| V2 | Fast compartment volume (vessel rich group) = V1 × k12/k21 | L |
| V3 | Slow compartment volume (vessel poor group) = V3 × k13/k31 | L |
| CL1 | Elimination clearance = V1 × k10 | L/hr |
| CL2 or Q2 | Clearance between V1 and V2 = V2 × k21 | L/hr |
| CL3 or Q3 | Clearance between V1 and V3 = V3 × k31 | L/hr |
| Cp | Blood concentration | |
| Ce | Effect-site concentration | |
| T | Target concentration | |
| CALC | Concentration calculated by TCI software | |
| MEAS | Concentration measured | |
| k10 | Elimination rate constant | /min |
| keo | Rate constant for equilibration between blood and effect-site | /min |
| T1/2keo | Half-time for equilibration between blood and effect-site |
min |
| k12, k21 | Rate constants for movement between V1 and V2 | /min |
| k13, k31 | Rate constants for movement between V1 and V3 | /min |
A hydraulic model is useful for understanding these concepts. The central compartment is connected to the peripheral compartments and effect site by a series of pipes of different diameters, and also to a drainage pipe to represent elimination (Fig. 7-3, A through F). The heights of the columns of fluid, which represent concentrations of drug, illustrate the gradient down which drug travels between the central and peripheral compartments, and this can be animated over time to show filling and emptying of compartments relative to each other. The diameter of the interconnecting pipes between the central and peripheral compartments represents the intercompartment clearances, and size of the drainage channel represents elimination. This hydraulic analogy is used in the Tivatrainer PK simulation program.20
Fixed Infusion Rate and a Three-Compartment Model
When a fixed infusion rate is started (see Fig. 7-1), the blood concentration will increase but, almost simultaneously, distribution of drug to the fast compartment and elimination both begin. Distribution of drugs throughout the body contributes more to the removal of drug from blood than elimination for most medications. For remifentanil, extremely rapid esterase clearance dominates. As the concentrations within each compartment equilibrate, the concentration gradient between compartments lessens (slowing drug transfer between compartments) but distribution to the slow compartment continues along with elimination. The net effect is that the blood concentration continues to increase, albeit at a slower rate. As the blood concentration increases toward equilibrium, elimination becomes relatively more important; Figure 7-1 illustrates how far behind the effect-site concentration lags. Eventually, after several hours (or in some cases, days), a steady state is reached where infusion rate is directly proportional to clearance.
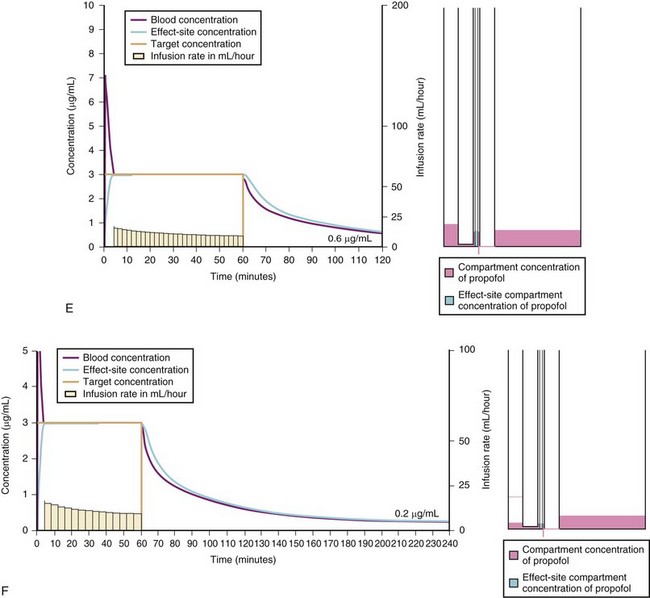
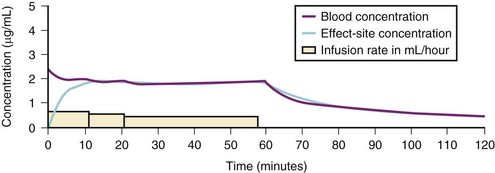
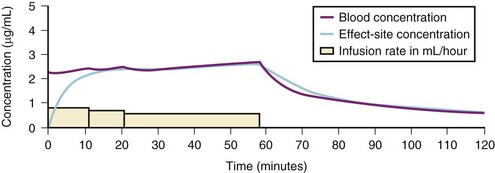
Bolus and Variable Rate Infusion in a Three-Compartment Model
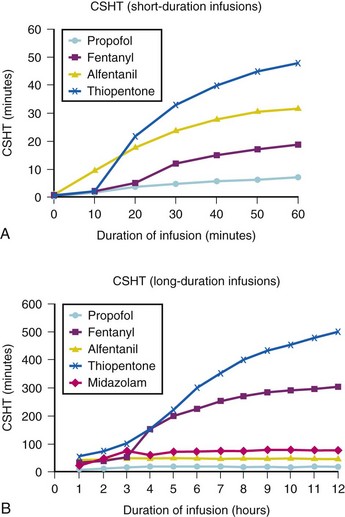
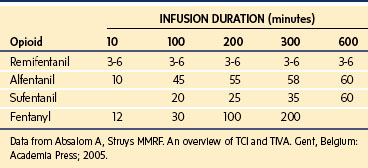
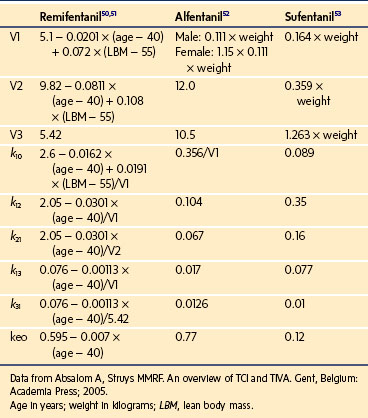
A loading dose can start to fill the central compartment and ideally should be aiming to create an effect-site concentration at a specific target concentration without overshoot. Then the rate of infusion should decrease in a stepwise manner to maintain a constant effect-site concentration until a steady state is reached. As drug is delivered into the central compartment, it continuously distributes to the peripheral compartments while it is continuously eliminated. The infusion rate must vary because it has to match the changes in the contribution of distribution and elimination with time (Figs. 7-4 and 7-5). When the infusion is stopped, then elimination will continue to drain the central compartment, and drug will continue to distribute to V2 and V3 along concentration gradients from V1 for some time. Equilibrium may be reached, but the drug now begins to move back from the peripheral compartments into the central compartment, maintaining the central compartment drug concentration for a period of time. This can continue for a protracted interval, particularly for highly lipid-soluble drugs that have a very large slow compartment V3 and a reservoir or depot effect (see Fig. 7-3, F). Eventually the central compartment concentration will decrease. For most anesthetics, the longer the duration of an infusion, the more the drug has distributed into the peripheral compartments, and the larger the reservoir of drug to be redistributed back into the central compartment and eliminated, once the infusion ceases. The half-time of the decrease in drug concentration in blood, therefore, is related to the duration of the infusion for most drugs (except remifentanil [see later discussion]). This is termed the context-sensitive half-time (CSHT), where the context is the duration of the infusion and relates to a pseudo–steady-state maintained by a target-controlled infusion (see later discussion). For an individual drug in an individual patient, CSHT can be plotted against the duration of the infusion (Fig. 7-6, A and B). The CSHT graph will eventually become parallel to the time axis and this is when the pseudo–steady-state becomes a true steady-state. At that time, the infusion has become context insensitive. This pattern is observed for nearly all IV anesthetics. The exception is remifentanil, whose half-time becomes context insensitive almost immediately after initiation of the infusion, because its elimination is rapid and complete; the capacity of the red cell, plasma, and tissue esterase enzyme systems are enormous (Table 7-3). The relevant PK parameters for remifentanil, alfentanil, and sufentanil are summarized in Table 7-4.1 The differences in CSHTs are illustrated in Table 7-3 and Figure 7-6, A and B. Fentanyl has a small CSHT when given by infusion for a short time, but this dramatically increases as the duration of the infusion increases. Alfentanil’s CSHT reaches a plateau after approximately 90 minutes of infusion. Clearances of fentanyl, alfentanil, and sufentanil are reduced in neonates and young infants because of the immaturity of hepatic enzyme systems, whereas clearance of remifentanil is relatively age-independent because esterases are ubiquitous throughout the body and are fully mature in neonates.
Administration of propofol can affect its own distribution and elimination by altering regional blood flow. Both fentanyl and alfentanil increase the volume of V1 and clearance of propofol, whereas propofol and midazolam inhibit the metabolism of alfentanil by the cytochrome P-450 enzyme isoform CYP3A4. Recent evidence in adults suggests that both sevoflurane and remifentanil can significantly increase the plasma concentrations of propofol.21,22 In addition to these PK interactions there are important synergistic PD interactions between agents that suppress central nervous system activity.23,24 For TIVA techniques in children, concurrent administration of opioids has a significant “propofol-sparing” effect, while providing analgesia and stress control.24,25 It is especially important to take advantage of this synergism to avoid excessive propofol and long-chain triglyceride load, particularly with concerns about propofol infusion syndrome. Remifentanil provides the most effective propofol-sparing effect, but fast recovery means alternative techniques of analgesia must be well established before the remifentanil is discontinued. Fentanyl, alfentanil, and sufentanil are effective in this regard; local and regional analgesia techniques also allow significant propofol dose reduction once the block becomes established. Nitrous oxide and low concentrations of inhalational anesthetics also act synergistically with propofol and opioids.
Manual Infusion Schemes
Propofol
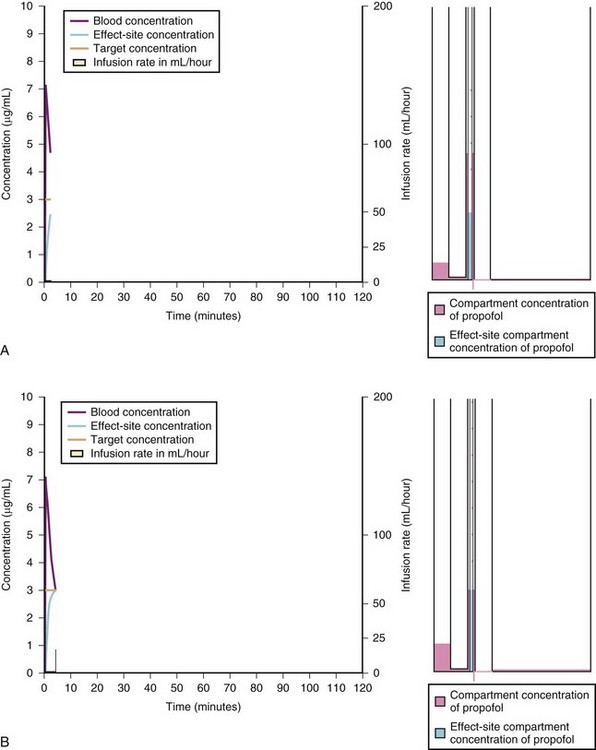
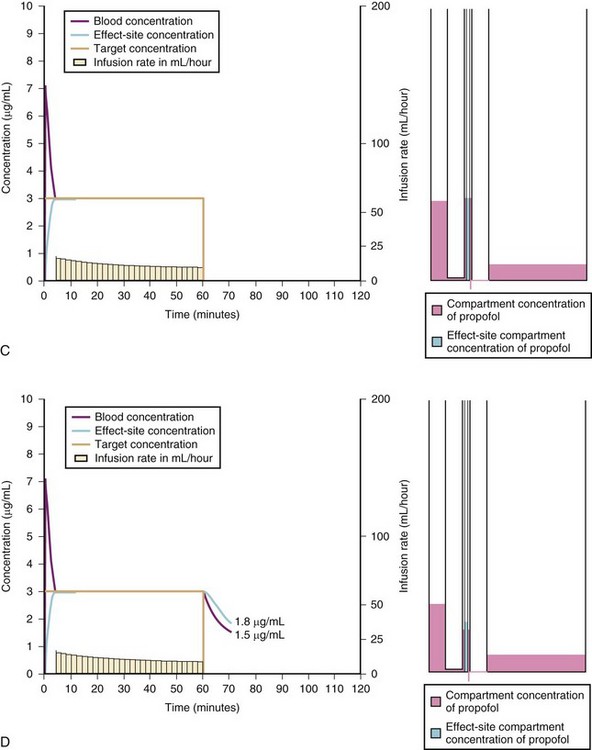
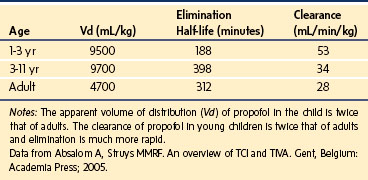
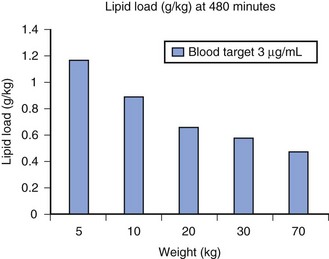
A simple scheme was devised to maintain a blood concentration of propofol in healthy adults of 3 µg/mL.26 A bolus IV dose of 1 mg/kg is followed by a continuous infusion of 10 mg/kg/hr for 10 minutes, then 8 mg/kg/hr for 10 minutes, then 6 mg/kg/hr thereafter. When this “10, 8, 6” regimen is modeled and verified using the Marsh model for an adult patient, the estimated blood concentration slightly exceeds 3 µg/mL, but remains reasonably stable.27 This simple dosing regimen is very effective in adults (see Fig. 7-2). However, when the same regimen is modeled using the “Paedfusor” PK data set for a child 1 year old and weighing 10 kg, the blood concentration achieved is approximately 2 µg/mL, but decreases slowly over time. Thus, this regimen delivers a subtherapeutic blood concentration of propofol in children. The subtherapeutic concentrations of propofol occurred because of a larger central compartment and an increased clearance of propofol in children compared with adults (see Fig. 7-4, Table 7-5). When the Paedfusor is used to calculate the dose of propofol that is required to achieve a blood concentration of 3 µg/mL, the bolus dose needed is 50% greater than in adults (1.5 mg/kg) and the infusion rates needed are approximately “19, 15, 12” each for 10-minute infusion. In addition, it takes approximately 15 minutes for the effect-site concentration to reach 3 µg/mL (Fig. 7-7). These data from the Paedfusor support the notion that the dosing of propofol infusions in young children is approximately twice that in adults. Similar results are predicted using the PK data set of Kataria et al28 for children 3 to 11 years,29 and in clinical adaptations of PK models.30 This increased dose requirement can cause problems, because propofol is formulated in lipid and the lipid load can be considerable, particularly in young patients (Fig. 7-8). Propofol formulations are now available in concentrations varying from 5 mg/mL to 20 mg/mL (0.5% to 2%), and the most effective “lipid-sparing” strategy for infusions is to use 20 mg/mL propofol (2%), as this immediately decreases the lipid load.
Opioids
Simple manual infusion regimens can be used for the opioids fentanyl, alfentanil, remifentanil, and sufentanil. The manual infusion regimens for these opioids in children are summarized in Table 7-1. Transitioning to maintenance analgesia after infusions of these opioids is a significant issue, and it is important to ensure either adequate regional or local anesthesia techniques are established or that adequate doses of systemic analgesia are given well before the infusion is discontinued. Transitioning is somewhat smoother after sufentanil than after alfentanil or remifentanil in children. The problem of acute tolerance to ultra–short-acting opioids has been noted after use of remifentanil in surgery for pediatric scoliosis.31
Ketamine
Ketamine can be used in a simple basic manual regimen as a loading dose of 1 to 2 mg/kg and a maintenance infusion of 0.1-2.5 mg/kg/hr, depending on whether the target state is analgesia, sedation, or anesthesia (see Table 7-1).
Midazolam
Slow bolus dosing of up to 0.1 mg/kg followed by an infusion rate of 0.1 mg/kg/hr provides baseline sedation with adjustments and additional bolus doses often needed. Caution is required, with bolus dosing in neonates and infants and in the critically ill because hypotension may occur and the depth of sedation achieved with midazolam is tremendously variable (see Table 7-1).
Target-Controlled Infusion
A target-controlled infusion (TCI) is controlled by a computer that performs rapid sequential calculations every 8 to 10 seconds to determine the infusion rate required to produce a user-defined drug concentration in the central compartment (which includes the blood) or at the effect site of action of the drug in the brain.1 Thus, TCI may be blood targeted or effect-site targeted. The standard nomenclature for TCI systems is listed in Table 7-2. Modern TCI systems are computer-controlled syringe drivers capable of infusion rates up to 1200 mL/hr, with a precision of 0.1 mL/hr. They incorporate a user interface and display and a range of safety alarms, monitoring functions, and warning systems. For most programs, the user has to choose a drug and its concentration from a menu and one must also select a PK parameter set (referred to as a “model”). The models suitable for use in children are quite limited, and some models are not suitable for all age groups. Others may be suitable but have not been validated in younger children; neonatal and infant models are quite rare. Experience with the various models may be gained by running simulation programs, such as Tivatrainer (www.eurosiva.org/TivaTrainer/tivatrainer_main.htm) or Rugloop (http://www.demed.be/rugloop.htm), on a personal computer. Tivatrainer now allows uploading of new models via a central website and server, and contains details and simulations of pediatric models for propofol, and neonatal and pediatric models for sufentanil, in addition to a wide range of adult models for propofol, alfentanil, remifentanil, fentanyl, ketamine, and midazolam. The simulation shows animated graphs of blood and effect-site concentrations against time, infusion rates, volumes, compartment sizes, and many other features.
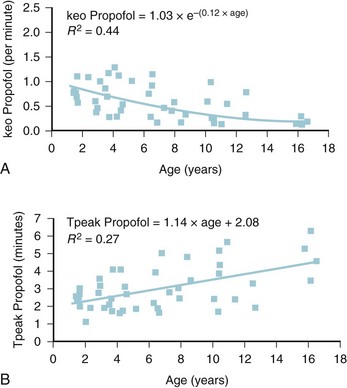
The models within TCI systems are derived from studies of small numbers of healthy patients, and are only a guide to drug administration for an individual patient.17 The accuracy of TCI propofol has been assessed in children.17,27 TCI propofol has been incorporated into a modified version of the commercial “Diprifusor” device; it is known as the Paedfusor32 and has been evaluated clinically and found to perform well (Table 7-6).27,33,34 In children undergoing cardiac surgery, the model performed significantly better than the adult model in adults.32,35,36 Several pediatric propofol models have been validated17,28 (Table 7-7), but all models have problems.37 Experience shows that clinicians need to learn how to use each model to optimize levels of anesthesia, to ensure stability during induction and maintenance phases, and to enhance recovery speed and quality. Most pediatric models overestimate the initial Vd17 which risks too large an initial bolus dose.17 The Paedfusor model makes an allowance for the steady increase of clearance with age in younger children, particularly those below 30 kg in weight (see Tables 7-6 and 7-7, Fig. 7-9). The minimum age and weight limits for each model also differ, with 1 year of age and 5 kg for the Paedfusor system, and 3 years of age and 15 kg for the Kataria system. Below a weight of 12.5 kg and an age of 2 years, the second compartment becomes negative with the Kataria model, which means that model cannot be used clinically in such young patients. For simulation using the Paedfusor parameters, the adult value for keo of 0.26 per minute (T1/2keo 2.7 minutes) can be used (see Table 7-7). This means effect-site targeting may be simulated with Paedfusor (Table 7-8), and it may be possible to display a predicted concentration for an effect-site while using a pump in blood-targeted TCI mode, as with Diprifusor. Attempts have been made by Munoz to define a more accurate keo for children, in an ingenious study using auditory evoked responses with both the Paedfusor and Kataria models.38 For children 3 to 11 years of age, the median extrapolated keo values for the Paedfusor models was 0.91 per minute (T1/2keo 0.8 minutes), and for the Kataria model, 0.41 per minute (T1/2keo 1.7 minutes). The bispectral index (BIS) was used to derive a value for the time to peak effect, and hence keo.39–41 It was concluded that the time to peak effect after a bolus dose was shorter in children than adults, as the extrapolated T1/2keo values were considerably smaller, although this extrapolation may be flawed when considering a TCI system.37 Similar findings were reported by Hahn and colleagues using state entropy monitoring.42 This has enabled calculation of an age-specific range of values for the keo (Fig. 7-10), which should allow more accurate effect-site targeting using propofol in the future. It must be stressed that compartmental values are highly specific to a single model, and are not interchangeable.17,37 It can be argued that these calculations and extrapolations are a trick to get around imperfect PK values.17,37 Integrating PK and PD into models appropriate for use in children is challenging not least because of doubts about the sensitivity and specificity of depth of anesthesia monitoring in children.42–45
| 1-12 years | V1 = 0.4584 × weight; V2 = V1 × k12/k21; V3 = V1 × k13/k31 |
| k10 = 0.1 527 × weight−0.3 | |
| k12 = 0.114; k21 = 0.055 | |
| k13 = 0.0419; k31 = 0.0033 | |
| keo = 0.26 | |
| 13 years | V1 = 0.400 × weight |
| k10 = 0.0678 | |
| (other constants as above) | |
| 14 years | V1 = 0.342 × weight |
| k10 = 0.0792 | |
| (other constants as above) | |
| 15 years | V1 = 0.284 × weight |
| k10 = 0.0954 | |
| (other constants as above) | |
| 16 years | V1 = 0.22857 × weight |
| k10 = 0.119 | |
| (other constants as above) |
Note: The k10 value in the age group 1-12 years is a negative power function of weight that reflects the increasing clearance values in younger children.
k10, Elimination rate constant; k12 and k21, rate constants for movement between V1 and V2; k13 and k31, rate constants for movement between V1 and V3; keo, effect-site equilibration rate constant; V1, central compartment volume; V2, fast compartment volume; V3, slow compartment volume.
TABLE 7-7 Comparison between Paedfusor and Kataria Parameters for Propofol in Children
| Paedfusor27,32,35,36 | Kataria28 |
|---|---|
| V1 0.458 × weight | 0.41 × weight |
| V2 0.95 × weight | 0.78 × weight + 3.1 × age |
| V3 5.82 × weight | 6.9 × weight |
| k10 0.1 527 × weight−0.3 | 0.085 |
| k12 0.114 | 0.188 |
| k21 0.055 | 0.102 |
| k13 0.0419 | 0.063 |
| k31 0.0033 | 0.0038 |
| keo 0.26* | N/A* |
k10, Elimination rate constant; k12 and k21, rate constants for movement between V1 and V2; k13 and k31, rate constants for movement between V1 and V3; keo, effect-site equilibration rate constant; V1, central compartment volume; V2, fast compartment volume; V3, slow compartment volume.
*This is the value for adults, but Munoz and colleagues38 have studied these two models to define a more accurate keo for children 3 to 11 years of age, and the values are 0.91 for Paedfusor and 0.41 for Kataria. Jeleazcov39 has derived age-related keo values by the formula keo = 1.03 × e−(0.12 × age).
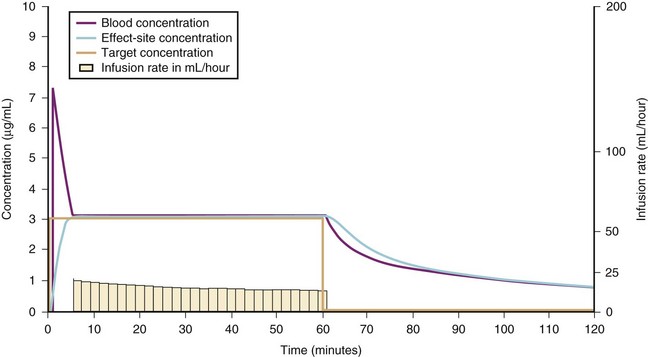
TABLE 7-8 Example of Target-Controlled Infusion (5 µg/mL) Based on Calculated Blood-Concentration Targeting Compared with Calculated Effect-Site Concentration Targeting for a Healthy 1-Year-Old (Weight 10 kg), Using the Paedfusor Pharmacokinetic Parameters
| Blood Concentration Targeting | Effect-Site Concentration Targeting | |
|---|---|---|
| Loading dose | 1.7 mg/kg | 5.7 mg/kg* |
| Maximum blood target reached | 5 µg/kg | 12 µg/kg* |
| Total propofol infused after 60 minutes | 23.2 mg/kg | 23.3 mg/kg |
| Time to achieve effect site target of 5 µg/mL | 17.5 minutes | 4.5 minutes† |
*Potential for hemodynamic changes due to high peak blood concentration from larger bolus dose.
†Very much shorter time to achieve effect-site target.
Effect-site targeting offers the advantages of more rapid achievement of desired depth of anesthesia and less titration of the target depth in practice, but whilst it has been used in research in children, it has yet to become a clinical tool.46 Table 7-8 shows how the behavior of the TCI differs between blood and effect-site targeted infusion using the adult keo of 0.26 per minute (T1/2keo 2.7 minutes). It can be expected that effect-site targeting may have more profound cardiovascular and respiratory effects than blood targeting, because of the larger initial bolus doses and resultant higher peak blood propofol concentrations attained.46 It is known that slower administration of propofol preserves spontaneous respiration in children.47 However, use of age-appropriate keo and T1/2keo values and careful titration from a low initial target value may ameliorate these adverse effects. However, the variable keo of the Jeleazcov dataset, derived from using BIS, means adverse effects may be more marked in infants (Fig. 7-11 and 7–12).39,46 Although the use of BIS remains uncertain in children,48 particularly those less than 2 years old, the use of the Jeleazcov model in TCI systems gives the prospect of more accurate and efficient propofol delivery to children.46 This has safety implications in terms of reducing lipid load and clinical utility by increasing speed of recovery (Fig. 7-13).
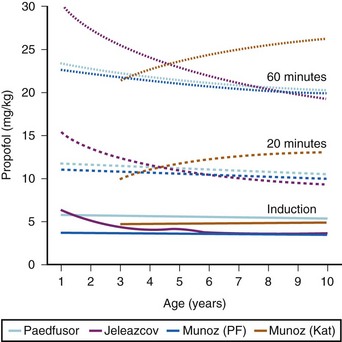
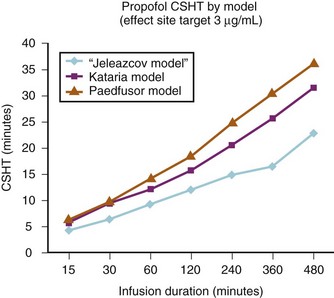
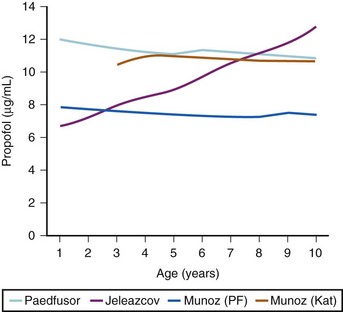
FIGURE 7-13 The peak plasma concentrations attained in simulations in Figure 7-12 for an effect-site target of 5 µg/mL are shown. The high boluses noted in Table 7-8 do not necessarily equate to high peak plasma concentrations because of the variable volumes of distribution in the pediatric models at different ages.
(Data from Limb J, Morton NS. Age-specific effect-site TCI in children: modelling using TivaTrainer. Anaesthesia 2010;65:542 and Absalom A. A hitch-hiker’s guide to the intravenous PK/PD galaxy. Pediatr Anesth 2011;21:915-8)
1 Absalom A, Struys MMRF. An overview of TCI and TIVA. Gent, Belgium: Academia Press; 2005.
2 Morton NS. Total intravenous anaesthesia (TIVA) in paediatrics: advantages and disadvantages. Paediatr Anaesth. 1998;8:189–194.
3 Eyres R. Update on TIVA. Paediatr Anaesth. 2004;14:374–379.
4 Lerman J. TIVA, TCI, and pediatrics: where are we and where are we going? Pediatr Anesth. 2010;20:273–278.
5 Bray RJ. Propofol infusion syndrome in children. Paediatr Anaesth. 1998;8:491–499.
6 Bray RJ. Propofol-infusion syndrome in children. Lancet. 1999;353:2074–2075.
7 Hatch DJ. Propofol-infusion syndrome in children. Lancet. 1999;353:1117–1118.
8 Murdoch SD, Cohen AT. Propofol-infusion syndrome in children. Lancet. 1999;353:2074–2075.
9 Kelly DF. Propofol-infusion syndrome. J Neurosurg. 2001;95:925–926.
10 Wolf A, Weir P, Segar P, et al. Impaired fatty acid oxidation in propofol infusion syndrome. Lancet. 2001;357:606–607.
11 Short TG, Young Y. Toxicity of intravenous anaesthetics. Best Pract Res Clin Anaesthesiol. 2003;17:77–89.
12 Vasile B, Rasulo F, Candiani A, et al. The pathophysiology of propofol infusion syndrome: a simple name for a complex syndrome. Intensive Care Med. 2003;29:1417–1425.
13 Riker RR, Fraser GL. Adverse events associated with sedatives, analgesics, and other drugs that provide patient comfort in the intensive care unit. Pharmacotherapy. 2005;25:8S–18S.
14 Tobias JD. Sedation and analgesia in the pediatric intensive care unit. Pediatr Ann. 2005;34:636–645.
15 Mani V, Morton NS. Overview of total intravenous anesthesia in children. Pediatr Anesth. 2010;20:211–222.
16 Constant I, Rigouzzo A. Which model for propofol TCI in children? Pediatr Anesth. 2010;20:233–239.
17 Sepulveda P, Cortinez LI, Saez C, et al. Performance evaluation of paediatric propofol pharmacokinetic models in healthy young children. Br J Anaesth. 2011;107:593–600.
18 Hill SA. Pharmacokinetics of drug infusions. Continuing education in anaesthesia, critical care & pain. 2004;4:76–80.
19 Wong GL, Morton NS. Total intravenous anesthesia (TIVA) in pediatric cardiac anesthesia. Pediatr Anesth. 2011;21:560–566.
20 Engbers F, Sutcliffe N, Kenny GNC, Tivatrainer, 8.5th ed. 2006. www.eurosiva.org/TivaTrainer/tivatrainer_main.htm.
21 Nishikawa K, Kanemaru Y, Hagiwara R, et al. The influence of sevoflurane on the bispectral index, regional cerebral oxygen saturation, and propofol concentration during propofol/N2O anesthesia. J Clin Monit and Comput. 2006;20:415–420.
22 Yufune S, Takamatsu I, Masui K, et al. Effect of remifentanil on plasma propofol concentration and bispectral index during propofol anaesthesia. Br J Anaesth. 2011;106:208–214.
23 Vuyk J. Pharmacokinetic and pharmacodynamic interactions between opioids and propofol. J Clin Anesth. 1997;9:23–26.
24 Drover DR, Litalien C, Wellis V, et al. Determination of the pharmacodynamic interaction of propofol and remifentanil during esophagogastroduodenoscopy in children. Anesthesiology. 2004;100:1382–1386.
25 Browne BL, Prys-Roberts C, Wolf AR. Propofol and alfentanil in children: infusion technique and dose requirement for total i.v. anaesthesia. Br J Anaesth. 1992;69:570–576.
26 Roberts FL, Dixon J, Lewis GT, et al. Induction and maintenance of propofol anaesthesia. A manual infusion scheme. Anaesthesia. 1988;43:14–17.
27 Marsh B, White M, Morton N, et al. Pharmacokinetic model driven infusion of propofol in children. Br J Anaesth. 1991;67:41–48.
28 Kataria BK, Ved SA, Nicodemus HF, et al. The pharmacokinetics of propofol in children using three different data analysis approaches. Anesthesiology. 1994;80:104–122.
29 McFarlan CS, Anderson BJ, Short TG. The use of propofol infusions in paediatric anaesthesia: a practical guide. Paediatr Anaesth. 1999;9:209–216.
30 Engelhardt T, McCheyne AJ, Morton N, et al. Clinical adaptation of a pharmacokinetic model of plasma propofol concentrations in children. Pediatr Anesth. 2008;18:235–239.
31 Crawford MW, Hickey C, Zaarour C, et al. Development of acute opioid tolerance during infusion of remifentanil for pediatric scoliosis surgery. Anesth Analg. 2006;102:1662–1667.
32 Absalom A, Kenny GNC. “Paedfusor” pharmacokinetic data set. Br J Anaesth. 2005;95:110.
33 Doyle E, McFadzean W, Morton NS. IV anaesthesia with propofol using a target-controlled infusion system: comparison with inhalation anaesthesia for general surgical procedures in children. Br J Anaesth. 1993;70:542–545.
34 Varveris DA, Morton NS. Target controlled infusion of propofol for induction and maintenance of anaesthesia using the paedfusor: an open pilot study. Paediatr Anaesth. 2002;12:589–593.
35 Amutike D, Lal A, Absalom A, et al. Accuracy of the Paedfusor: a new propofol target-controlled infusion system for children. Br J Anaesth. 2001;87:175P–176P.
36 Absalom A, Amutike D, Lal A, et al. Accuracy of the “Paedfusor” in children undergoing cardiac surgery or catheterization. Br J Anaesth. 2003;91:507–513.
37 Absalom A. A hitch-hiker’s guide to the intravenous PK/PD galaxy. Pediatr Anesth. 2011;21:915–918.
38 Munoz HR, Cortinez LI, Ibacache ME, et al. Estimation of the plasma effect site equilibration rate constant (keo) of propofol in children using the time to peak effect: comparison with adults. Anesthesiology. 2004;101:1269–1274.
39 Jeleazcov C, Ihmsen H, Schmidt J, et al. Pharmacodynamic modelling of the bispectral index response to propofol-based anaesthesia during general surgery in children. Br J Anaesth. 2008;100:509–516.
40 Glass PSA, Shafer SL, Reves JG. Intravenous drug delivery systems. In: Miller RD, ed. Anesthesia. 5th ed. New York: Churchill-Livingstone; 2000:377–411.
41 Schuttler JJ, Ihmsen H. Population pharmacokinetics of propofol: a 17 multicenter study. Anesthesiology. 2000;92:727–738.
42 Hahn J-O, Khosravi S, Dumont G, et al. Two-stage vs mixed-effects approach to pharmacodynamic modeling of propofol in children using state entropy. Pediatr Anesth. 2011;21:691–698.
43 Anderson BJ, Hodkinson B. Are there still limitations for the use of target-controlled infusion in children? Curr Opin Anesthesiol. 2010;23:356–362.
44 Rigouzzo A, Servin F, Constant I. Pharmacokinetic-pharmacodynamic modeling of propofol in children. Anesthesiology. 2010;113:343–352.
45 Coppens M, Eleveld DJ, Proost JH, et al. An evaluation of using population pharmacokinetic models to estimate pharmacodynamic parameters for propofol and bispectral index in children. Anesthesiology. 2011;115:83–93.
46 Limb J, Morton NS. Age-specific effect-site TCI in children: modelling using TivaTrainer. Anaesthesia. 2010;65:542.
47 Dosani M, McCormack J, Reimer E, et al. Slower administration of propofol preserves adequate respiration in children. Pediatr Anesth. 2010;20:1001–1008.
48 Tirel O, Wodey E, Harris R, et al. Variation of bispectral index under TIVA with propofol in a paediatric population. Br J Anaesth. 2008;100:82–87.
49 Shann F. Drug doses, 13th ed. Melbourne: Royal Children’s Hospital; 2005.
50 Minto CF, Schnider TW, Egan TD, et al. Influence of age and gender on the pharmacokinetics and pharmacodynamics of remifentanil. I. Model development. Anesthesiology. 1997;86:10–23.
51 Minto CF, Schnider TW, Shafer SL. Pharmacokinetics and pharmacodynamics of remifentanil. II. Model application. Anesthesiology. 1997;86:24–33.
52 Maitre PO, Vozeh S, Heykants J, et al. Population pharmacokinetics of alfentanil: the average dose-plasma concentration relationship and interindividual variability in patients. Anesthesiology. 1987;66:3–12.
53 Bovill JG, Sebel PS, Blackburn CL, Oei-Lim V, Heykants JJ. The pharmacokinetics of sufentanil in surgical patients. Anesthesiology. 1984;61:502–506.
[/level-membership-for-anesthesiology-category][not-level-membership-for-anesthesiology-category]
7 Total Intravenous Anesthesia and Target-Controlled Infusion
Total Intravenous Anesthesia
Indications
The most common indications for total intravenous anesthesia (TIVA) techniques in children are the following: those at risk for malignant hyperthermia (in whom volatile agents are to be avoided); children with a high risk of postoperative nausea and vomiting; brief radiologic or painful procedures, when rapid recovery is needed (e.g., magnetic resonance imaging, bone marrow aspiration, gastrointestinal endoscopy); frequent repeated anesthesia (e.g., radiation therapy); major surgery to control the stress response; neurosurgical procedures to assist with control of intracranial pressure and for cerebral metabolic protection, spinal instrumentation, and when evoked motor and auditory brain potentials are needed; and children in need of airway procedures (e.g., bronchoscopy).1–4 Total intravenous sedation and anesthesia are used in pediatric intensive care, but propofol is specifically contraindicated for prolonged use with high infusion rates in very sick or young children, because of the propofol infusion syndrome risk.5–14
Drugs and Techniques
The most commonly used medications include propofol, remifentanil, alfentanil, and sufentanil; ketamine is occasionally used.15 Delivery can be by a manual infusion scheme (Table 7-1) or by using pharmacokinetic model–driven infusion devices with software developed specifically for use in children. Unfortunately, the commercially available software packages usually limit the applicable age from 1 to 3 years or older, or weight from 10 to 15 kg or greater, and the pharmacokinetic (PK) parameters are derived from studies of a relatively few healthy children. Propofol programs that allow for age-, weight-, and gender-related changes in central compartment volume, clearance, and distribution have been developed and perform well in healthy children.16,17 However, there are considerable gaps in knowledge for some drugs, for ill children, and for young children, infants, and neonates, so caution is needed when applying such programs to these populations. Therefore, the anesthesiologist can use these preprogrammed devices as a basis for initiating a TIVA technique but must also use skill, knowledge, and experience to titrate the intravenous (IV) agents to avoid awareness, pain, and adverse effects.
Principles
Healthy children often need a relatively high dose of IV agent per unit of body weight, and maintenance infusion rates need to be higher than the weight-corrected dose for adults.18 Conversely, the immature neonate, the critically ill child, or those with major organ failure need considerably smaller doses of IV anesthetic agents; care is particularly needed in children receiving vasoactive medication and those with congenital heart disease.19 Titration is advisable to allow for wide interindividual variation in PK and pharmacodynamics (PD). Electronic monitoring of depth of anesthesia (processed electroencephalography) has not been sufficiently well-validated in infants and children, and is yet to be used as the sole guide to dosing. After IV injection, it is assumed that the drug rapidly and evenly distributes throughout the body. However, the drug is delivered into the venous side of the systemic circulation, passes through the pulmonary circulation, and then distributes to the major organs and other tissues, all of which have variable blood flow, metabolic enzyme activity, and composition (in terms of proportions of fat and water). Because regional blood flow, body composition, and body proportions vary during development, the PK and PD of drugs are even more complex in children than in adults.
For a fixed infusion rate in a single compartment model, it takes five half-lives to reach a steady-state concentration (greater than 96% of the target) in the blood (Fig. 7-1). To more rapidly achieve steady-state conditions, a bolus dose or loading infusion may be administered. This rapidly fills the Vd, after which a new rate of infusion is calculated to maintain the blood concentration (Fig. 7-2). This is the dilemma of manual infusions; this loading dose has to pass the central volume and is usually so large that it will cause adverse effects, hemodynamic instability, and/or toxicity. Even a remifentanil bolus should be administered over several minutes to reduce the risk of bradycardia, hypotension, and/or difficult mask ventilation.
To more clearly understand the disposition of drugs after an IV dose, it is useful to consider a three-compartment model. The drug is delivered and eliminated from a central compartment, V1 (which includes the blood), but also distributes to and redistributes from two peripheral compartments, one representing well-perfused organs and tissues (fast compartment, V2), and the other representing more poorly perfused tissues, such as fat (slow compartment, V3) (Table 7-2). The transfer of the drug between the central compartment (V1) and the two peripheral compartments (V2, V3), and also the elimination of the drug from the central compartment, is described by a series of clearances indicating the distribution back and forth between paired compartments, such as V1 to V2 and then V2 back to V1. The primary target organ that IV anesthetic agents affect is the brain. Therefore, an additional rate constant (keo) is added to describe the equilibration between the central compartment and the effect site in the brain. This compartment is not represented by a volume but rather by the time required to equilibrate. Consequently, there is a time lag before changes in the blood concentration are reflected in the effect site (see Figs. 7-1 and 7-2).
| Term | Meaning | Units |
|---|---|---|
| TCI | Target-controlled infusion | |
| Vc or V1 | Central compartment volume | L |
| V2 | Fast compartment volume (vessel rich group) = V1 × k12/k21 | L |
| V3 | Slow compartment volume (vessel poor group) = V3 × k13/k31 | L |
| CL1 | Elimination clearance = V1 × k10 | L/hr |
| CL2 or Q2 | Clearance between V1 and V2 = V2 × k21 | L/hr |
| CL3 or Q3 | Clearance between V1 and V3 = V3 × k31 | L/hr |
| Cp | Blood concentration | |
| Ce | Effect-site concentration | |
| T | Target concentration | |
| CALC | Concentration calculated by TCI software | |
| MEAS | Concentration measured | |
| k10 | Elimination rate constant | /min |
| keo | Rate constant for equilibration between blood and effect-site | /min |
| T1/2keo | Half-time for equilibration between blood and effect-site |
min |
| k12, k21 | Rate constants for movement between V1 and V2 | /min |
| k13, k31 | Rate constants for movement between V1 and V3 | /min |
A hydraulic model is useful for understanding these concepts. The central compartment is connected to the peripheral compartments and effect site by a series of pipes of different diameters, and also to a drainage pipe to represent elimination (Fig. 7-3, A through F). The heights of the columns of fluid, which represent concentrations of drug, illustrate the gradient down which drug travels between the central and peripheral compartments, and this can be animated over time to show filling and emptying of compartments relative to each other. The diameter of the interconnecting pipes between the central and peripheral compartments represents the intercompartment clearances, and size of the drainage channel represents elimination. This hydraulic analogy is used in the Tivatrainer PK simulation program.20
Fixed Infusion Rate and a Three-Compartment Model
When a fixed infusion rate is started (see Fig. 7-1), the blood concentration will increase but, almost simultaneously, distribution of drug to the fast compartment and elimination both begin. Distribution of drugs throughout the body contributes more to the removal of drug from blood than elimination for most medications. For remifentanil, extremely rapid esterase clearance dominates. As the concentrations within each compartment equilibrate, the concentration gradient between compartments lessens (slowing drug transfer between compartments) but distribution to the slow compartment continues along with elimination. The net effect is that the blood concentration continues to increase, albeit at a slower rate. As the blood concentration increases toward equilibrium, elimination becomes relatively more important; Figure 7-1 illustrates how far behind the effect-site concentration lags. Eventually, after several hours (or in some cases, days), a steady state is reached where infusion rate is directly proportional to clearance.
Bolus and Variable Rate Infusion in a Three-Compartment Model
A loading dose can start to fill the central compartment and ideally should be aiming to create an effect-site concentration at a specific target concentration without overshoot. Then the rate of infusion should decrease in a stepwise manner to maintain a constant effect-site concentration until a steady state is reached. As drug is delivered into the central compartment, it continuously distributes to the peripheral compartments while it is continuously eliminated. The infusion rate must vary because it has to match the changes in the contribution of distribution and elimination with time (Figs. 7-4 and 7-5). When the infusion is stopped, then elimination will continue to drain the central compartment, and drug will continue to distribute to V2 and V3 along concentration gradients from V1 for some time. Equilibrium may be reached, but the drug now begins to move back from the peripheral compartments into the central compartment, maintaining the central compartment drug concentration for a period of time. This can continue for a protracted interval, particularly for highly lipid-soluble drugs that have a very large slow compartment V3 and a reservoir or depot effect (see Fig. 7-3, F). Eventually the central compartment concentration will decrease. For most anesthetics, the longer the duration of an infusion, the more the drug has distributed into the peripheral compartments, and the larger the reservoir of drug to be redistributed back into the central compartment and eliminated, once the infusion ceases. The half-time of the decrease in drug concentration in blood, therefore, is related to the duration of the infusion for most drugs (except remifentanil [see later discussion]). This is termed the context-sensitive half-time (CSHT), where the context is the duration of the infusion and relates to a pseudo–steady-state maintained by a target-controlled infusion (see later discussion). For an individual drug in an individual patient, CSHT can be plotted against the duration of the infusion (Fig. 7-6, A and B). The CSHT graph will eventually become parallel to the time axis and this is when the pseudo–steady-state becomes a true steady-state. At that time, the infusion has become context insensitive
[/not-level-membership-for-anesthesiology-category]
